
Why did I make that promise? I must be mad! Anyway, here it is, The Deutsche Covid stress – and seriously, you’d better switch immediately to your favourite Trump or Covid meme threads, because this could be long and geeky! 1/N
How do we approach this? The goal is to see what their Common Equity Tier 1 (CET1) ratio could look like by FY2020. Maybe you think CET1 is a bad measure, but it’s what supervisors use & they call the shots – so it’s what matters 😊
CET1 ratio is CET1/RWA. Let’s start with CET1. Now that Basel 2 transition is almost over, FY2020 CET1 will mostly be driven by P&L. DB’s P&L is a gigantic mess, with many moving parts, especially as they‘re in a restructuring process.
The bank is more or less breakeven, with ROE <2%, some profitable business (such as AM) but an IB which is too costly and a difficult German retail market (the former Deutsche Postbank).
If one strips the many restructuring costs and XO items, remaining items that matter are NII, costs and markets revenues. Our first element of stress is going to be on NII: down 10%, as both restructuring & Covid stress will bite.
Fees and costs should be in line with consensus, I see no reason to have a significantly different view. Of course, I could go for the full Monty and have a 20-tab worksheet with 500 parameters and play with them.
But then, as soon as I deviate from consensus, a little voice in my head is going to be like “are you really sure that -24.7% for fees in the Indian corporate market is the right number?” And I’ll get back to consensus without even realizing it!
So forget it, focus on the big picture.
Other big items are litigation & trading.
Other big items are litigation & trading.
I won’t go into litigation.
Who the hell knows what could happen? It’s pretty clear that the bulk of the shitstorm is in the past anyway. But if you’re interested, the dozen or so pages in the AR are always a nice read.
Who the hell knows what could happen? It’s pretty clear that the bulk of the shitstorm is in the past anyway. But if you’re interested, the dozen or so pages in the AR are always a nice read.
Big issues include the Danske Bank case or Regula and Cum-Ex cases for example
Trading is going to be very unpredictable, obviously. On Monday they announced a great quarter. It could be a trend for the year – or not.
Here, we’re facing our first big challenge for stressing Deutsche. What about their trading/derivatives book? Of course, it’s the favourite topic of Zerohedge: Deutsche’s infamous quadrizillion derivatives book. How can we stress it for Covid?
Let’s be honest, we can’t. It’s simply too complex. We have a few data points, though: we know the market risk RWA (25bn€) and we also have the EBA 2018 stress test on market risk. This had a 1.1bn€ loss in the first year – but then positive years (+1.6bn each)
Is this a useful guide? Honestly, I don’t think so. That stress test had a lot of very dubious assumptions, coming out of the blue. My goal here is not to stress every item in DB’s P&L, but to look for a realistic Covid scenario.
And honestly, I don’t even think they’ll lose trading money because of what’s happening. Q1 suggests the opposite. Maybe they will, but it’s a coin toss, and a few hundred million by a rogue trader won’t move the needle much.
Another reason to suggest they won’t take a trading loss is their track record: they never took a trading loss in the last 20 years. 

“Uh sorry, what? Have you gone mad? What about 2008 and that 10bn loss”? Well, if you believe this was actually trading, you still haven’t understood what happened during the GFC! Sometimes, a trading book is NOT for trading, it’s just a regulatory arbitrage.
My conclusion: let’s put it simply and assume 0 trading income for 2020. (that’s the recent trend anyway!)
What happens if you put all this together? Well, you get good old Deutsche: a bank that makes no money. As in 0. (Within the margin of error, which is at least 500 million for a bank that size.)
But of course, we left out that slight little problem of having people stay home, businesses being closed and GDP tanking minus whatever huge % you want to use! Ooops.
And, as it turns out, Deutsche is also a real bank that does real lending… and takes real loan losses! This will have a large impact, but how much?
Forecasting this has never been more difficult than today, because you have two opposite effects, both them with sizes we’ve never seen before!
GDP is going to go down quicker than ever (and maybe recover quicker than ever) but we also have the largest public support ever, since the Marshall Plan, with virtually all EU governments offering almost illimited public guarantees on loans!
How the hell can we model this?
I start by assuming no special public support - and then I'll try to factor the support.
The general approach to credit risk modelling at banks is summarized in this slide from the SSM (2018 ST results)
The general approach to credit risk modelling at banks is summarized in this slide from the SSM (2018 ST results)
As you can see, macro is an important driver of provisions (no shit Sherlock!) but depending on books & jurisdictions, the important variables vary. But macro is not enough: the red boxes – impacts of individual loan book characteristics - are large!

Let's set aside portfolio characteristics for now & start with the macro variables & scenarios. Their point is to tell us “where we are” in the cycle, i.e. if the “intensity of default” (more on this later) is defined as 1 on the cycle average, what about today? Is it 2? 0.5? 6?
Maybe you think this is just econometric bullshit. But this is what I get with the standard AR(1) macro model used by banks to model loan losses, applied to Deutsche's quarterly loss rate over the past 20 years. Not bad.

Don’t get overexcited, though, there is obviously some overfitting in this, and we are going to do scenarios with macro values rarely seen in the past. But still, the model does a decent job of predicting where we are in the cycle.
Obviously, you’re all thrilled now! What does the model say for next year!! Pleaaase I want to seeeee. SHOW ME THE NUMBERS! Ok, here it is, using consensus forecasts for GDP and Unemployment.

Ouch! Doesn’t look too good, does it? Three major implications: the model says provisions will spike in Q2, definitely not Q1, and it also says cost of risk will be approx. 3x the previous years. *This is the important number we need for the “intensity of default”*
You might wonder why I have only used German macro data. Deutsche is supposed to be a global bank! Fair point, but the Pillar 3 disclosure gives us the geographical split of expected credit losses per country:

The truth is, I also use a pinch of Italian or Irish macro data – but they’re not hugely relevant because those books are mostly defaulted books in run-off. For example, the average probability of default of the Irish retail book is 99.41% 😊. A beauty!
Shall we stop here and simply use that number for loan losses? It’s an option, & you won't be far off, but let’s dig deeper, because the world has changed since the 2000s.
Book split has changed, but, even more importantly, supervisory expectations have changed for the coverage ratios when NPLs rise! The SSM has forced (mostly Italian) banks to increase coverage (LLP/NPL) & this is not something we’ve seen for most German banks (yet.)
So I’m not satisfied with just using this number. Before I continue, I need to explain the “intensity of default” thing. Default is not the only thing that matters for a bank: credit migration does too.
If a BBB loan becomes BB, capital requirements will increase and expected losses too. And this will impact CET1. So, you need to understand how the rating split (including default) will move over time. To do this, one uses rating transition matrices.
This is just a matrix which looks like this and gives the share of end rating (1y later) depending on the current rating.

How do you use such matrices?
If you want to know what will happen in 1y, just multiply the vector of rating weights by the transition matrix. In two years? By the square of the matrix. Etc. See, your linear algebra class in college was actually useful!
But be careful, this is a so-called “Through The Cycle” transition matrix, i.e. an average over a long period of time. At any point in time, the current cycle could be good or bad. And you model this with the “intensity of default”
Which is just the power exponent of the matrix used to compute your next year distribution of ratings. If the intensity of default is 3, next year rating split will be given by multiplying by the cube of the matrix.
And if your intensity is not an integer, then you really need to remember your linear algebra class: diagonalize the matrix, and everything becomes easy.
Enough algebra, now we have two things: the intensity of default (3) and the transition matrix. We can apply it to the actual loan books of Deutsche: because banks do actually provide information on the rating split of their books!
Here's an example with the two biggest loan books of Deutsche. (Each bucket is a probability of default PD bucket for which we have also average PD)
Now we can simulate the impact of our intensity of default simulation to each of DB’s regulatory loan books (rather than using the “business” loan book split, because the data is far more accurate for the regulatory split).
We still need two items before we can get to credit losses. The first one is exposure, and the second is coverage (average provisions for a defaulted loan.)
I’ve discussed the issue of exposure before (see my thread on Barclays): in a nutshell, the issue is that banks “weigh” undrawn credit exposures with a Credit Conversion Factor (CCF) before calculating risk metrics. See below for DB’s corporate book.

Put simply, what a CCF means is this: if you authorize someone to have a 100€ overdraft and they don't use it, if your CCF is 35%, you recognize an exposure of 35€.
But the day they use it, that 35€ exposure instantly becomes 100€.
I think you can see the risk there.
But the day they use it, that 35€ exposure instantly becomes 100€.
I think you can see the risk there.
Because during a crisis, corporates draw on those lines. So it’s not only the loss rate which increases, but the number by which you multiply the loss rate! If you don’t believe me, just look at this chart from JPM which focuses only on LARGE corps.

The picture is likely to be worse for SME or intermediate companies. When the shit hits the fan, run for cash. That’s pretty easy to understand.
That's why we will use a multiplying factor for the disclosed CCF – honestly this is more an educated "guessestimate" than an accurate econometric analysis, because data is very poor on this important factor in banking risk.
Coverage now. This is really puzzling. As I’m sure you’re all aware, the SSM has put a huge pressure on large banks to have “best in class” coverage on NPLs, usually above 50%.
Italian banks have been “kindly” asked to sell NPL books at very low prices, pushing the coverage even higher. So is DB immune to this risk?
Let’s use the EBA transparency data which gives excellent disclosure on NPLs, coverage and collateral, to see where DB stands. The first metric is the simple coverage on NPL + Past Due loans. Here’s the histogram for the sector (DB is in the red bucket.) Not great.

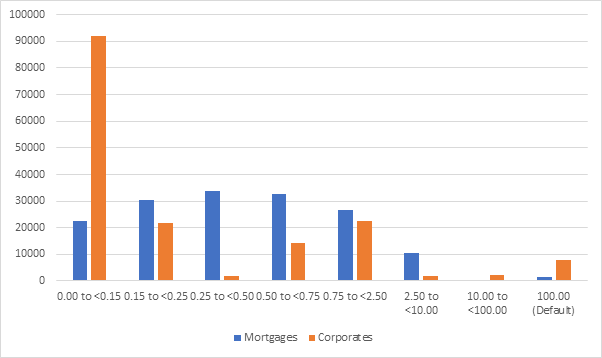
But tbh, Deutsche’s book is more secured than the average book, so let’s see if we can adjust for that. I’m using my standard NPE methodology which adjusts collateral values. Here’s where DB stands on corporates:

And on mortgages:

The periphery is obviously distorting those histograms a bit, and DB looks better compared to German peers, but other core countries have better coverages.
Still: I see a significant risk that coverages could be deemed inadequate by the SSM (or investors) if the NPL ratio spikes because of the crisis.
One caveat though: even if I’m not thrilled by DB’s coverage, the SSM seems clearly more relaxed as the results of the 2018 stress test show: coverage barely went up for German banks (some even decreased!) (that’s a bit nuts if you ask me)

Ultimately, the bottom line is that I model this with two multiplying factors for secured and unsecured exposures (using the Pillar 3 disclosure on collateral in each loan book.) This reflects both the impact of macro stress and sector benchmarking.
This has a significant impact, so it’s a parameter for which we will need sensitivities (as for the default intensity!)
Pfew that was tedious, but we are now ready to take into account government support measures! And honestly, this is a nightmare 😊. There are so many different government plans, it’s almost impossible to keep track of them.
I will dismiss the measures that have only macro impacts, because they are normally “baked” into macro consensus and will impact the default intensity. Instead I will focus on government guarantees on corporate loans.
I consider there are no direct support schemes on household loans - this is a conservative assumption which should be relaxed. For corporates I will simply assume that 50% of the defaults are covered by guarantees.v
This is a *very very* crude assumption, and I will run sensitivities on it, but I don’t know what else to do. There is another important caveat: EC state aid guidelines require that no aid (even “Covid aid”) should be given to companies already “in difficulty”
I will take this into account by considering that above a certain PD threshold (10%) loan guarantees are not allowed. Pillar 3 disclosures and smoothing techniques allow us to estimate this.
And TATAAAAAAAM we get to this chart, which gives us a loss rate per book. For a useful benchmarking, I compare to the EBA stress test numbers for the worst year (which was the first year).

Honestly, I am a bit surprised by how consistent it is with the stress test 😊 There are two big differences, though.
The first one is the corporate ex SME book, but this is largely driven by coverage which I have already discussed.
The second one is the non-SME (=individuals) other retail book, which means consumer loans, etc. This is a largely (90%) unsecured book, with average PD of 2.6% and low NPL coverage at 56% and current expected loss at 5%!
How the hell did the stress test only have a 2.1% loss rate there !? I have no clue and I stick to my number (if you have ideas to explain the difference, I’m interested.)
One last thing: IFRS 9! I have made a detailed thread on this elsewhere, so you can get back to it for further details, but how do I handle this from a modelling point of view?
The “intensity of default” approach makes it actually relatively easy. It will give you a new rating split for your book after one year. From that, it is easy to get new stage 3 loans (and losses), that’s the defaulted bucket.
It’s also easy to get Stage 1 loans and their expected losses – that’s the unchanged rating bucket. And Stage 2 is simply the loans that got downgraded one notch in the rating scale the bank uses. (Well, it’s my assumption, the actual method differ slightly by bank)
Getting the ECL for stage 2 loans is tricky, but it’s an opportunity to explain how CRUCIAL the ECB (and BOE) doc on IFRS9 and on the modelling of the recovery is.
You have got your new rating split and new transition matrix after one year, because of the shitty macro. For Stage 1 and 3 loans, getting the ECL is easy, but what about Stage 2? You need the losses over, say, 9 years for a mortgage. How do you get that?
Simple: you take the transition matrix and put it at the power of 9 ! But wait, which transition matrix? The original one? Or the new one? Or a mix of both? Well, that’s precisely what the “recovery” or “return the macro baseline scenario” means!
If you use the TTC matrix, you’re assuming you’re getting back to trendline quickly. If you use the new one, you assume we remain in Armageddon mode for 9 years. This intensity of default concept is the key to understanding how macro scenarios feed into losses.
In practice, I won’t tell you how I do it exactly, but you get the drill and this allows me to get Stage 2 IFRS9 ECL for books for which it matters – i.e. books with long dated loans!
I also have the EBA ST data to help here (or to make a safety check). Indeed, the disclosure (if you dig a bit) gives you the IFRS 9 impact for banks that used the transitional approach.
Now Deutsche doesn’t use that, so we don’t have their data, but for the banks that do we have a very good proxy which is LLP on non-defaulted loans, as shown below:

& this is consistent with an impact in the 20/40bps range for Deutsche, something that won’t move the needle because of a) the 70% transitioning factor that they could (should?) use and b) the possibility that this will be removed from CET1 entirely (see today's EC announcement)
The final result is a whopping 6.9bn€ of total LLP feeding into CET1 – with no tax benefits, since DB does not have any room left to book DTA in CET1 (it’s a complicated calculation based on a set of threshold rules.)
A final word on RWA inflation: this will be driven by rating transition and CCF use. I can model this using all the parameters we’ve already calculated (PD, CCF, coverage) and get an estimated RWA inflation number.
I can also use the EBA ST 2018 inflation number. I find this more reliable, simply because of the high non linearity of the RWA formulas which means that using average values for the parameters of the RW% formula will yield results that are very different from average RW%

For DB that’s a 13.7% RWA inflation.
And we get the new CET1 ratio for DB at 10.4… Believe it or not, this is exactly their MDA threshold (i.e. the threshold after which distribution constraints start to appear.) This threshold could be even lower soon if the EC changes the rules on intangibles, as seems scheduled.
What’s the bottom line here?
1) Linear algebra is great.
2) 10.4% is still a lot of capital. Before the GFC banks had CET1 of 4% or even less, and everybody was happy!
1) Linear algebra is great.
2) 10.4% is still a lot of capital. Before the GFC banks had CET1 of 4% or even less, and everybody was happy!
Also,
3) this is somehow a stress test, I have been conservative and my assumptions are probably a bit harsh. The real world should remain above that – possibly well above that. DB says it’ll stay above 12.5%.
3) this is somehow a stress test, I have been conservative and my assumptions are probably a bit harsh. The real world should remain above that – possibly well above that. DB says it’ll stay above 12.5%.
But if we get to my stress scenario, the consequences will probably just be dilution risk, as they would need to raise equity – AGAIN! My numbers don’t show Deutsche going bust because of this, far from it!!
THAT’S ALL FOLKS. FINAL IMPORTANT DISCLAIMER: THIS IS NOT INVESTMENT ADVICE; I COULD BE BADLY WRONG AND THE MARKET COULD BE PRICING ALL SORTS OF DIFFERENT SCENARIOS. I HAVE NO CLUE IF YOU SHOULD BUY OR SELL DEUTSCHE.


