
I know all the discussion is about a possible "2nd wave", but I've found this odd given that we haven't finished the first one. I would think quite possible that, nationally, we're in for a scenario of a long plateau. 1/10
If we look at confirmed cases through time in the US, we see a plateau of ~30k confirmed cases per day for basically the entire month of April. This corresponds to a decrease of the effective reproduction number to ~1. Figure from @cmmid_lshtm's epiforecasts.io/covid/. 2/10 
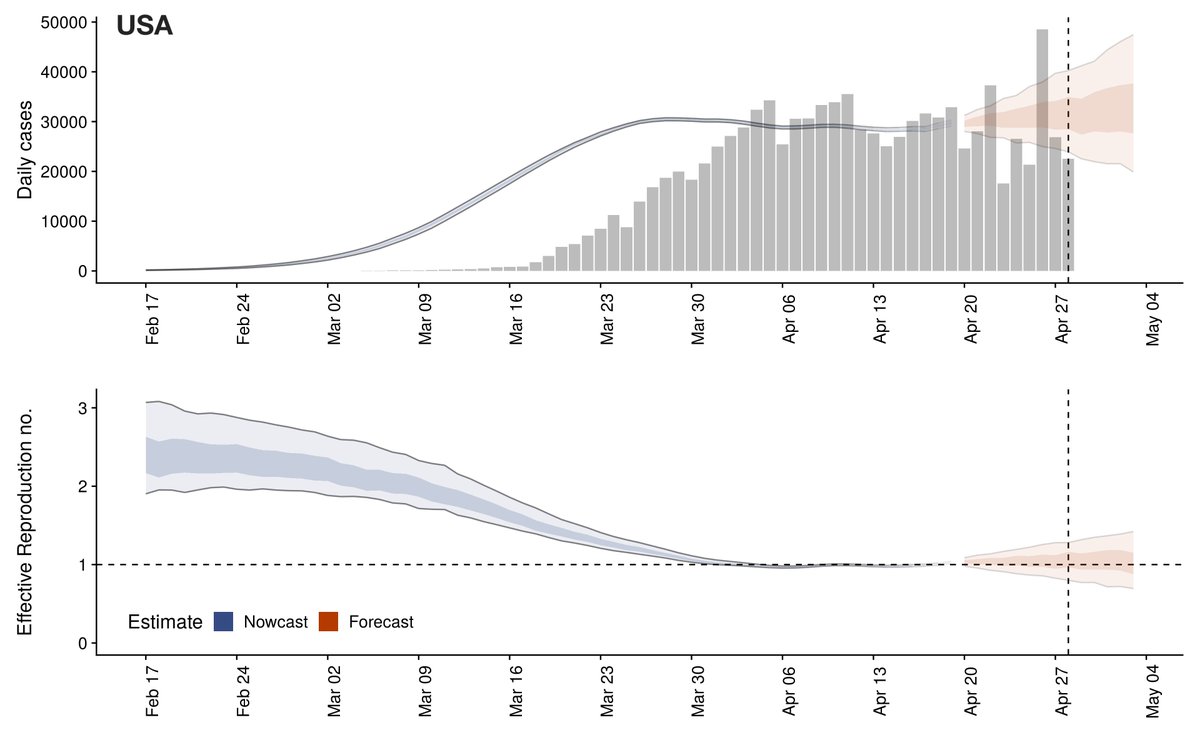
As stated before, it's clear that social distancing has had a large impact on transmission (). However, this effect has been shy of suppression nationally and hence the plateau in cases rather than a consistent decrease. 3/10
This plateau at a national level is the result of some states with rising case counts (and Rt greater than 1) and other states with falling case counts (and Rt less than 1). 4/10

As we move forward into summer, transmission rate will be affected by:
1. efforts to get society and the economy moving again
2. better knowledge and hygiene practices
3. possible impact of seasonality
5/10
1. efforts to get society and the economy moving again
2. better knowledge and hygiene practices
3. possible impact of seasonality
5/10
In terms of seasonality, there is increasing evidence of the importance to transmission of indoor spaces where people spend lots of time (wwwnc.cdc.gov/eid/article/26…, wwwnc.cdc.gov/eid/article/26…). Summer should improve this. 6/10
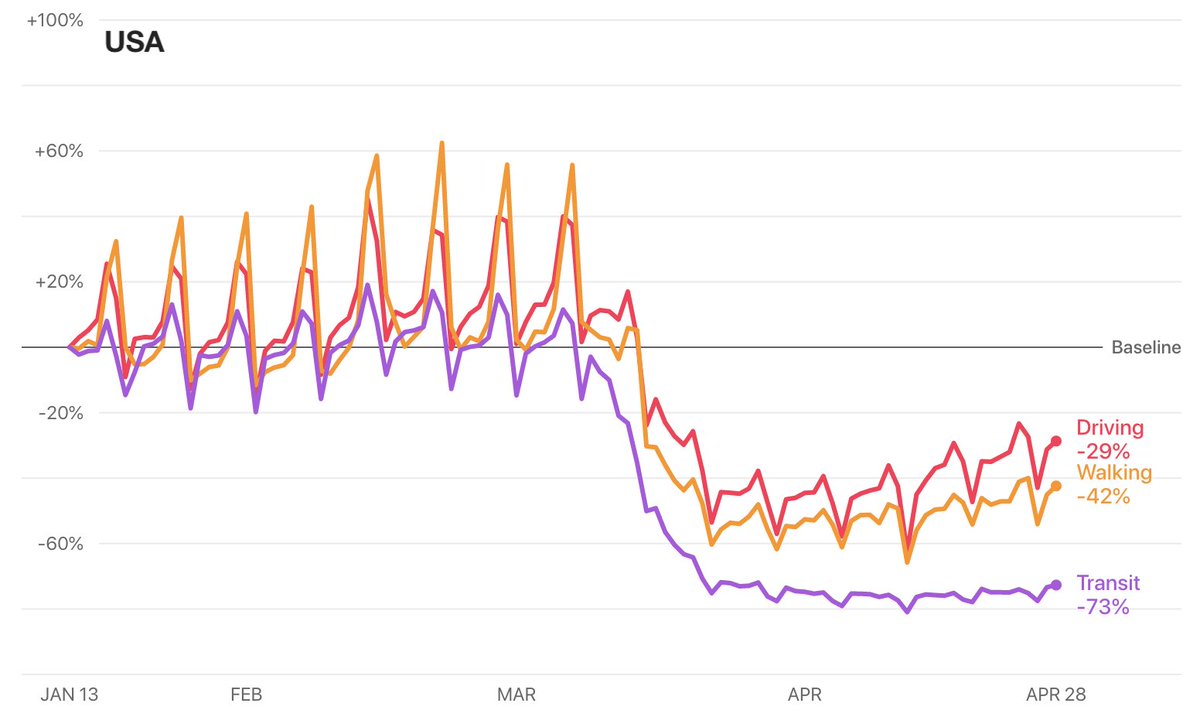
However, given that Rt nationally is at the moment ~1, I don't see why we expect large declines in daily case counts over the next month, given that behavior has been pretty static, or perhaps rising. Figure from apple.com/covid19/mobili…. 7/10
I would suspect that the dynamic we're looking at is local policy decisions / people's changing behavior as risk is perceived to decrease resulting in increasing local case counts and then a cycle of increased social distancing to compensate. 8/10
There may well be cities / counties that achieve suppression locally, but nationally I expect things be messy with flare-ups in various geographies followed by responses to these flare-ups. 9/10
If we continue at our current pace of perhaps ~300k infections per day (). The US would have very roughly 50M cumulative infections by September 1 and be at ~15% population immunity. 10/10
I'd be happy to wrong here and start to see a week-over-week decline. I just don't know what gets us there if we're not there already.
An important subtlety I missed in the original thread: Tests per day almost doubled from ~120k to ~200k over the course of April while confirmed cases remained roughly flat at ~30k per day. Does suggest some decrease in number of infections, though probably less than than 1.6X.

