Latest ICNARC report is out. Here’s my summary and a link to the full report.
I originally used this report to try to dispel the myth that those dying of COVID-19 were already “at death’s door”. I’m pleased to see all the other supporting evidence that‘s emerged since then. /1
I originally used this report to try to dispel the myth that those dying of COVID-19 were already “at death’s door”. I’m pleased to see all the other supporting evidence that‘s emerged since then. /1
The report runs to 4pm on 30 April. It covers 7,542 patients, with outcome data on 5,139 of them. There are 2,497 and 2,642 patients discharged from critical care.
I’m summarising the report on behalf of @ICS_updates and @COVID19actuary. /2
I’m summarising the report on behalf of @ICS_updates and @COVID19actuary. /2
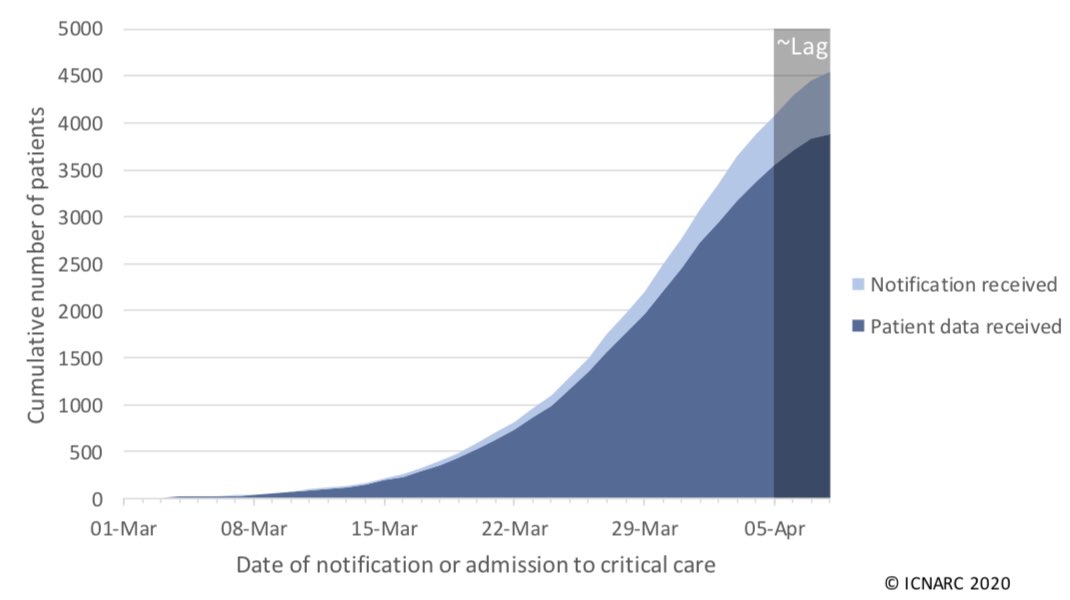
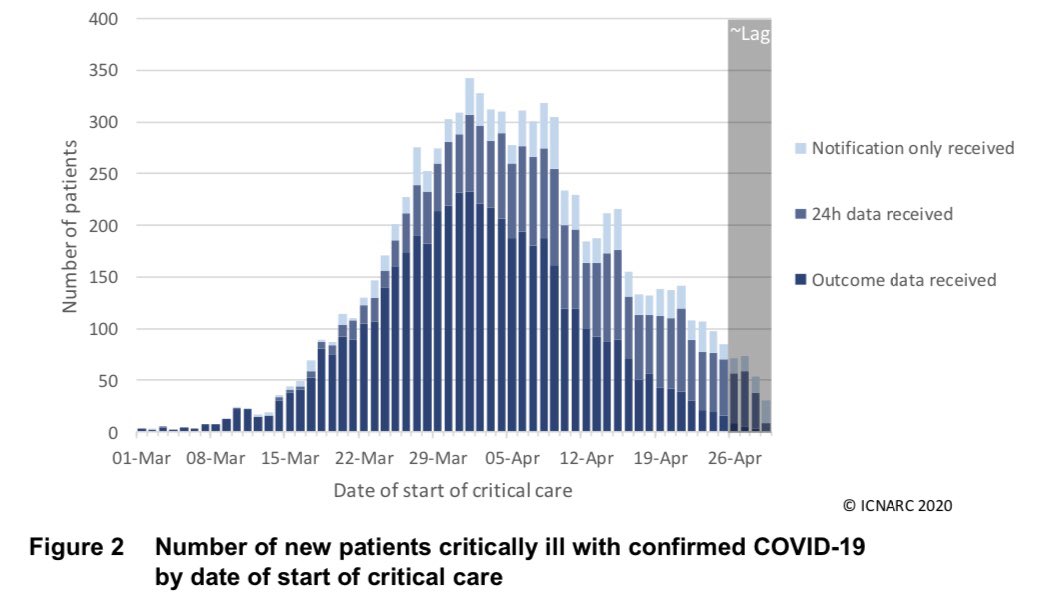
My favourite chart is back. It is abundantly clear that we are well past the first peak of ICU admissions.
Social distancing has made a huge difference. @COVID19actuary will estimate how many lives have been saved in an upcoming report. /3
Social distancing has made a huge difference. @COVID19actuary will estimate how many lives have been saved in an upcoming report. /3
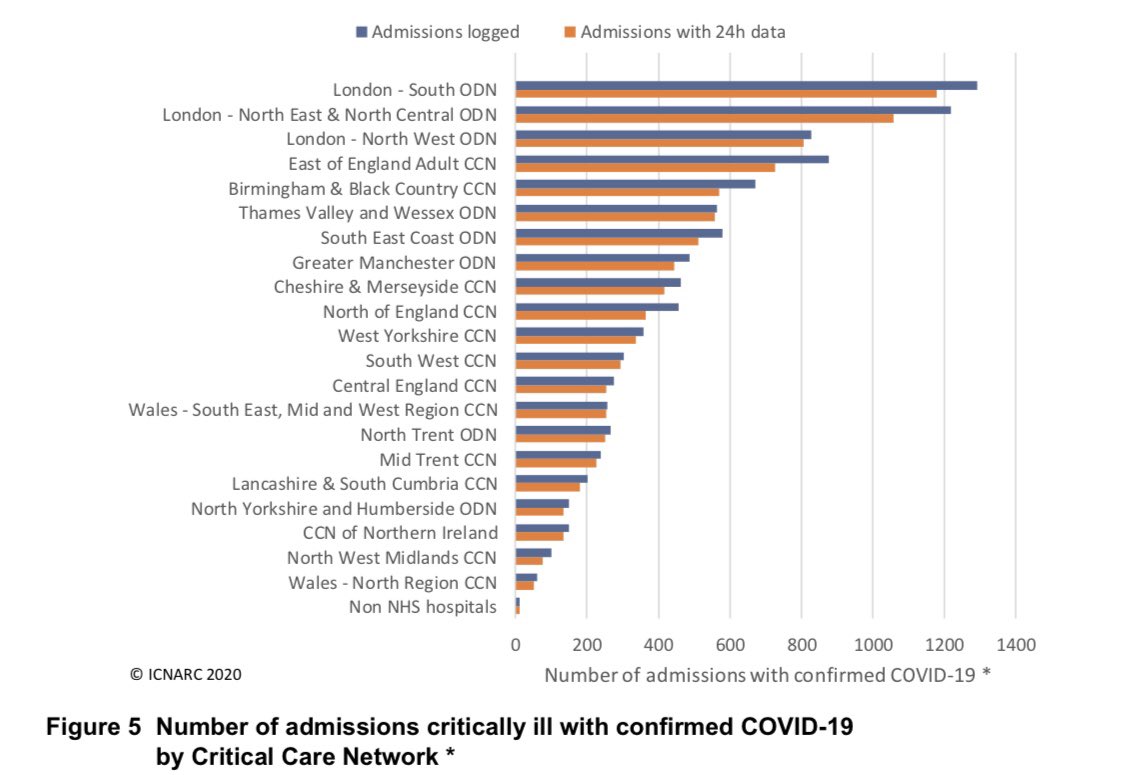
Little change to the geographic concentration of patients. Top 3 still London, though it looks like East of England may push NW London down to 4th next week. B’ham still 5th.
Thames Valley and Wesssex now have more admissions than SE coast.
Manc, Cheshire, Merseyside next. /4
Thames Valley and Wesssex now have more admissions than SE coast.
Manc, Cheshire, Merseyside next. /4
The new demographic info in Table 1 quite rightly caught our attention last week.
The socioeconomic gradient in admissions is even clearer this week. More deprived groups are more exposed to this disease and more vulnerable if they catch it. They are more likely to need ICU. /5
The socioeconomic gradient in admissions is even clearer this week. More deprived groups are more exposed to this disease and more vulnerable if they catch it. They are more likely to need ICU. /5
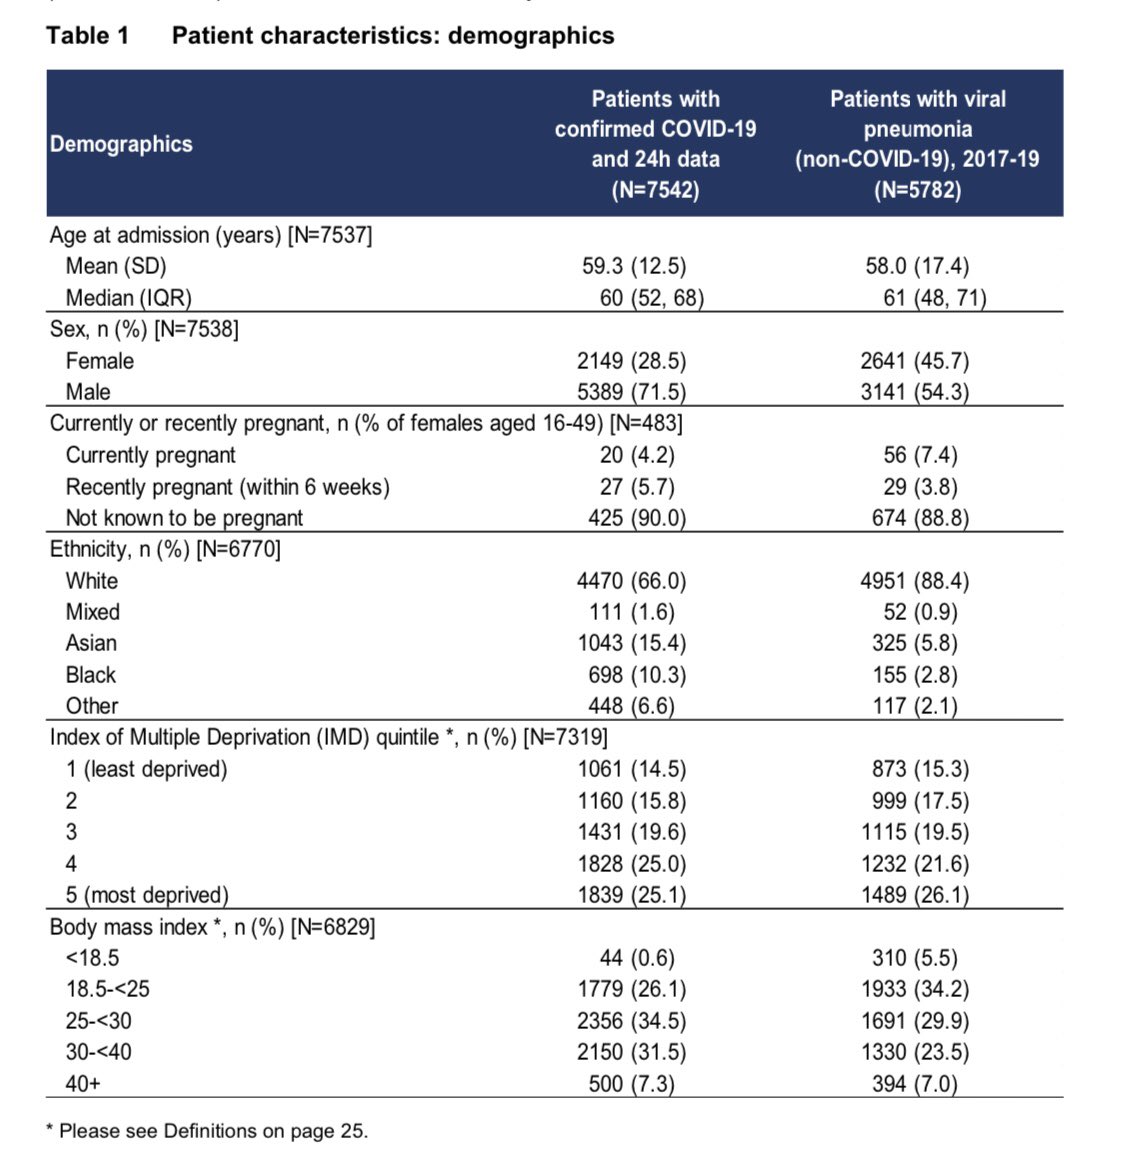
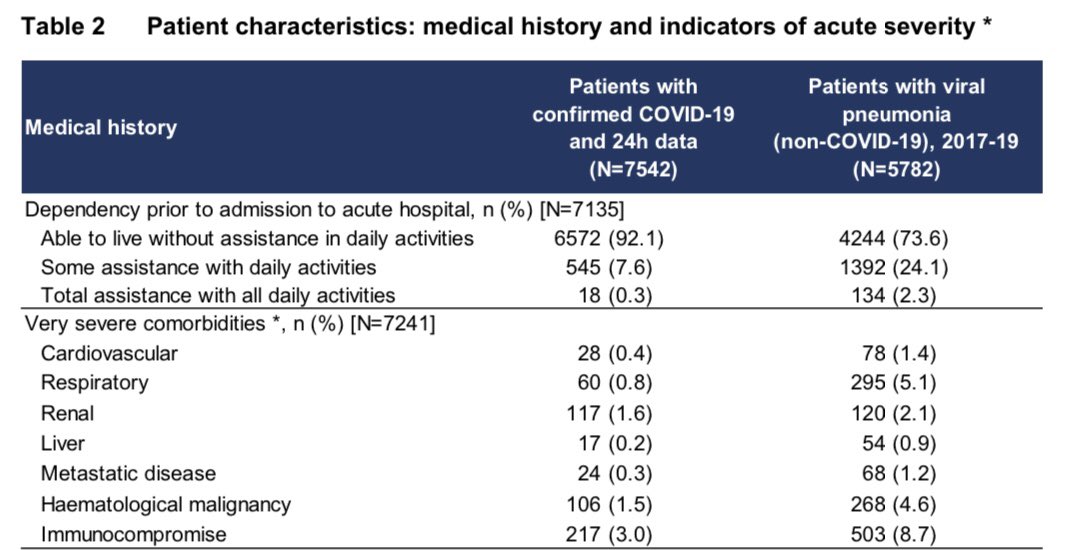
It’s where this all started so I can’t skip over table 2. Little change to the numbers. 92% of ICU patients were able to live without assistance in daily activities. Only 8% of patients admitted to ICU have very severe comorbidities. /6
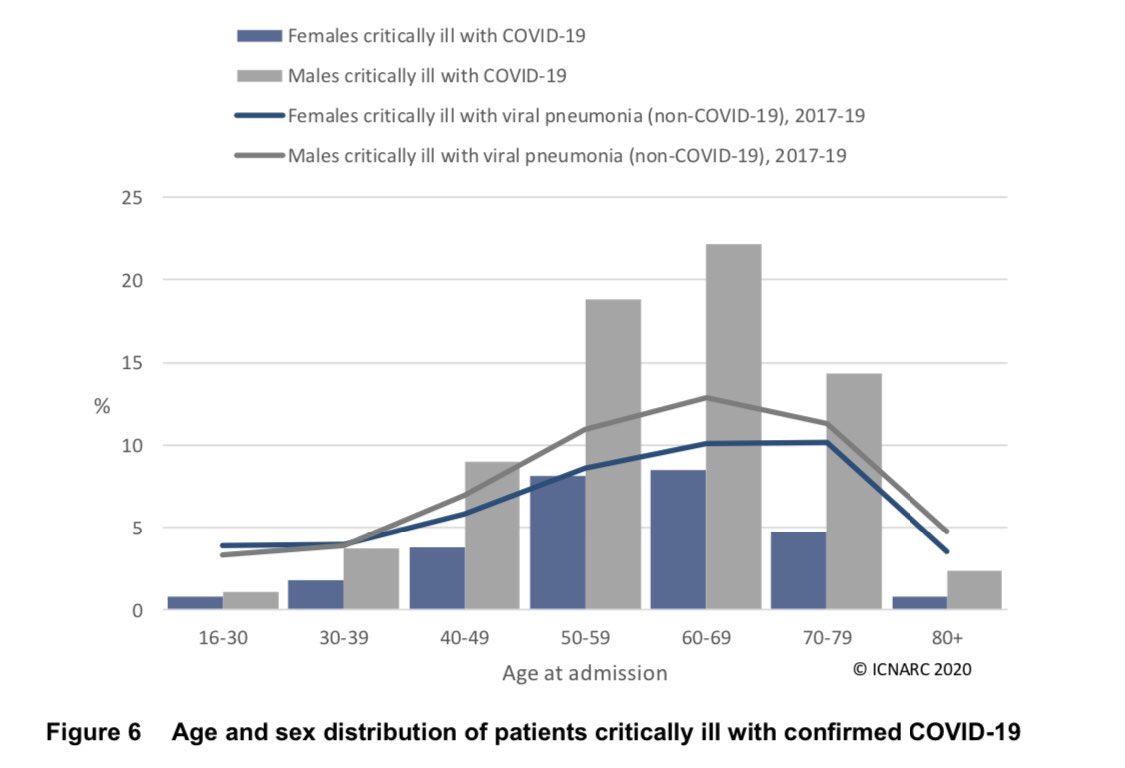
The age and sex distribution is very stable week-to-week. 7 out of 10 ICU patients are males. Males aged 50-80 seem disproportionately vulnerable to COVID-19 (compared to non-COVID viral pneumonia). /7
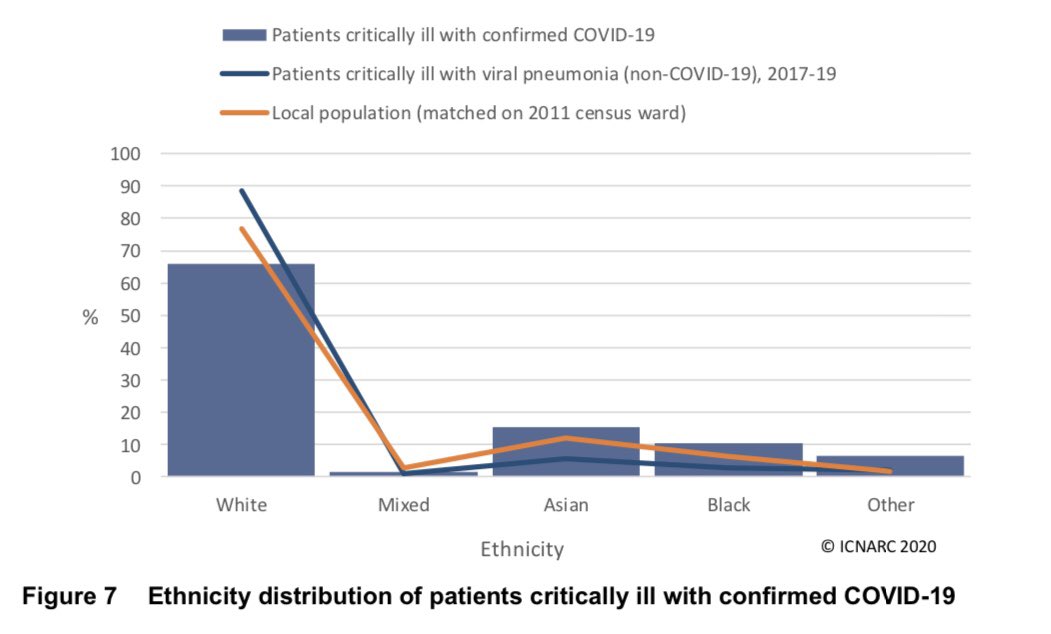
Ethnicity distribution of ICU admissions is similar to last week.
Compared to whites, ICU admissions are:
- 50% more likely for Asians
- twice as likely for blacks
- four times as likely for others. /8
Compared to whites, ICU admissions are:
- 50% more likely for Asians
- twice as likely for blacks
- four times as likely for others. /8
BMI picture same as last week. About as many admissions as we’d expect for healthy weight (or under).
Less admissions than expected for the ‘overweight but not obese’ group. More admissions than expected for obese people, especially for very obese. /9
Less admissions than expected for the ‘overweight but not obese’ group. More admissions than expected for obese people, especially for very obese. /9
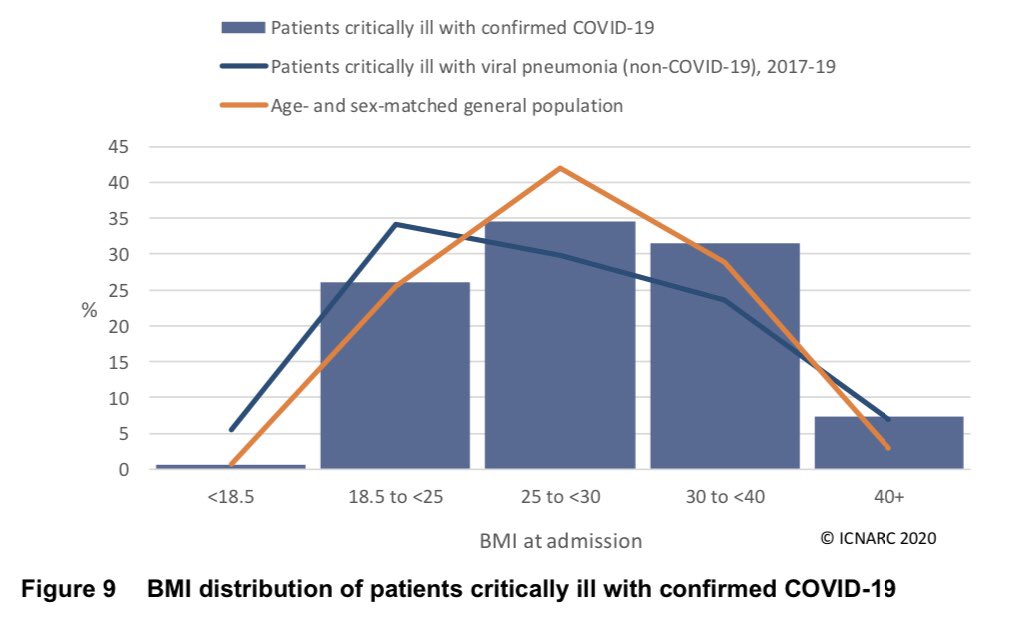
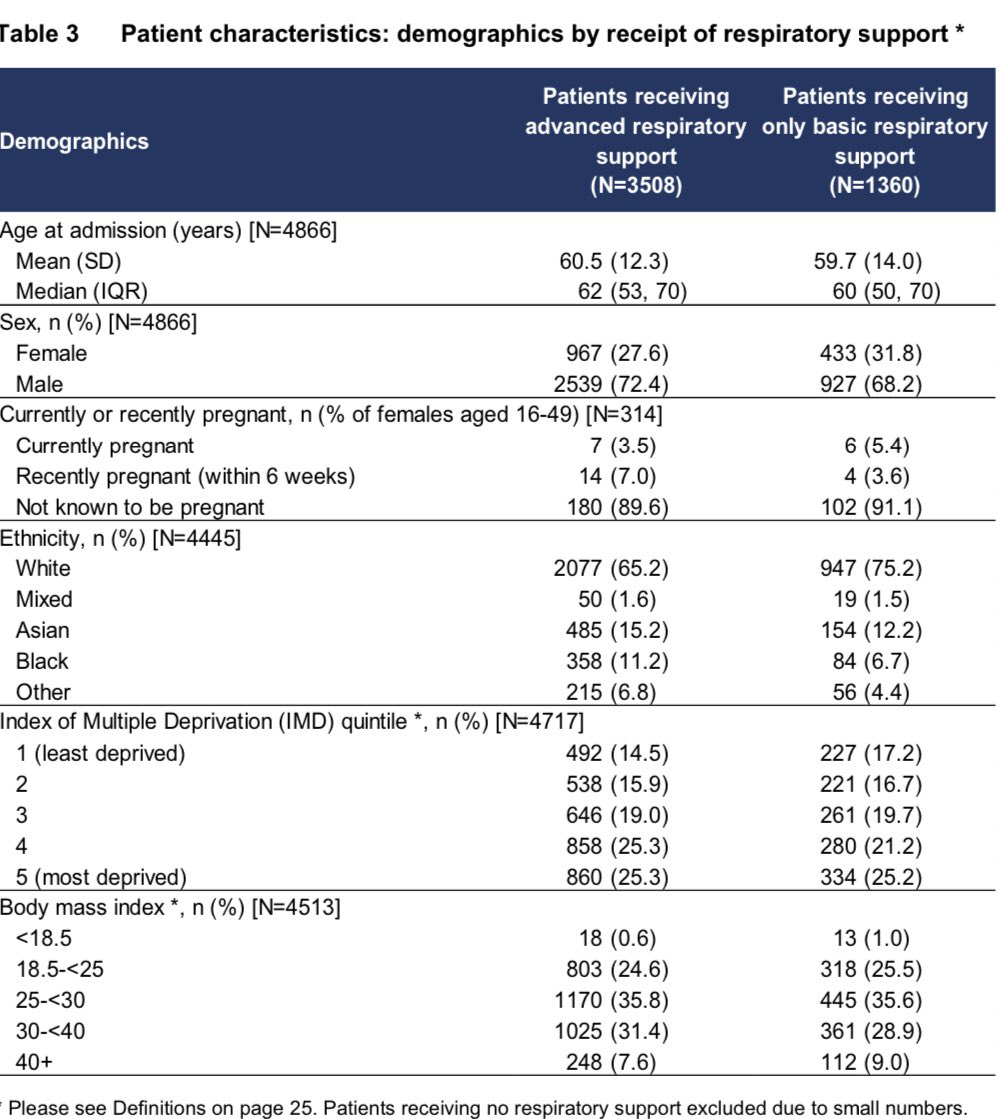
Table 3 shows that the differences by sex, ethnicity and socioeconomic group are even more severe as the groups overrepresented in ICU are also more likely to need advanced respiratory support. Not much difference for obesity though. /10
Some interesting points in the outcomes data. Overall survival has increased from 49% to 51%. A small change overall, but that implies a big change in week.
Sure enough, only 2 out of 5 outcomes this week were deaths! Are patients benefiting from the fall in demand on ICUs? /11
Sure enough, only 2 out of 5 outcomes this week were deaths! Are patients benefiting from the fall in demand on ICUs? /11
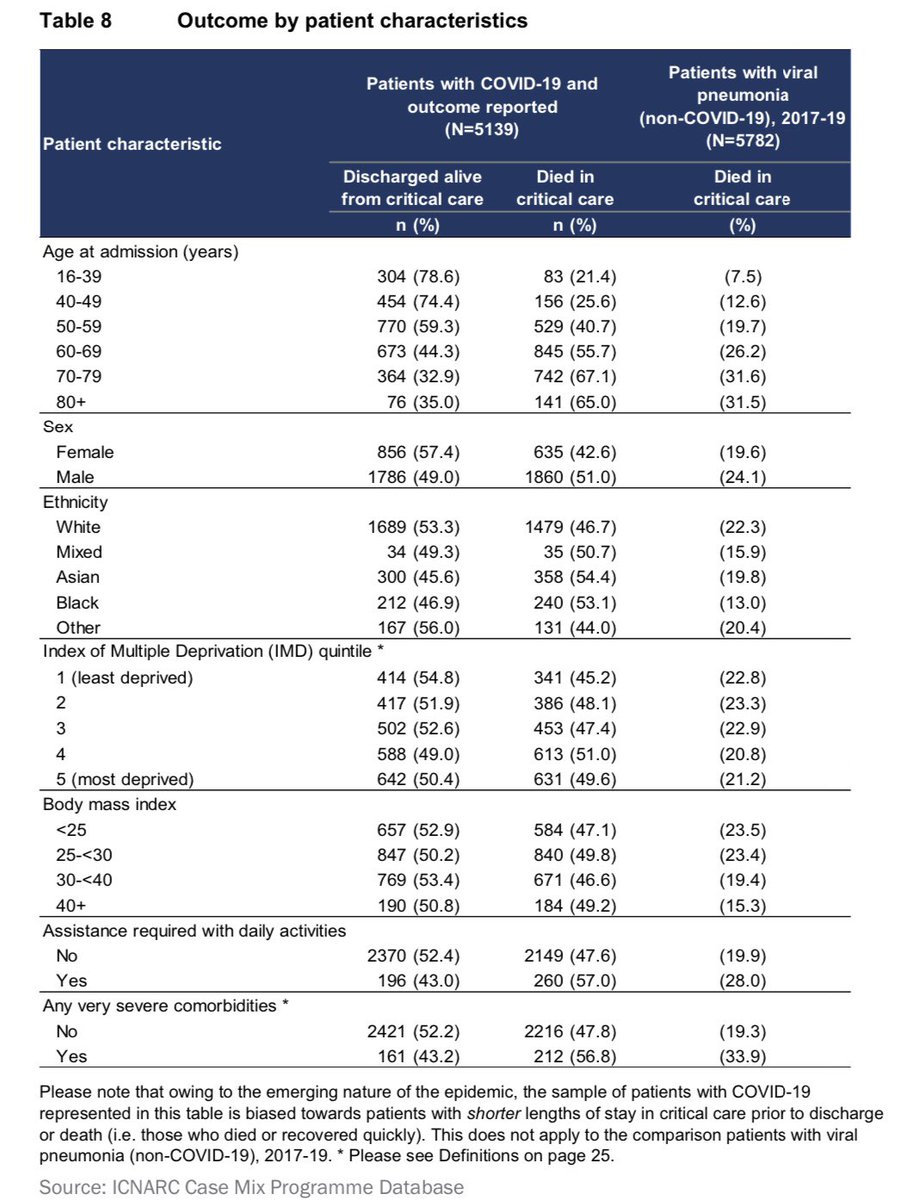
Surviving ICU with COVID-19 is still 50/50 though. 👆
Below age 50, 9-in-12 survive.
Above age 70, 4-in-12 survive.
There are differences in survival outcomes by sex, ethnicity and socioeconomic group (with men, non-whites and more deprived groups more likely to die). /12
Below age 50, 9-in-12 survive.
Above age 70, 4-in-12 survive.
There are differences in survival outcomes by sex, ethnicity and socioeconomic group (with men, non-whites and more deprived groups more likely to die). /12
The most exciting news for any statistician is on page 23 (easy to miss!) Outcome volumes are now high enough to do multivariate analysis, and this will appear from next week. 👏🏻
So what is multivariate analysis and why is it important? 👇 /13
So what is multivariate analysis and why is it important? 👇 /13
All the analysis above considers variable one at a time and draws conclusions from these. But many of these variables are correlated and that can lead to false conclusions.
Multivariate analysis allows us to understand which factors are really associated with worse outcomes. /14
Multivariate analysis allows us to understand which factors are really associated with worse outcomes. /14
As it happens, @COVID19actuary did an explainer on multivariate analysis just yesterday, as the first such studies are beginning to emerge. I won’t repeat the explanation, see link below instead (there’s a second link below it for people who don’t use LinkedIn). /15
Ok that’s me done (the kids are demanding attention!) More good news in the falling admissions and much improved in-week death rate.
Thanks to @aroradrn for suggesting these updates.
You can support the intensive care community here. /16
Thanks to @aroradrn for suggesting these updates.
You can support the intensive care community here. /16
Here’s a simple explainer on the difference between the one-way analysis in this thread/report and the multivariate analysis we will start to see next week.