
US Coronavirus Update for Friday, May 2, 2020
~ An intriguing Friday
Fatalities first ~
• Total US covid-19 deaths as of Fri, May 2: 64,283
• Increase in last 24 hours: 1,738 (+ 3%)
--> Deaths fall slightly 2nd day in a row
--> US still at 72 deaths/hr — more than 1/min
~ An intriguing Friday
Fatalities first ~
• Total US covid-19 deaths as of Fri, May 2: 64,283
• Increase in last 24 hours: 1,738 (+ 3%)
--> Deaths fall slightly 2nd day in a row
--> US still at 72 deaths/hr — more than 1/min
2/ The most interesting news about fatalities today comes from some basic journalistic digging done by Christopher Ingraham of the Washington Post (@_cingraham).
...>
...>
3/ Christopher Ingraham asked a basic question a lot of us looking at coronavirus data should have asked weeks ago:
How do deaths from influenza and deaths from covid-19 actually compare?
You probably think you know the answer: covid-19 is bad, but the flu is bad every year.
How do deaths from influenza and deaths from covid-19 actually compare?
You probably think you know the answer: covid-19 is bad, but the flu is bad every year.
4/ That's wrong.
What you think you know about flu-death numbers is wrong. It's become the conventional wisdom — flu deaths have become a political billyclub.
The conventional wisdom is wrong.
This is why we need good reporters, who get puzzled and get curious.
What you think you know about flu-death numbers is wrong. It's become the conventional wisdom — flu deaths have become a political billyclub.
The conventional wisdom is wrong.
This is why we need good reporters, who get puzzled and get curious.
5/ If you Google, 'How many people in the US die of the flu each year?' — you get taken to a chart at the website of the Centers for Disease Control (CDC).
Flu season spans winter (reported across the new year):
2018-19: 34,157
2017-18: 61,000
2016-17: 38,000
2015-16: 23,000
Flu season spans winter (reported across the new year):
2018-19: 34,157
2017-18: 61,000
2016-17: 38,000
2015-16: 23,000
6/ Below an image of that chart from the CDC page — years far left, deaths far right.
It's pretty grim.
How is it we routinely have flu seasons that kill as many people as covid-19 has killed (51,000 in 2014-15; 61,000 in 2017-18) — yet we're panicked & overwhelmed by covid-19?
It's pretty grim.
How is it we routinely have flu seasons that kill as many people as covid-19 has killed (51,000 in 2014-15; 61,000 in 2017-18) — yet we're panicked & overwhelmed by covid-19?

7/ Here's how: The deaths column on the chart for the flu carries the word 'estimate.'
See the image below.
Those tens of thousands of yearly flu deaths every story has reported with such confidence — they come from a CDC chart — are not real, confirmed, recorded deaths.
See the image below.
Those tens of thousands of yearly flu deaths every story has reported with such confidence — they come from a CDC chart — are not real, confirmed, recorded deaths.

8/ The flu deaths in this standard CDC chart are an extrapolation — they are based on actual flu deaths, plugged into a model which estimates how many deaths each year likely 'owe to' the flu.
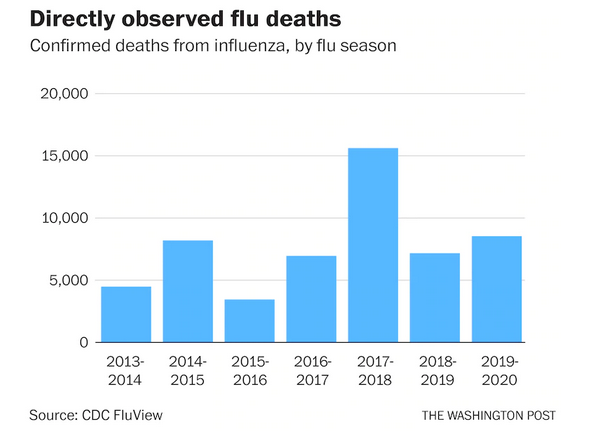
9/ What did Christopher Ingraham do? He dug into the CDC data to find each year's actual flu deaths.
Confirmed influenza deaths by season (estimated deaths in parenthesis):
2018-19: 7,172 (34,000)
2017-18: 15,620 (61,000)
2015-16: 3,448 (23,000)
Confirmed influenza deaths by season (estimated deaths in parenthesis):
2018-19: 7,172 (34,000)
2017-18: 15,620 (61,000)
2015-16: 3,448 (23,000)
10/ Below, a chart from the @washingtonpost story showing confirmed US flu deaths the last 7 seasons (including 2019-20).
If you add up all the figures, they come to about 56,000.
Seven seasons of confirmed flu deaths are less than 9 weeks of confirmed covid-19 deaths.
If you add up all the figures, they come to about 56,000.
Seven seasons of confirmed flu deaths are less than 9 weeks of confirmed covid-19 deaths.
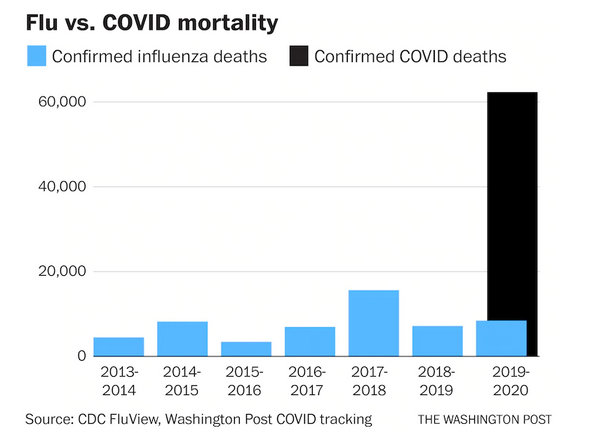
11/ Below is the chart from the @washingtonpost story showing current covid-19 deaths compared to the those same 7 years of confirmed flu deaths.
Story is here:
washingtonpost.com/business/2020/…
Story is here:
washingtonpost.com/business/2020/…
12/ Two important elements of this story.
As @_cingraham explains in the story, Ingraham didn't stumble on this himself.
The idea came from an emergency room physician with Harvard's Brigham & Women's hospital named Jeremy Faust (@jeremyfaust).
As @_cingraham explains in the story, Ingraham didn't stumble on this himself.
The idea came from an emergency room physician with Harvard's Brigham & Women's hospital named Jeremy Faust (@jeremyfaust).
13/ Faust could not understand why — if the flu death figures he kept hearing from the President on down were true — he wasn't overwhelmed with fatal flu cases every year.
'I had almost never seen anyone die of the flu. I could only remember one tragic pediatric case.'
'I had almost never seen anyone die of the flu. I could only remember one tragic pediatric case.'
14/ Dr. Faust started to do his own detective work, calling colleagues around the country. They too saw few flu deaths.
He figured out that the widely-cited CDC flu-death figures weren't the same, at all, as the covid-19 death figures.
He figured out that the widely-cited CDC flu-death figures weren't the same, at all, as the covid-19 death figures.

15/ And Dr. Faust wrote an essay about this for @sciam — which was published this week and caught the eye of Christopher Ingraham.
The non-stop battle over whether the coronavirus is 'not much worse' that the flu is over.
blogs.scientificamerican.com/observations/c…
The non-stop battle over whether the coronavirus is 'not much worse' that the flu is over.
blogs.scientificamerican.com/observations/c…
16/ Mind you, there's some malfeasance here from the @CDCgov.
Not in how they handle or report their data. It's all there.
Not in how they handle or report their data. It's all there.
17/ But surely there are people at the CDC the last 8 weeks who knew everyone in the country had been trying to puzzle this out—and we were conflating figures that weren't comparable.
Flu death numbers are estimates & ranges, based on algorithms.
Covid-19 deaths are counted.
Flu death numbers are estimates & ranges, based on algorithms.
Covid-19 deaths are counted.
18/ So thanks to @jeremyfaust for his curiosity.
And thanks to @_cingraham for his journalism.
This should change that conversation permanently.
And thanks to @_cingraham for his journalism.
This should change that conversation permanently.
19/ One more important point: In the last month there has been a move by some cities, counties and states to 'reclassify' some deaths in the last 4 to 8 weeks as covid-19 deaths, although the people who died did not have a test confirmed the disease.
That's been controversial.
That's been controversial.
20/ There's also been a policy outlined in many places — including from Dr. Deborah Birx, at the White House — that anyone who dies, who is coronavirus-positive, should be classified as a covid-19 death, whether they had other illnesses or not.
That's been controversial.
That's been controversial.
21/ The protest: We need to keep these covid-19 death figures 'pure.' Let's stick to the facts — people who really did die of the disease, for sure.
That, of course, is not in anyway how we account for flu deaths. We just didn't realize it.
That, of course, is not in anyway how we account for flu deaths. We just didn't realize it.
22/ The CDC has pages of explanation of how their scientists and physicians calculate flu deaths, by the way.
That's a final significant point: The question of who died of what, and on what basis to make that judgment, doesn't seem like a question for amateurs.
That's a final significant point: The question of who died of what, and on what basis to make that judgment, doesn't seem like a question for amateurs.
23/ Few of us have ever seen anyone who was dead, let alone assessed cause of death for official purposes, or pored through data to see if we can tease out what's going on with mortality in our city, county, or country.
Professionals do this all the time.
Professionals do this all the time.
24/ So even as we can be disappointed in the way the professionals handled the data in this case—why didn't anyone point out, at the White House, on CNN, in an oped, that we were mixing very different figures?—we can leave judgments about deaths to the epidemiologists & doctors.
25/ The deadliness of coronavirus is many many times that of the flu.
And the people who treat both every year knew this.
Now a couple people have shown us the very real data that establishes it.
washingtonpost.com/business/2020/…
And the people who treat both every year knew this.
Now a couple people have shown us the very real data that establishes it.
washingtonpost.com/business/2020/…
26/ Now new cases.
There's some news here, too.
• Total confirmed US cases, Fri, May 1: 1,097,841
• Increase in cases in last 24 hours: 33,508 (+3%)
--> New reported cases rise, 4th day in a row
--> 3rd highest day of reported new cases in US in the pandemic
There's some news here, too.
• Total confirmed US cases, Fri, May 1: 1,097,841
• Increase in cases in last 24 hours: 33,508 (+3%)
--> New reported cases rise, 4th day in a row
--> 3rd highest day of reported new cases in US in the pandemic
27/ New cases are up steadily. Yesterday highest day in 6 days.
You know what else is up steadily? Daily tests performed.
At some point, the increase in tests will make it look like there are more cases — but we'll be finding cases we weren't finding (or confirming) previously.
You know what else is up steadily? Daily tests performed.
At some point, the increase in tests will make it look like there are more cases — but we'll be finding cases we weren't finding (or confirming) previously.
28/ The day may have arrived Friday, May 1.
This data is hard to tease out and hard to interpret.
Why? We don't have enough tests. We don't have a great random sampling of people across the country, to tell us how widespread the coronavirus infections are.
We're flying blind.
This data is hard to tease out and hard to interpret.
Why? We don't have enough tests. We don't have a great random sampling of people across the country, to tell us how widespread the coronavirus infections are.
We're flying blind.
29/ But here's what Friday shows us.
For 2 days below:
>Tests performed
>New cases reported
>Percent positive tests of total performed
Friday, May 1
> 305,118
> 33,508
> 11.0%
Friday, Apr 17
> 157,920
> 28,951
> 18.3%
For 2 days below:
>Tests performed
>New cases reported
>Percent positive tests of total performed
Friday, May 1
> 305,118
> 33,508
> 11.0%
Friday, Apr 17
> 157,920
> 28,951
> 18.3%
30/ This Friday, the US did roughly double the number of tests as 2 Fridays ago. But we found roughly the same number of cases.
Clearly, whatever our recent previous 'base level' of new cases was, some of Friday's spike comes from expanding testing to a new kind of person.
Clearly, whatever our recent previous 'base level' of new cases was, some of Friday's spike comes from expanding testing to a new kind of person.
31/ My statistician colleagues tell me that we don't have the data to know what the comparable figure for yesterday's 'new cases' would be if we could somehow adjust for the doubling of testing in the last two weeks.
That simple comparison shows us the positive rate is falling.
That simple comparison shows us the positive rate is falling.
32/ The positive rate isn't falling while we're testing exactly the same number of people, and exactly the same slice of people.
That would tell us that the coronavirus really was in retreat. (It would also mean total new cases was falling, of course.)
That would tell us that the coronavirus really was in retreat. (It would also mean total new cases was falling, of course.)
33/ The rate of positive tests is falling while we're doing 2 things:
--> Expanding testing capacity every day by tens of thousands
--> Starting to test people with much less serious symptoms, or no symptoms at all
We're changing a lot of variables in the testing mix at once.
--> Expanding testing capacity every day by tens of thousands
--> Starting to test people with much less serious symptoms, or no symptoms at all
We're changing a lot of variables in the testing mix at once.
34/ Now, just for the record, test data.
• New tests performed Fri, May 1, 2020: 305,118
• Days over 200,000 tests a day:
> 4 out of 4
> 7 out of 8
• Only the 2nd day in the pandemic with total tests reported at over 300,000 in a single day (the other: Wed, Apr 22)
• New tests performed Fri, May 1, 2020: 305,118
• Days over 200,000 tests a day:
> 4 out of 4
> 7 out of 8
• Only the 2nd day in the pandemic with total tests reported at over 300,000 in a single day (the other: Wed, Apr 22)
35/ A reminder: That previous day of 300,000+ tests, on April 22, had a reporting quirk: California reported 165,000 tests in a single day, increasing its total reported tests from 300,000 to 465,000 in one day.
That was a reporting backlog.
That was a reporting backlog.
36/ The 305,000 tests reported in the US Friday, May 1, are completely different.
It's an organic increase, showing increased testing ability and testing determination across the states.
Friday, 18 US states + DC hit an absolute record for tests performed, or a 'local' high.
It's an organic increase, showing increased testing ability and testing determination across the states.
Friday, 18 US states + DC hit an absolute record for tests performed, or a 'local' high.
37/ Some of the states that have increased their daily testing include exactly the states you'd want to:
FL
GA
IA
SC
TX
All those states are either open for business, with some rules, or are about to.
All those, plus 13 more, appear to be building more & more testing ability.
FL
GA
IA
SC
TX
All those states are either open for business, with some rules, or are about to.
All those, plus 13 more, appear to be building more & more testing ability.
38/ Long thread today. Sorry about that.
The work of Christopher Ingraham and Jeremy Faust MD seems very significant.
We'll look at which states are still seeing case increase tomorrow. And review Georgia's progress as the pioneer in reopening.
The work of Christopher Ingraham and Jeremy Faust MD seems very significant.
We'll look at which states are still seeing case increase tomorrow. And review Georgia's progress as the pioneer in reopening.
39/ One final point about the fatalities & how clear it is that covid-19 is much more devastating than the influenza — a point several people have made as I unfurled today's thread:
40/ The US is at 64,000 coronavirus deaths, while having locked down virtually the entire country for a month or more.
Confirmed influenza deaths (the comparable number) average about 8,000 a year. We do a lot to contain the flu — the vaccine is free across the country.
Confirmed influenza deaths (the comparable number) average about 8,000 a year. We do a lot to contain the flu — the vaccine is free across the country.
41/ But we do not shut down much of anything to battle the flu.
We're at 64,000 deaths — while taking the most extreme containment measure (or nearly) we could all envision.
Covid-19 deaths will be 10x the flu, or much worse.
Imagine what they'd be without this effort?
We're at 64,000 deaths — while taking the most extreme containment measure (or nearly) we could all envision.
Covid-19 deaths will be 10x the flu, or much worse.
Imagine what they'd be without this effort?
42/ The economic harm is devastating.
The economic harm can be managed. That's part of the job of the government in responding to the pandemic—adequate financial support. If you follow the thread, you know we've dealt with that at length.
Staying-at-home is about the disease.
The economic harm can be managed. That's part of the job of the government in responding to the pandemic—adequate financial support. If you follow the thread, you know we've dealt with that at length.
Staying-at-home is about the disease.
43/ A sober final note.
Christopher Ingraham points out today that if US fatalities fall at exactly the rapid pace at which they've risen — if US deaths traced an inverted V — we'll get to 128,000 US deaths.
And, for the moment, there is no down slope to cases or deaths.
#
Christopher Ingraham points out today that if US fatalities fall at exactly the rapid pace at which they've risen — if US deaths traced an inverted V — we'll get to 128,000 US deaths.
And, for the moment, there is no down slope to cases or deaths.
#

