My Authors
Read all threads
A bit of good news, after 19 submissions spanning six years, two months, two weeks, and four days, my job market paper on the collapse in US manufacturing has been accepted for publication in the European Economic Review. Here's a thread on the topic. 1/
The original title was "Relative Prices, Hysteresis, and the Decline of American Manufacturing", which later got shortened, with the most recent draft up on Ideas/Repec here: ideas.repec.org/p/cfr/cefirw/w… 2/
The tale of US manufacturing in the 2000s itself is an old bedtime story some economists tell when trying to scare their children. So, listen up. 3/
First of all, let me start with some background. I myself am from the industrial midwest. My father worked in the manufacturing sector in Indiana, in the automotive supply chain, and at some point in the 1990s was laid from a company suffering from trade competition. 4/
Fast forward to 2011, when I was working on the President's Council of Economic Advisors, and it was manufacturing month at the White House. Someone noticed manufacturing employment is very procyclical, and so as the US ec. recovered, manufacturing was sure to do well. 5/
The goal was thus to propose a window-dressing policy to help manufacturing, and then to take credit for manufacturing's rebound. Thus it was manufacturing month, and, lo and behold, I got tasked w/ making a slide deck for a Presidential cabinet meeting on manufacturing. 6/
Now, the consensus among economists at that time was that the decline in US manufacturing employment was actually a good thing, as it was just a long-run phenomenon due to out-sized productivity growth in manufacturing, and sectoral shift to services. 7/
Indeed, this is what I believed, at the time, before I started looking at the data. First, I noticed that the decline in the level of manufacturing employment was much more of a recent phenomenon. Some 3 million jobs lost from 1999 to 2003, despite the mild 2001 recession. 8/
The productivity data seemed at odds with such a steep, sudden decline in manufacturing employment. Productivity growth in manufacturing had been very steady -- nothing to suggest a sudden decline. 9/
You could read Op-Eds from leading economists at the time saying how the issue is that the US has become a services economy, and the US is simply producing and exporting more services. This may be true, but it doesn't show up in officially collected trade data. 10/
In addition, the shift to services consumption in this period was fairly gradual, maybe .5% of GDP from the mid 1990s to the mid 2000s. 11/
The official BEA data had US services export sectors also struggling in the early 2000s. In addition, various other non-manufacturing tradable sectors seemed to have a rough go of it in the early 2000s as well. 12/
If the productivity story were true, then it also implies that the US should have been running a trade surplus in the early 2000s. Nothing could have been further from the truth. By the early 2000s, the US was running a large structural trade deficit.13/
What's more, the growth in the manufacturing trade deficit in the early 2000s alone was more than enough to offset the decline in 3 million manufacturing workers. I quickly focused on the role of trade in the decline in US manufacturing. 14/
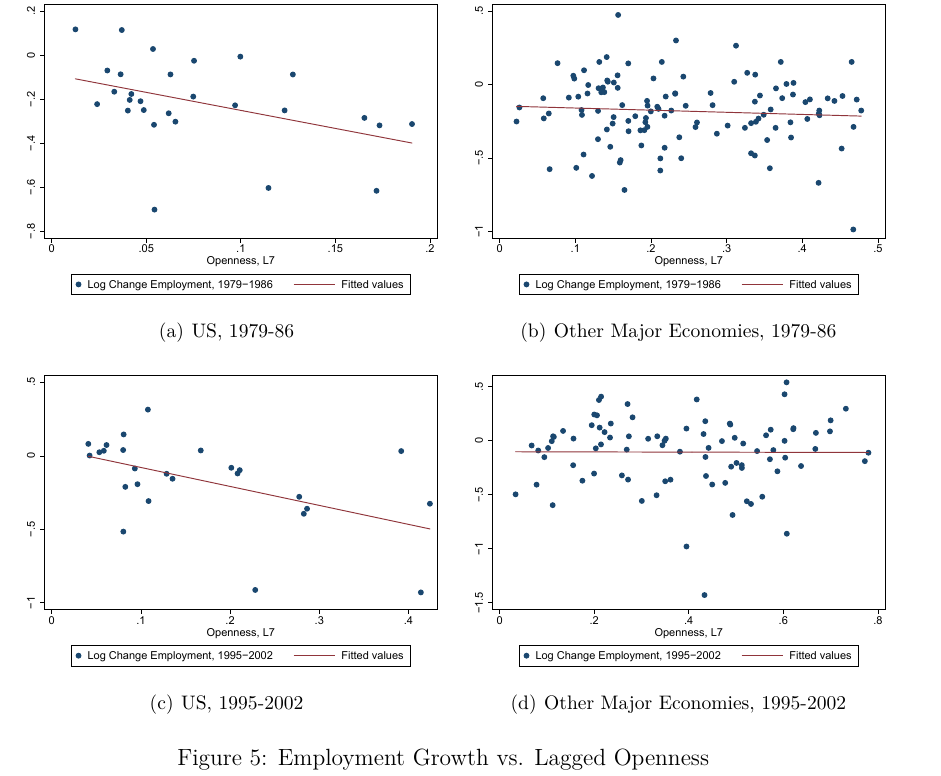
Looking cross-sectionally, there was a clear correlation between the sectors initially most exposed to trade, and those with the largest employment decline. 15/
At the same time, there was emerging a remarkable shift in the field of int'l trade. This had been a theory-dominated field. The Melitz model, a "beautiful" theoretical model seemingly created by God, reigned supreme. Yet, some felt its real-world insights were questionable. 16/
As the field was becoming more empirical (data everywhere, and advances in computing power), by 2011, it was still my view that advances in compelling research design, and particularly, in what economists call "identification", were lacking in trade compared to Applied Micro. 17/
Enter two sets of papers, both of which came out in the spring of 2011. We had Justin Pierce out to the White House to present his work with Peter Schott on the "Surprisingly Sudden Decline of US Manufacturing Employment. 18/ aeaweb.org/articles?id=10…
The paper highlighted China's accession to the WTO as a key moment -- they found that sectors that would have faced a larger tariff increase had MFN status with China been revoked, saw larger declines in employment after 2001. 19/
It was a clever strategy, and their research design looks compelling. But, @bradsetser, then at the NEC, and I had felt that perhaps they were not capturing all the damage done by trade: The US dollar had become quite overvalued by 2001. 20/
This leads us to another old bedtime story... After the Asian Financial Crises in 1997, Asian countries didn't want to ever have to go cap in hand to the IMF. They also didn't want to reign in their dollar borrowing, so, instead, they began accumulating vast quantities of... 21/
foreign reserves, mostly dollars. In particular, over the next decade, the People's Republic of China would go on to accumulate $3 trillion in foreign reserves. In addition, as a direct result of the crisis, many Asian nations devalued. 22/
Add in investors flocking to the dollar to invest in tech in the 90s, and two rounds of Bush tax cuts plus cheap oil prices, and conditions were ripe for an ascendant US dollar. 23/
But, I also remember sitting in Macro Seminars at UC Davis, where speakers had suggested that the US dollar and the trade balance were uncorrelated. After all, the dollar's appreciation from 1997 to 2001 was smaller than that of the dollar bubble from 1979 to 1985, and yet 24/
it gave rise to a much larger trade deficit. What gives? To answer this question, I had to go and write a different paper first, getting deep into the weeds of how real exchange rate indices are created, w/ "Through the Looking Glass" ideas.repec.org/p/abo/neswpt/w… 25/
The basic issue was what I termed "trading partner substitution bias". Do to globalization, and the rise of China, by the 2000s, the US traded much more w/ countries with very cheap price levels. This is not reflected in conventional RER indices 26/
This is completely analogous to the outlet substition bias problem in the CPI. When Wallmart roles into town, or even Amazon, and offers the same good at a lower price, this one-off price decline is not captured in the CPI, which is an index-of-indices. 27/
An alternative, then, is simply to do a (trade) Weighted Average of Relative Prices (WARP), where you just compare the average price level in the US relative to the prices in countries you trade with. 28/
Imagine you open to trade with a country with a very low price level (and low wages), this could very well affect your trade balance (but not RER index). Not surprisingly, I found that these WARP-type indices do a better job of predicting the trade balance in & out of sample. 29/
Thus, let's go back and look at the "puzzle" over the large trade deficit in the early 2000s. The Fed's Divisia index based on the CPI is in green. Using PWT data, however, the relative price level in the US was at an all-time high in the post-war period in 2001. 30/
And, this index happened to mirror the trade deficit so closely that I had at least one referee suggest it must be rigged;)! (I can assure you, you can download the PWT data and that I haven't rigged it...) 31/
The second piece of research that came out right then in the spring of 2011 was the infamous "China Syndrome" paper by Autor/Dorn/Hanson. It too, fingered China in the collapse of US manufacturing employment in the early 2000s. 32/ aeaweb.org/articles?id=10…
This was an innovative paper which brought cutting edge applied micro tactics to trade--much needed. Yet, it too did not discuss the rather large movements in the dollar over this period, and used local labor market data, which can lead to tricky issues w/ identification. 33/
It did seem, in the US case, that there had been a history of close movements between the US dollar, and manufacturing employment. In both the 1980s and the early 2000s, there seemed to be a tight relationship between "structural" manufacturing employment and the US dollar... 34/
Thus, the method I would go on to use was a classic repeated "difference-in-difference". I would compare sectors initially most exposed to trade vs. those less exposed before and after each of the two trade shocks. 35/
So, comparing the evolution of employment of the sectors initially most exposed vs. those least exposed, we see that the trend in employment in the 1970s was similar, but as the US dollar appreciated 50% from 1979 to 1985, there was about a 13% decline in relative employment 36/
in the more tradable sectors. Interestingly, as the dollar returned to normal, the jobs lost in these more open sectors did not return. Thus, I offer this as a canonical example of QWERTY-level "hysteresis". 37/
Now that it's published, I have nothing but love for the referee at REStud who suggested this was reverse-causality, i.e., that the exchange rate shock in 1985 caused these sectors to be more open in 1972. (if hadn't written this I wouldn't have the story to tell...) 38/
What's more, although it's a bit less clear-cut, I found that the same pattern generally held up in the early 2000s. As the dollar appreciated, jobs were lost in relatively more open sectors, while the trade balance increased & there were declines in structural agg. man. emp. 39/
I didn't stop there. Assessing causality from non-random is incredibly difficult. Much harder than most empirical economists are willing to acknowledge. It's pretty easy to fool yourself in this business. Thus, I used several other methods. 40/
W/ coauthor Lester Lusher, we provided an "Autopsy from the MORG", looking at the impact on workers in sectors more exposed from the same two trade shocks. 41/ ideas.repec.org/p/cfr/cefirw/w…
The effects were admittedly a bit weaker using the CPS Merged-Outgoing Rotation Group (MORG) data, but they were still there. As the US dollar appreciates, workers in more open sectors more likely to become unemployed, NILFed, & less likely to be employed. 42/
^In that paper, we got a bit more sophisticated with identification. We also used the RER as an IV for changes in the structural trade deficit, and then interacted that with openness across sectors. 43/
In the original paper, I also didn't stop at a difference-in-difference. I got data from other countries, and did a triple difference, comparing more open sectors in the US to the same sectors in other economies as the dollar appreciated. ideas.repec.org/p/cfr/cefirw/w…
If, for example, it was all just China, then you might expect to see the same affects in other counties at the same time -- but we don't. Another interesting case was Canada, which, due to oil prices, had very different RER movements from the US in the early 2000s. 45/
Canadian manufacturing employment had actually been increasing in the 1990s alongside weak oil prices, but then, as oil prices began to rise (with the rise of China), it too began to collapse, but several years after the US collapse. 46/
Armed w/ the hysteresis result, we now can make a bit more sense of the trade balance over time as well, plotted vs. the Fed's RER. Usually, there is a positive relationship between the RER & the US "import share of trade". 47/
But, after a large appreciation, the tradable sector declines, leading to a persistent shift to the northwest of the diagram. Indeed, this was a theoretical result implied by some of Krugman's 1980s models implying hysteresis, see "the competitive consequences of Ms. Thatcher".
OK, a trade shock hurt some sectors more exposed to trade, and some workers in those sectors. So what? Well, the damage doesn't end there. In 2001, the damage from the manufacturing decline was so bad, it led to the Fed's first flirtation with the zero lower bound. 49/
This was a decade that ended, mind you, with the US economy fully engulfed in a liquidity trap. When was the last time this had happened? I believe it's no coincidence that the last time had also happened to be the last time the US price level was at 2001 levels rel. to ROW. 50/
Also, looking at the issues with Europe in the 2000s, relative prices looked to be a major part of the story of European imbalances, as the "Cross of Euros" strangled southern european economies.
In any case, it's now my bedtime here in Moscow, and I've spammed everyone's twitter feeds too much already for one day, so I'll leave the implications for policy and development, and my own recommendations for the President until tomorrow!
Let me fill in a few more of the details. These graphs can help clarify the extent to which US trade went from "North-North" trade with countries with similar price levels to "North-South" trade, as the share of trade with China rose. 53/
Also, when I started, it was often assumed that while trade was blameless in the decline of manufacturing, it might have caused a rise in inequality. You've undoubtedly already seen the "elephant graph", which seemingly suggests a link between the rise of China & inequality. 54/
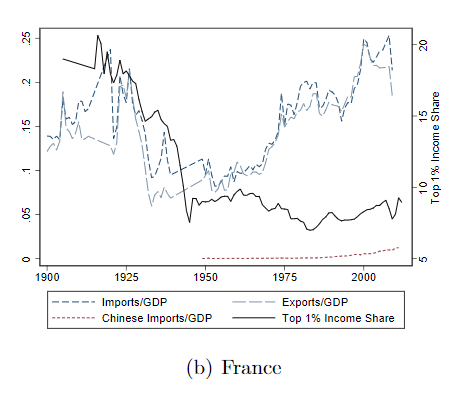
In addition, thinking about the fall and rise in the Top 1% share of income, the first wave of globalization was known to be unequal, and so was the second wave of globalization. Surely this can't be a coincidence? 55/
Perhaps somewhat surprisingly, in my paper w/ Lester, the data we saw was also at odds with this story... This is where I break with my good friend David Autor. 56/
For example, looking at the ratio between white and blue-collar wages within sectors, there was a tremendous rise in the Man. sector from the 1980s. But, this rise was broad-based across sectors, and not more pronounced during the trade shocks. 57/
According to this crude measure of inequality (en vogue w/ trade economists, but no one else), much of the rise in inequality happened between 1985 and 2000 -- a period w/ a robust labor market and before the China shock really became very large. 58/
In addition, we did not find that low-wage workers were disproportionately hurt. Instead, we found that higher wage workers in more-exposed sectors, particularly those with no college education, experienced the largest wage declines. 59/
Looking internationally in an early draft of our paper, we noted that other countries had large increases in globalization, and trade shocks, without much of a change in inequality. 60/ ideas.repec.org/p/abo/neswpt/w…
This is not to say that globalization, or trade shocks, don't impact inequality. (Imagine, if Justin Beiber were just singing songs at the local bar, would he be as rich?) but the impact likely depends crucially on institutional factors (minimum wage, labor unions, top tax rates)
Indeed, in a brilliant paper, Piketty, Saez, and Stantcheva found that current top marginal tax rates predict current top income shares. 62/ pubs.aeaweb.org/doi/pdfplus/10…
However, we also noticed that their panel regression seemed to be missing some fixed effects and country trend controls you might have expected to see. Including those trends did weaken their results, although they were restored w/ a more appropriate functional form choice. 63/
The interesting thing we found though, was that top marginal incomes seemed to be, not just a function of current top marginal tax rates, but also of the recent past history -- hysteresis again! 64/
Why might this be the case? Well, if I'm in the top 1%, and I get a Reagan-sized tax cut, i might save some of my additional income, and buy a rental property which becomes future income. Some of this happens mechanically. 65/
Also, the starting position for a wage negotiation is typically the current salary level. As top income taxes declined, this likely changed the bargaining position (why bargain hard for a wage increase if 80% is taxed?), and this would play out over a number of years. 66/
Lastly, I am a bit concerned that the Piketty/Saez top income share data using tax data is just what gets reported. When top income tax rates go up, it may take people time to learn how best to cheat on their taxes, or, when cut, time to realize they can report more income... 67/
In any case, back to the impact of the trade shock in the early 2000s. Despite the housing bubble, fed in part by the "Savings Glut" of money coming from Asia, the US job market, & RGDP growth, was surprisingly weak in the 2000s. 68/
My view was that the sudden collapse of 3 million manufacturing jobs was a big part of the reason. Various estimates of the jobs lost due to trade, from myself, to Autor/Dorn/Hanson, and others, seemed to agree that the trade shock was "large". 69/
My contribution was to say it was even a bit larger than what ADH had found. Either way, the Fed quickly found itself pinned close to the zero lower bound in 2000. Low interest rates then fed the housing bubble. When this collapsed, the US was in a liquidity trap for real. 70/
Now, normally, when there is a trade shock, the impact to employment is generally zero. This is because the Fed will spring to life, cut interest rates, and this, over time, will tend to raise employment right back to where it was. In addition, it would weaken the XR. 71/
So, it can even be expected that tradable sector jobs won't be lost from a trade shock, after the exchange rate depreciates and tradable sector jobs are restored. However, when you're in a liquidity trap, the Fed may be unable (or unwilling) to offset the impact of a shock. 72/
In this scenario, a trade shock can subtract directly from aggregate demand. In addition, w/ hysteresis, yesterday's trade shock can subtract from aggregate demand today. 73/
The upshot is that this major shock to relative prices likely was the major shock which led to the so-called "secular stagnation", the shortfall in demand leading to slow US growth after 2000. 74/
Since a trade deficit implies that savings are less than investment, this meant that, in the 2000s, US households were accumulating debt. After the financial crisis hit, this then contributed to the balance sheet recession. 75/
And, given the shrunken US tradables' sector, this implies the difficulty of getting savings up enough to replenish balance sheets/difficulty with deleveraging. 76/
So, what was the policy solution? Well, in 2011, Donald Trump was already dropping hints about running for President, and to Obama's left on trade policy, I felt the administration should have taken a tougher stance. 77/
However, I also felt that, given that the US-China exchange rate is set in Beijing, that progress on any specific restraint of trade by China (often themselves opaque) could be offset by another devaluation (or other opaque rules). 78/
By 2009, it was also clear that, despite the slow recovery, the Fed was unwilling to do it's job. When Bernanke raised the discount rate in 2010, signalling a shift to tightening and causing the dollar to appreciate, I was irate. 79/
My policy plan, then, was to kill two birds with one stone. Looser monetary policy would grow the economy, helping manufacturing, and it would also cause the dollar to weaken, also helping manufacturing. 80/
Thus, I suggested transitioning to a higher inflation target, in part to discourage the Chinese from accumulating more Treasuries, and to devalue the ones they had, and also to ensure that US not be stuck in a liquidity trap again. 81/
At the time and in retrospect, it's hard for me to understand the motivations of those who were opposed. Inflation was below target. Inflation expectations were too. Growth was slow and we had mass unemployment. But no action from the Fed. 82/
Strangely enough, many in the Obama administration did not see things my way. Bernanke knew what he was doing. Fiscal policy was the only game in town (w/ a Republican House???). 83/
Of course, later, Bernanke would go on write that he was exasperated with other FOMC members by 2009, and that he believed central banks should price level target when exiting a liquidity trap -- implying much more aggressive Fed policy from 2009-2014. 84/
So, why did this paper take so long to publish? Well, I have a few theories on that as well. First, much like this thread, the papers I wrote at first had a tendency to be overly convoluted. 85/
For young authors out there, everyone -- editors, referees, readers -- appreciate short, to-the-point papers. I include myself in this. I believe I could have published this series of papers better by simply writing shorter papers. 86/
Another tip for young authors is: try to get more senior coauthors. I wanted to make my own mark. This is foolish thinking, letting your ego talk. That's how you make no mark. Many tenure committees don't discount papers with seniors at all. 87/
You'll find that senior economists will (a) know how to position & write a paper, (b) know which editors will be more likely to accept the paper, (c) know which editors to choose), (d) know which papers to cite (to draw which referees), etc. etc. Save yourself trouble. 88/
One of the laws of academic publishing is to write papers which the median referee in your field is going to agree with. Better to write "trade costs matter" papers, which all trade economists agree with, rather than "trade shocks can have negative consequences..." 89/
But also, from the beginning at CEA, I could see that trade economists (I love you all!), were very hesitant to flag trade as a cause of the collapse in manufacturing employment. Partly, this is for understandable reasons. 90/
Just look at the crude protectionism of the current President, whose policies on this score I do not support. Many politicians are not sophisticated enough to learn that a trade shock had a negative impact but that banning trade or tariffs is not the correct response. 91/
Even worse for me, while some early referees at the QJE and AER were sympathetic, once we had the rise of Donald Trump & Sanders, I suspect trade economists were even less likely to want to see more damaging information about trade come to light. 92/
While, this sentiment is understandable, on the other hand, when the exchange rate is set in Beijing, that's not exactly free trade, is it, comrade? Facebook is totally banned in China. So is Google scholar. Intellectual property is frequently stolen. 93/
And, it's not just the US. Siemens had it's high speed rail designs stolen, and told if it complained, then it would be banned from the Chinese market. Germany did nothing. 94/
Economists supporting the status quo in regards to trade with China are not exactly carrying the torch of free trade. I worried that the Obama administration was not adequately standing up for American interests, and I'm a Democrat who worked for the DNC. 95/
Not to say, "I told you so", but I did feel that, in the first Trump-Hillary debate, Hillary was really on the defensive when the topic was trade. Could a more robust Obama administration set of policies vs. China have mitigated that? I guess we'll never know. 96/
In any case, here's how the submission sequence went. The referees were split at the QJE. I made the mistake of rewriting the paper as if it was an R&R to address the comments, and then sent it off to the AER. 97/
This wasted my time. I should have spent that time working on a follow-up paper. At the AER, I received one very positive report, but the second one was negative. However, I felt each of the negative report's comments was factually incorrect. 98/
I.e., the negative report stated that I did not control for sectoral trends, when I had (and I had plotted the pre-treatment trends!). Peter Schott was visiting Moscow at the time, and he helpfully encouraged me to challenge it, which I did. 99/
The editor explained that incorrect referee reports are common, and my identification looked fine, but the topic, the collapse of US manufacturing employment and exchange rate hysteresis, were not important enough for the AER. 100/
Next I tried REStud & ECTA, and both were rejected with no support. The Top 5 journals in economics carry a huge premium, and given the split decisions at AER/QJE, I figured I would give them a chance. 100/
Next, I used my AER referee reports, and went to AEJ: Applied. At last, an R&R. However, it was a weak R&R. It seemingly wanted me to change everything about the paper, and, specifically, it wanted me to not mention anything about the decline in US manufacturing employment. 101/
Here I made several crucial mistakes. The thing to do would have been to reach out to the editor, lay out my thinking, and clarify whether this point was absolutely crucial. 102/
Instead, I spent a lot of time on the R&R, did every robustness check asked, etc., but I left in the part about the decline in manufacturing employment. After all, the evidence for this can be seen in the same graph/set of regressions as the hysteresis. 103/
I included a note that I would remove it if it was crucial. I figured they were smart guys who would listen. The editors did not take kindly to this, and so rejected on the 2nd round. In retrospect, I can definitely see their point, and am not bitter. A learning experience. 104/
After that, I believe I had maybe one positive report at JEEA, and then no support at the EJ & REStat. I then tried two of the other AEJs (I don't think they take kindly to submitting to more than one of them), and by then, I already 10 submissions in! 105/
Next I went to the JIE. Boom! Another R&R. However, reading the reports, my heart sank again. They also wanted me to change seemingly everything about the paper. They were fine with the "decline of manufacturing" part, but didn't buy the "hysteresis" part. 106/
This time, I really did my best to implement every single one of the editor's and referees' suggestions. They asked for a flood of sensible robustness checks. The basic results regarding hysteresis seemed to hold up just fine. 107/
In the end, neither referee nor the editor was convinced. He ended up writing: "You offered no evidence for hysteresis. Did you argue that on accident?" Of course, I believed I had conducted various tests for hysteresis. If this diagram does not suggest hysteresis, what would?
After that rejection, I'll confess, I did not touch research for about 6 months, although I was also absorbed with teaching at the time, and hosting a World Cup conference in Moscow. I plotted to leave the hell-hole of academia. 109/
But, I kept submitting the paper. By now, I felt the paper was in better shape. I got close again at the JPE. The editor was kind enough to write an encouraging note, calling the paper brilliant, but rejecting it all the same. 110/
Finally, then, I got a third R&R at the EER. This one was also weak. The first round reports were tough, but totally fair, and the editor had also taken time to read the paper carefully. On the 2nd round, the editor said no need to go back to referees if I can fix a few things.
And thus, finally, after 6 years+, my paper was published. (Note, it was actually 17 total submissions, not 19, I had lost count...) Huge thanks to the editors, referees, advisors, and seminar participants that contributed. 112/
In particular, huge thanks to Bryan Kovak, who took the time to provide a lot of helpful feedback with nothing to be gained. Susan Houseman as well, who together formed a great AEA panel on manufacturing in 2018 113/ tinyurl.com/ycso7xez
Missing some Tweet in this thread? You can try to force a refresh.

Enjoying this thread?

Keep Current with Doug Campbell

Profile picture

Stay in touch and get notified when new unrolls are available from this author!

Read all threads

This Thread may be Removed Anytime!

Twitter may remove this content at anytime, convert it as a PDF, save and print for later use!

Try unrolling a thread yourself!

how to unroll video

1) Follow Thread Reader App on Twitter so you can easily mention us!

2) Go to a Twitter thread (series of Tweets by the same owner) and mention us with a keyword "unroll" @threadreaderapp unroll

You can practice here first or read more on our help page!

Follow Us on Twitter!

Did Thread Reader help you today?

Support us! We are indie developers!


This site is made by just two indie developers on a laptop doing marketing, support and development! Read more about the story.

Become a Premium Member ($3.00/month or $30.00/year) and get exclusive features!

Become Premium

Too expensive? Make a small donation by buying us coffee ($5) or help with server cost ($10)

Donate via Paypal Become our Patreon

Thank you for your support!