#PriceAction
Stop Loss vs Hard Stops
Wanted to go over a key topic I find important and that’s knowing when to cut your loses early on a systematic approach
Hard stops are in place to limit your loses and resolute around key levels
1.Long Example
2.Short Example
3.Conclusion
Stop Loss vs Hard Stops
Wanted to go over a key topic I find important and that’s knowing when to cut your loses early on a systematic approach
Hard stops are in place to limit your loses and resolute around key levels
1.Long Example
2.Short Example
3.Conclusion

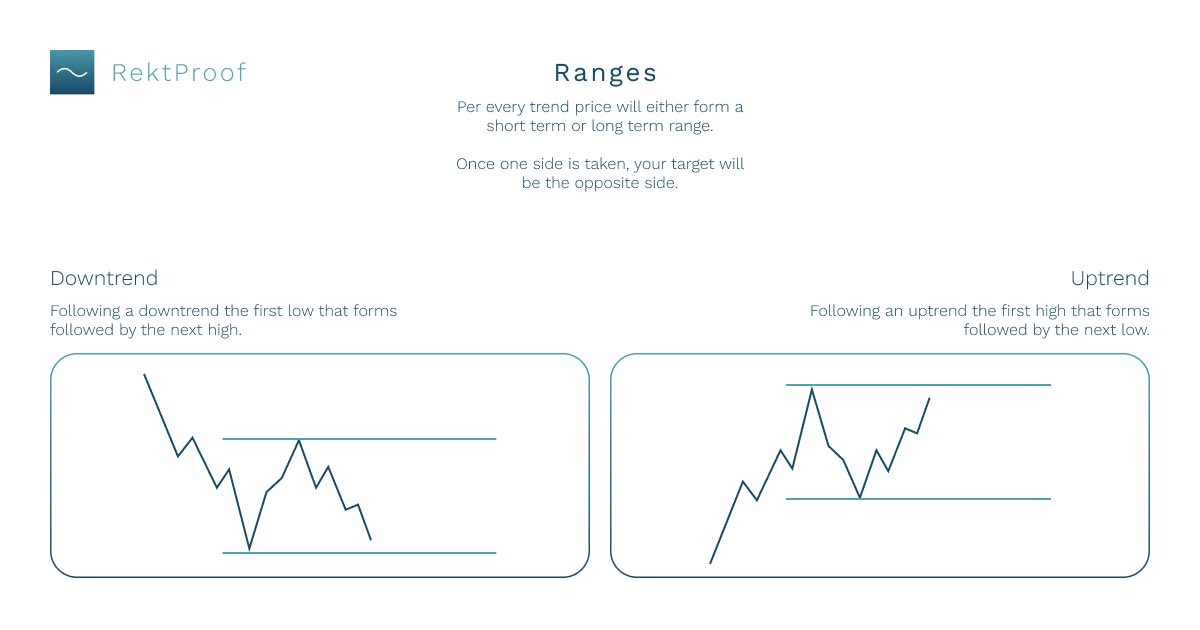
1. Long Example
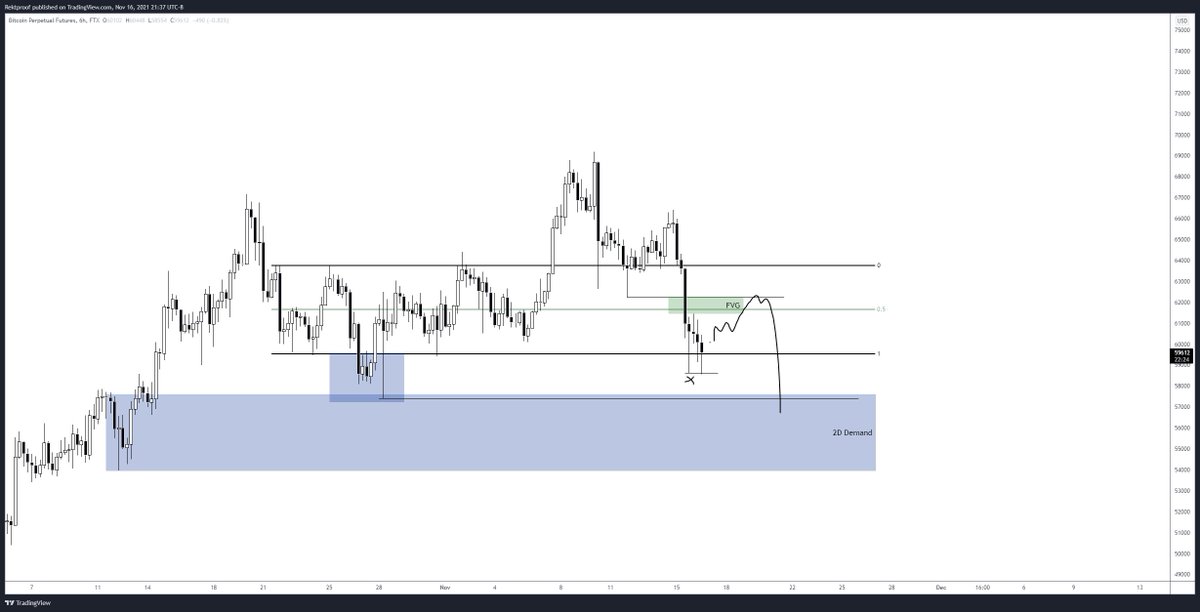
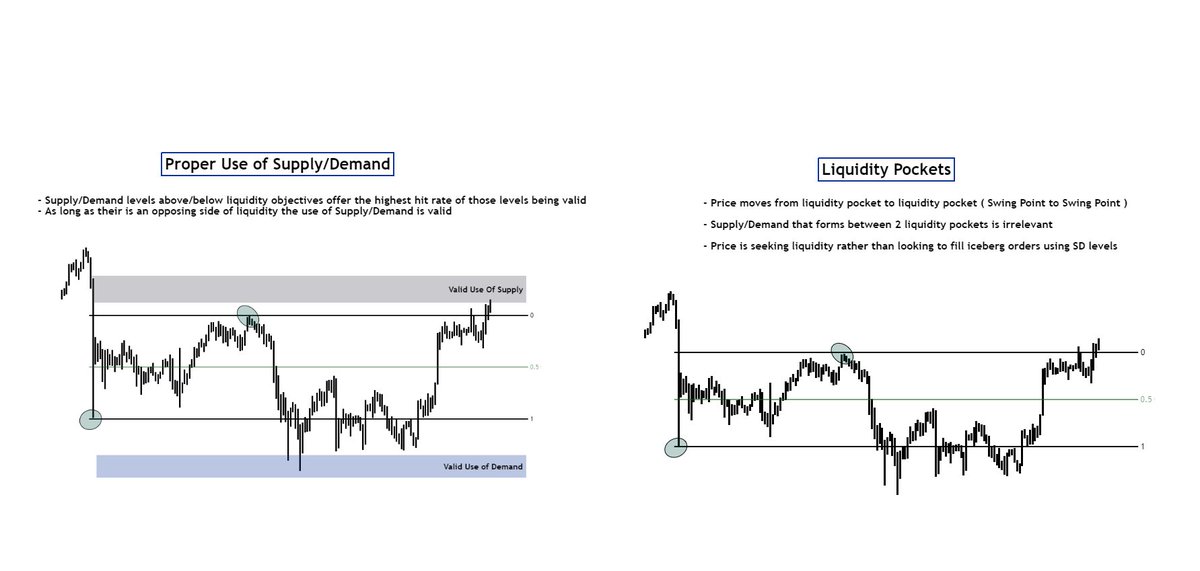
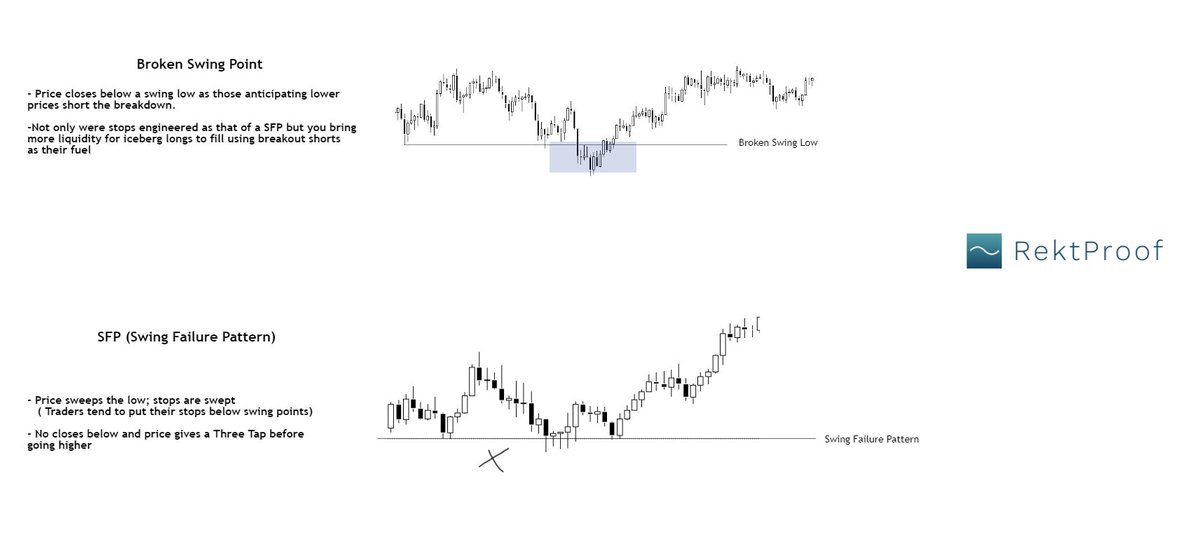
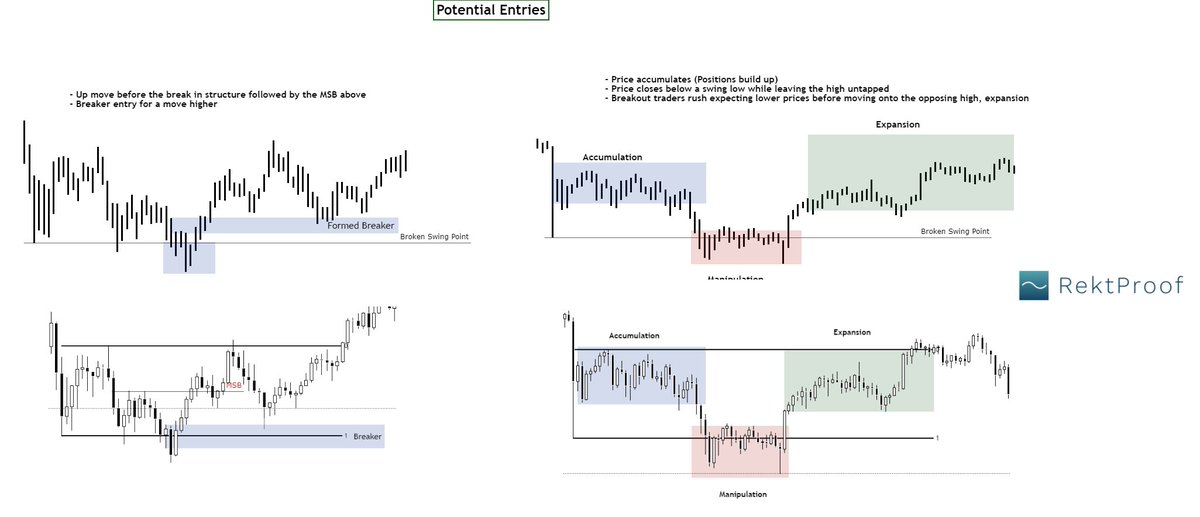
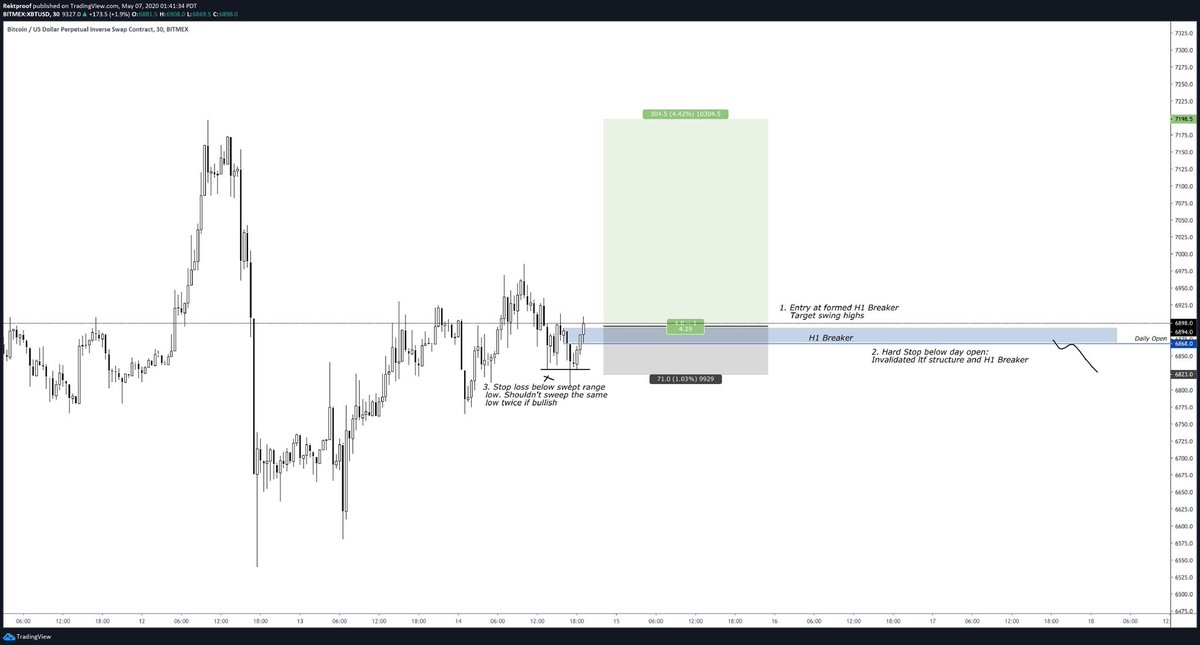
When looking for longs it’s crucial to find formed demand levels/breakers above your key levels. Stop loss placements are around previous formed swing points.
Closes below key levels are signs of weakness and make for a manual exit.
Notes on the chart
When looking for longs it’s crucial to find formed demand levels/breakers above your key levels. Stop loss placements are around previous formed swing points.
Closes below key levels are signs of weakness and make for a manual exit.
Notes on the chart


3. Short Example
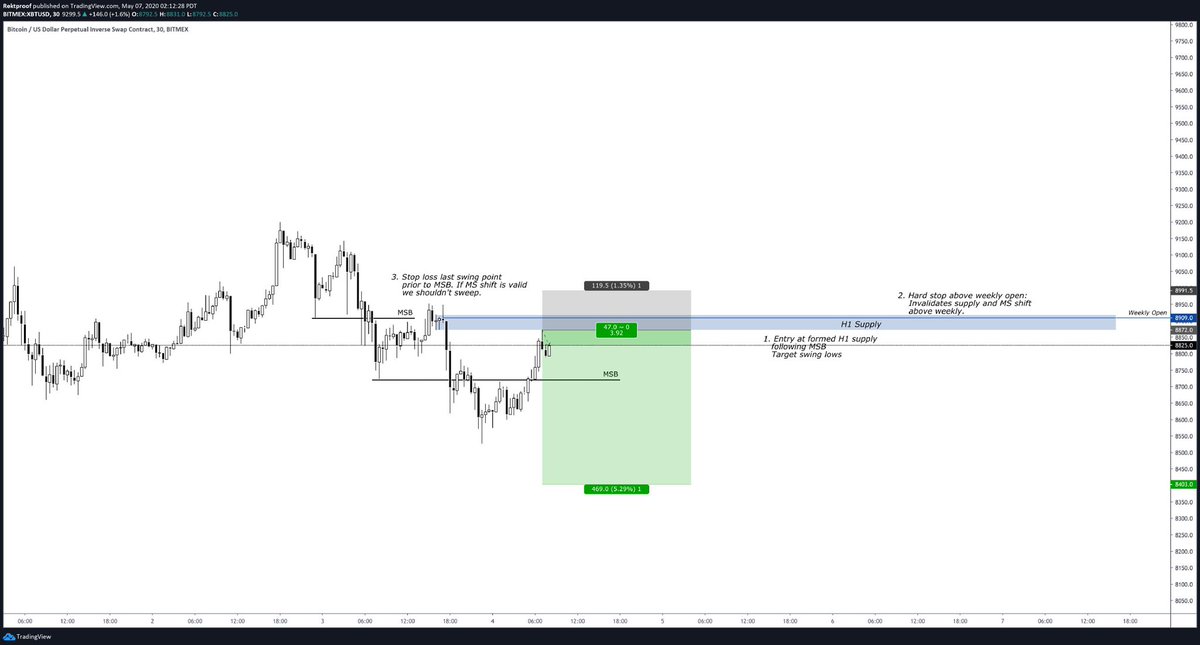
For shorts you want your key levels above your formed supply/resistance levels. Stop loss placements above previous swing points.
Notes on the chart
For shorts you want your key levels above your formed supply/resistance levels. Stop loss placements above previous swing points.
Notes on the chart


3. Conclusion
Knowing when to exit and taking a full stop are two different things.
As a trader you need to have both an Invalidation point and a manual exit point. Trade management as such limits your loses and keeps you untied to your running positions.
Hope this helps.
Knowing when to exit and taking a full stop are two different things.
As a trader you need to have both an Invalidation point and a manual exit point. Trade management as such limits your loses and keeps you untied to your running positions.
Hope this helps.
• • •
Missing some Tweet in this thread? You can try to
force a refresh