
 $ETH / $USD
 Formatting ranges:
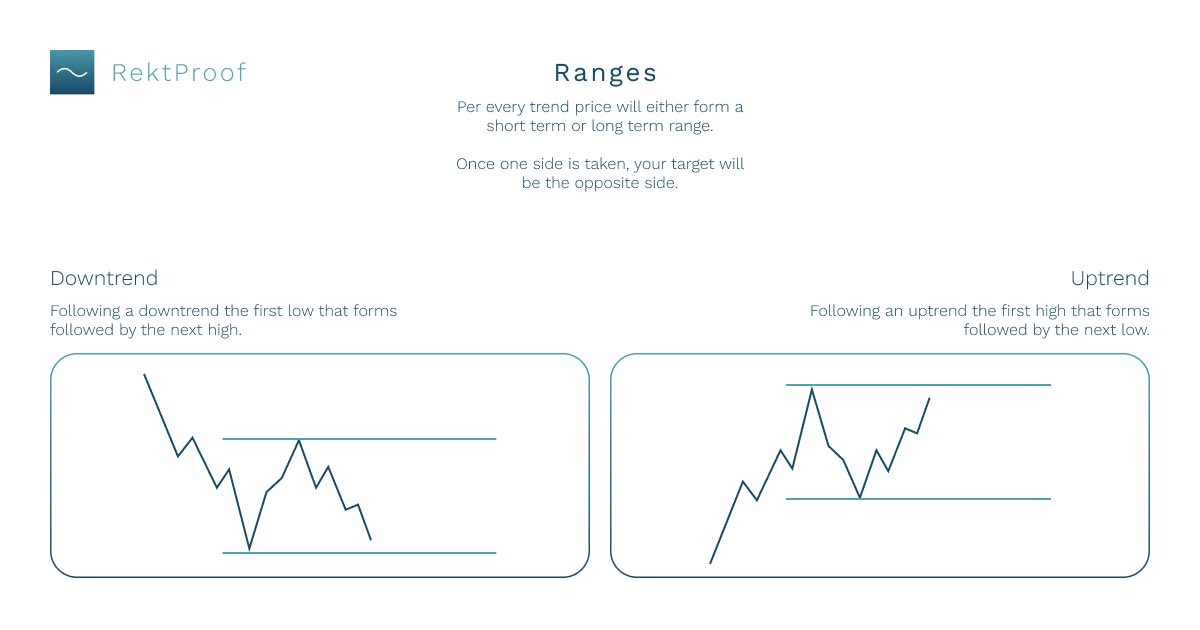
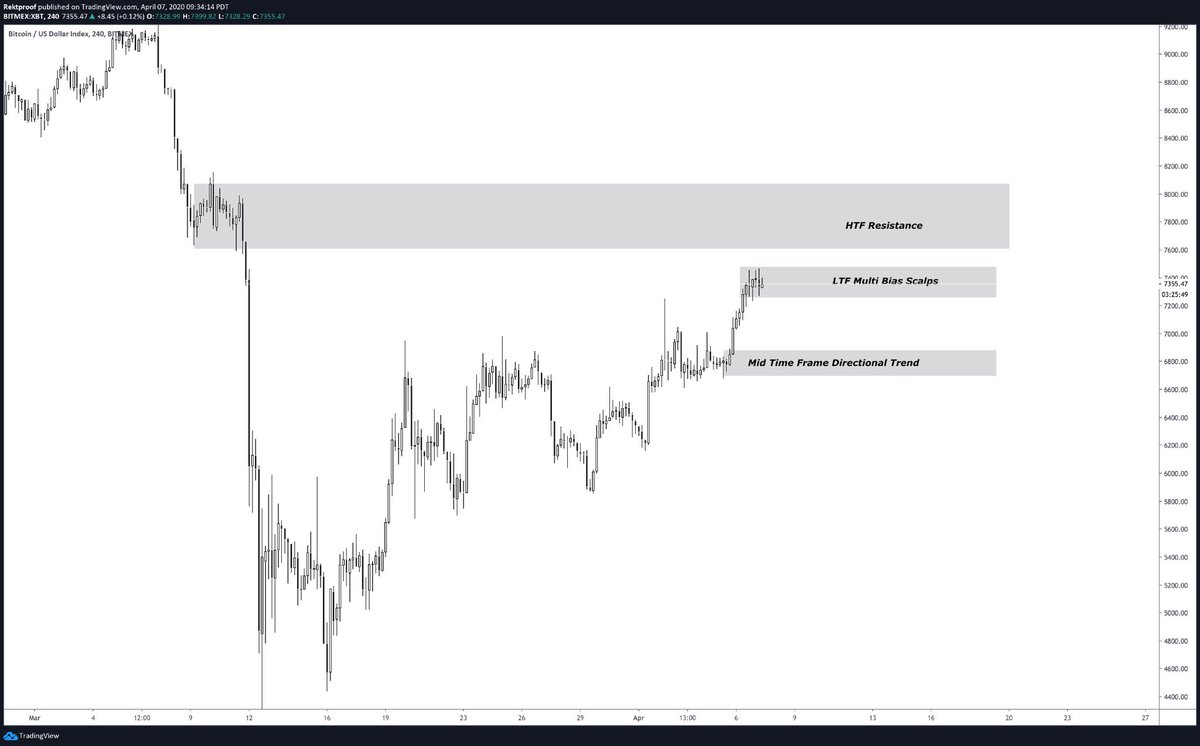
 $BTC / $USD
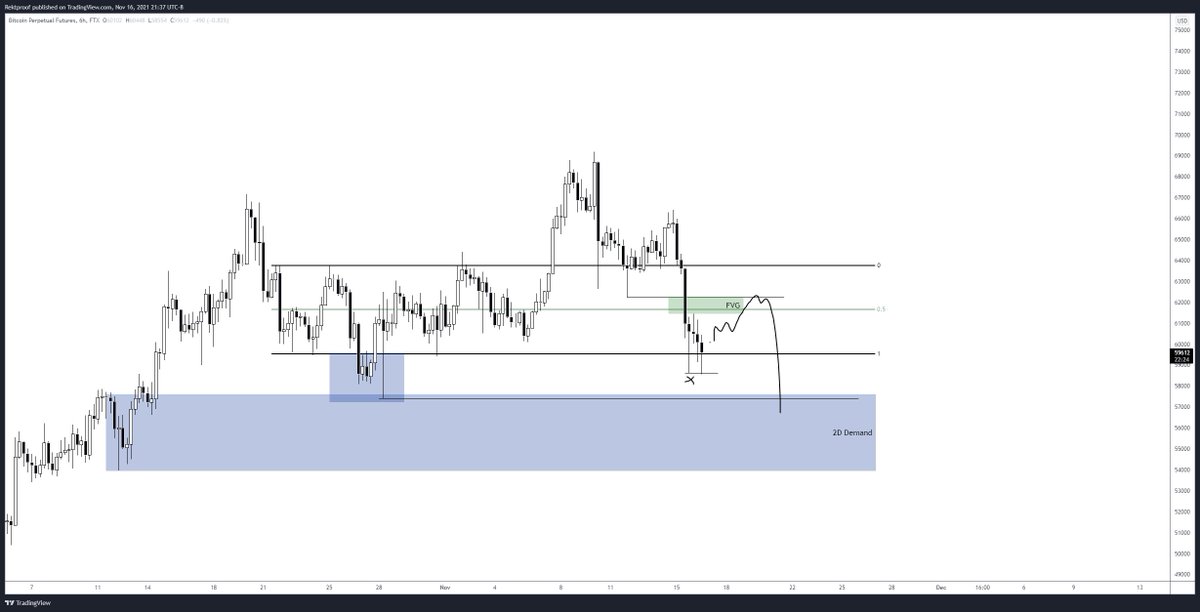

 Improper use of SD, to my perspective.
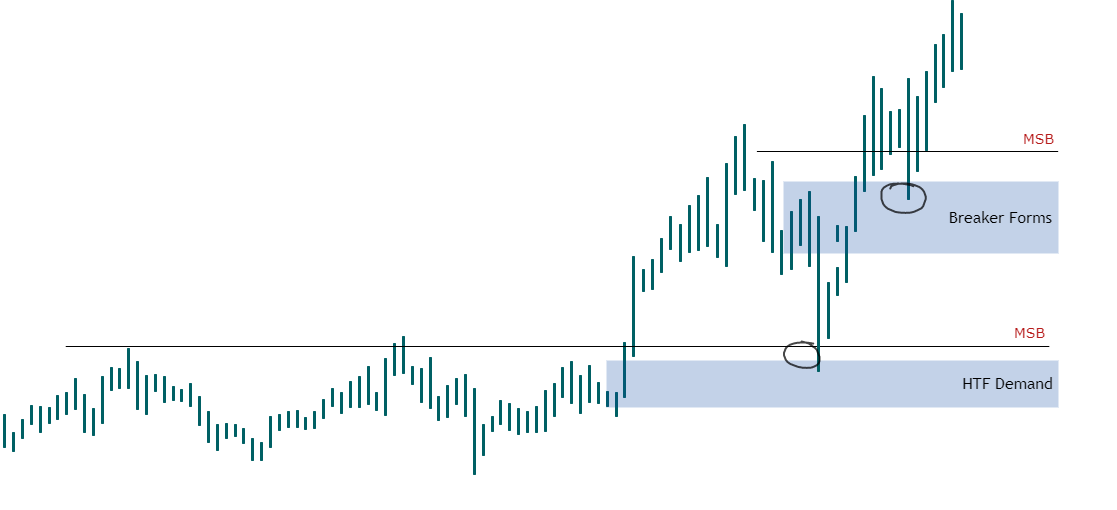
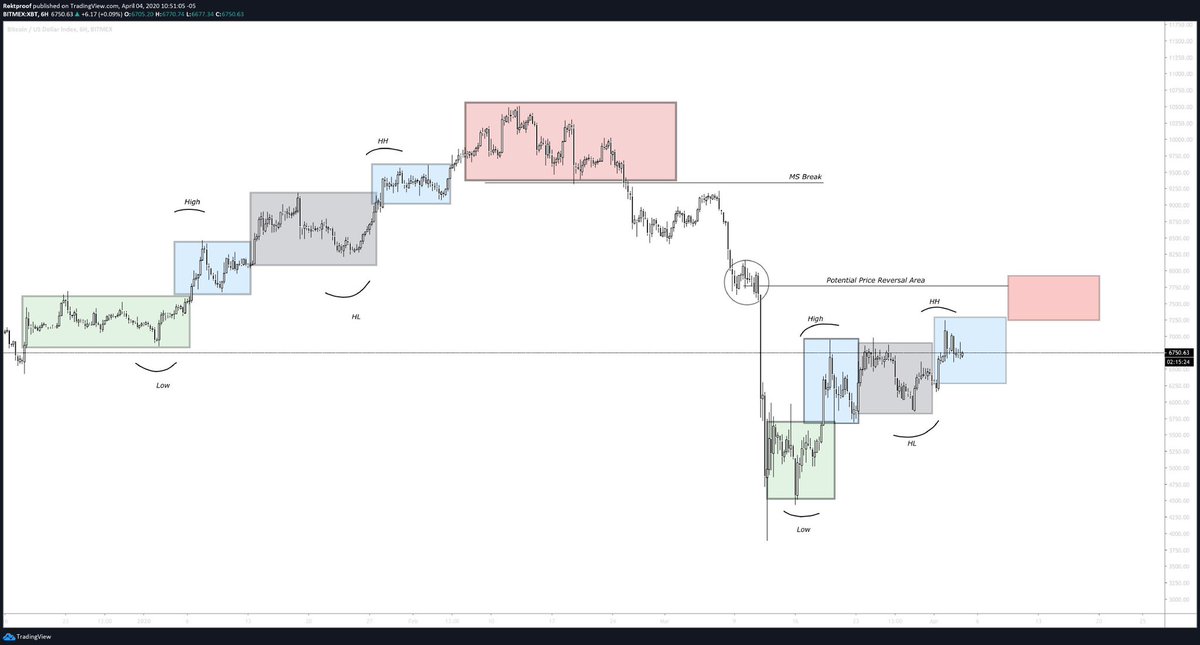
 Broken swing points vs SFP's
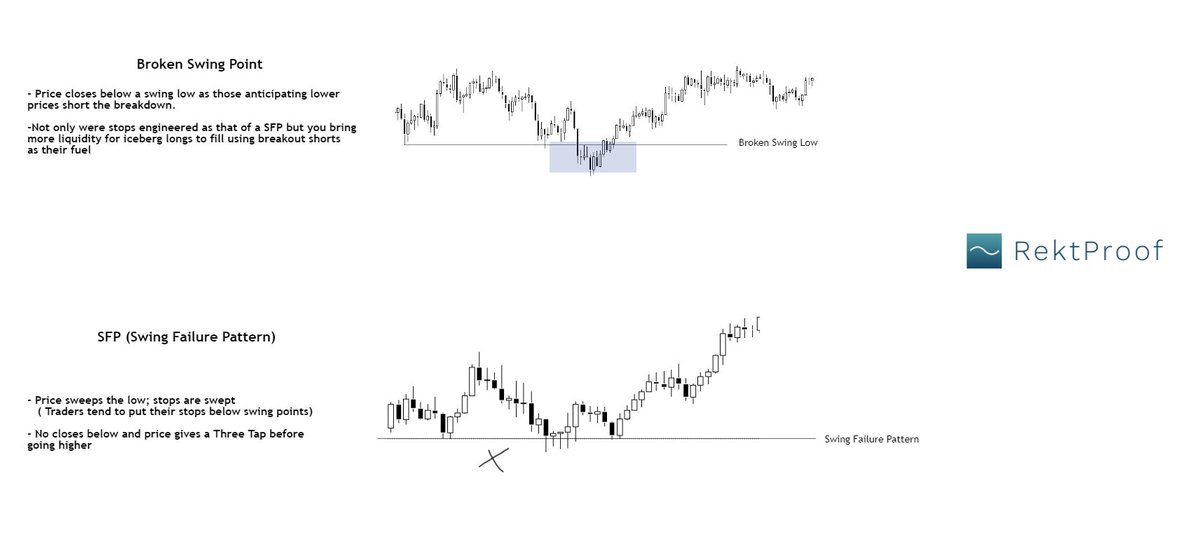


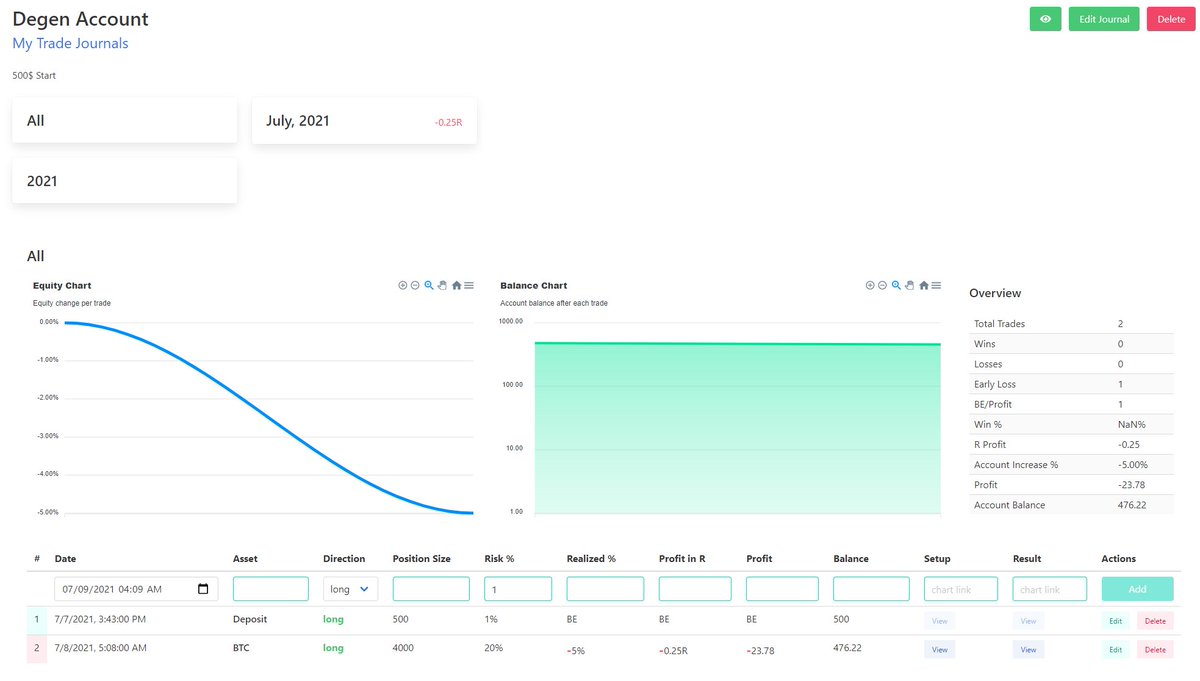
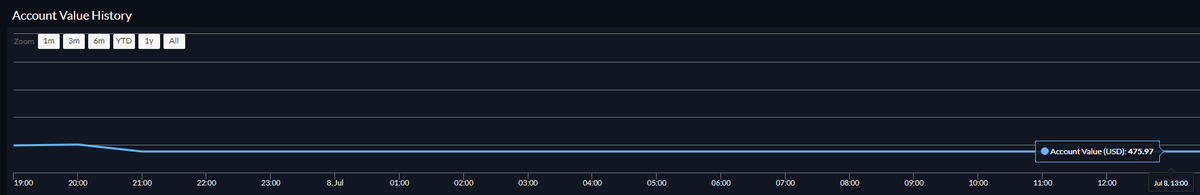
 Degen Account Update:
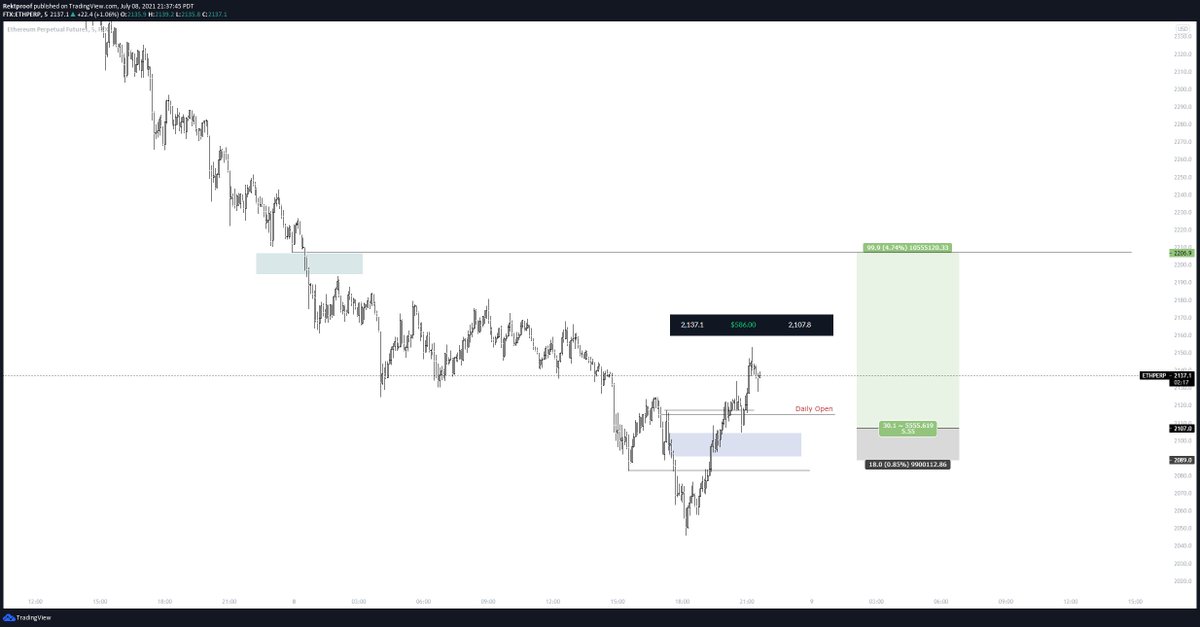
 Power of 3 or the market is wrong.
 2/4
2/4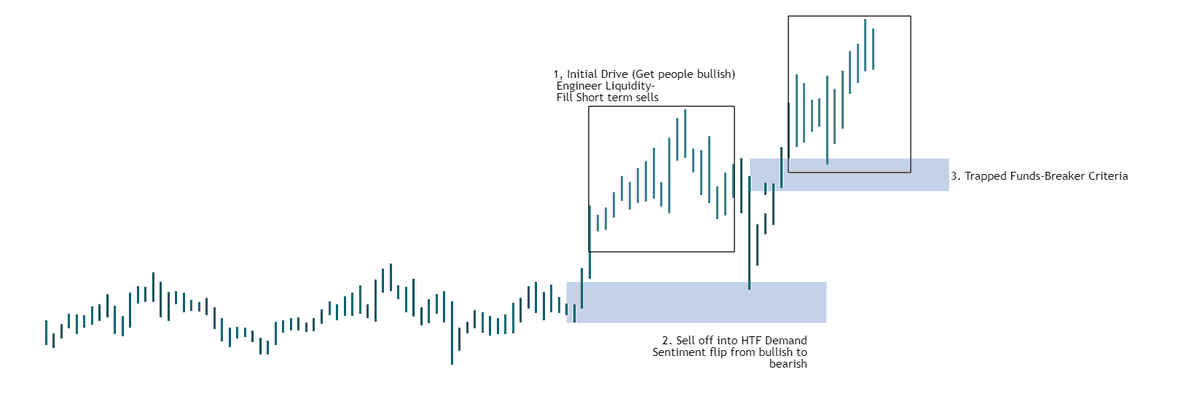
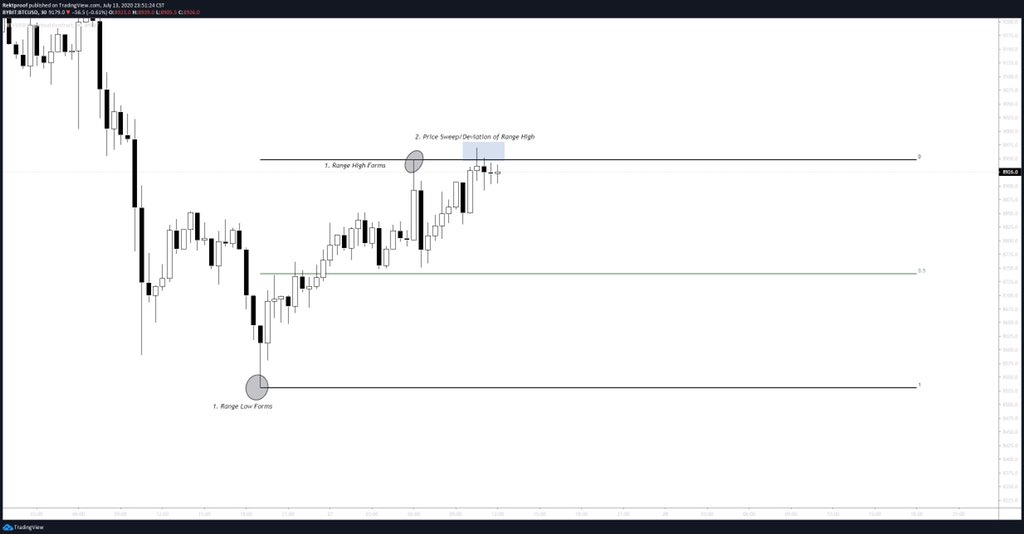
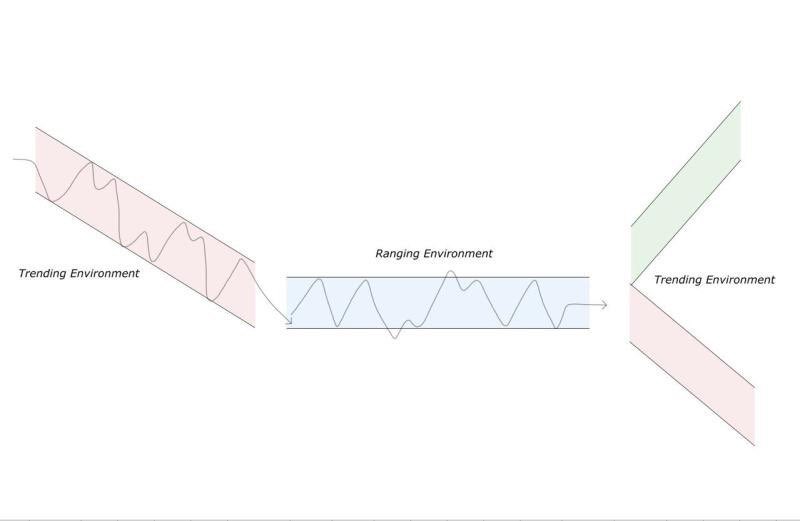
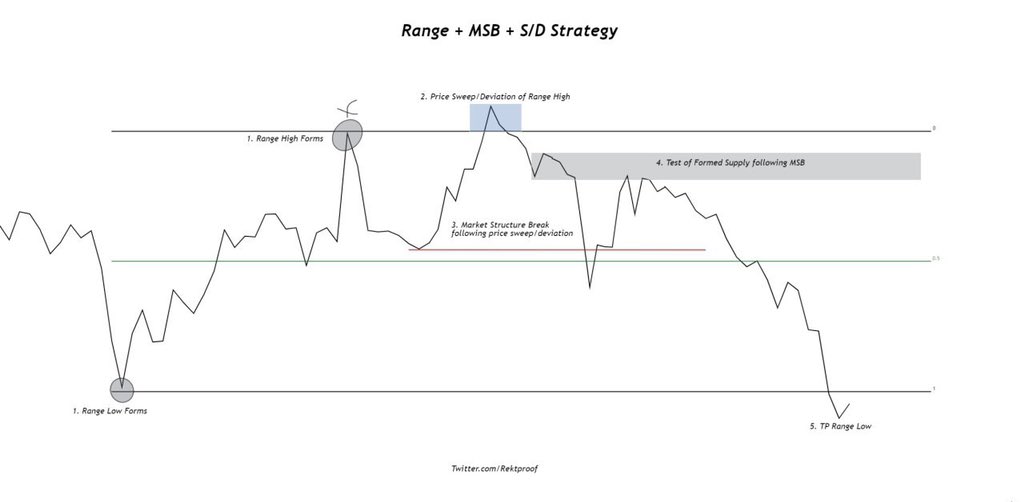 Range forms
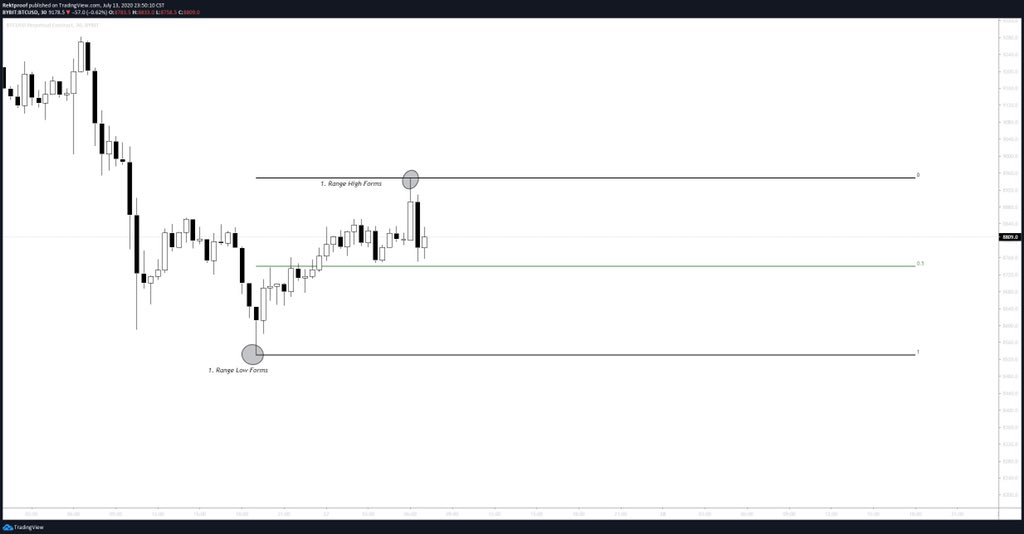
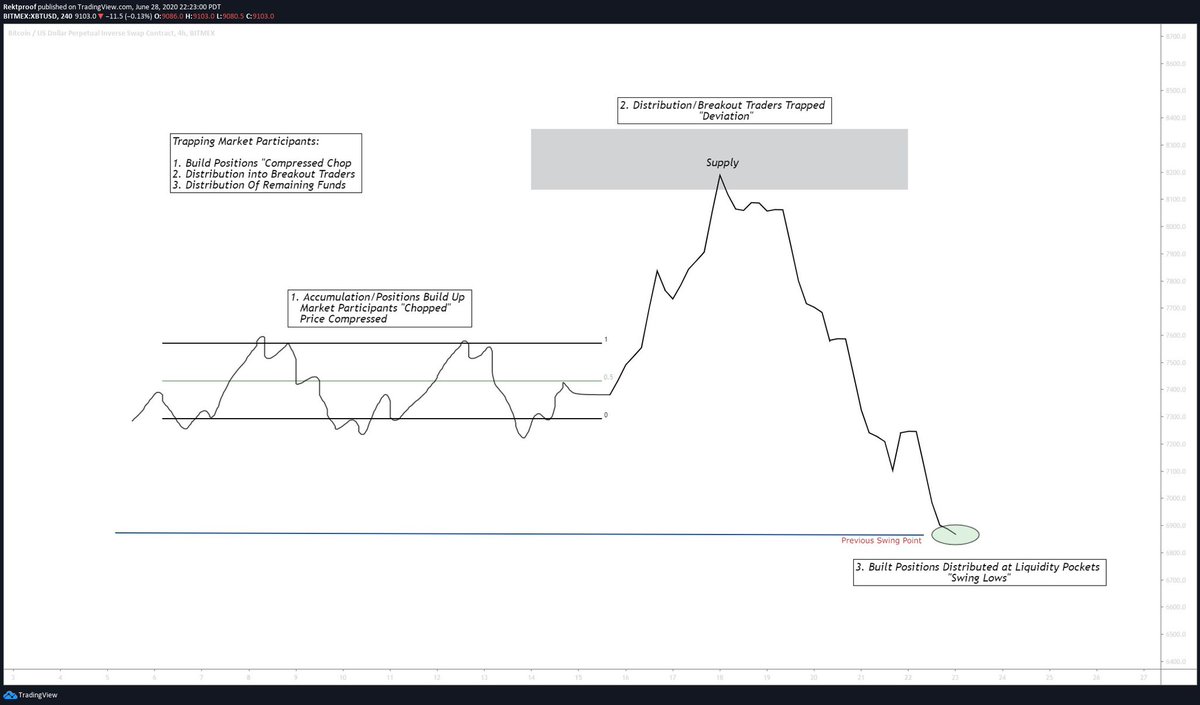
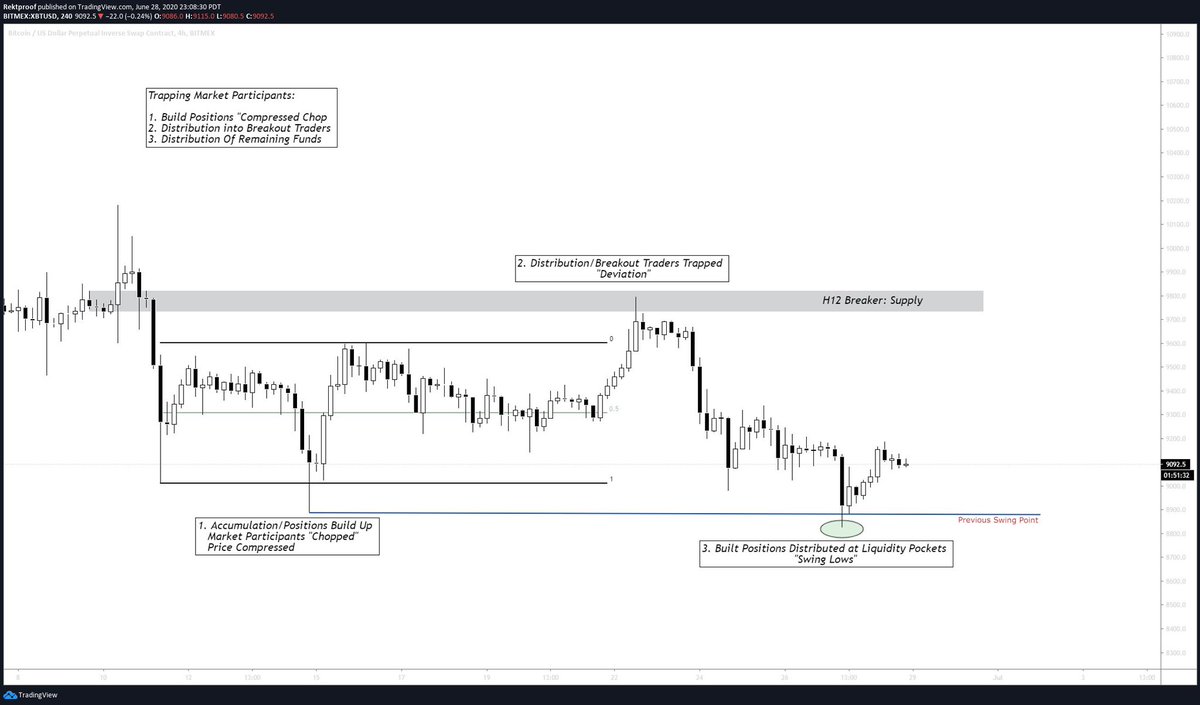 1. Accumulation:Postions Build up
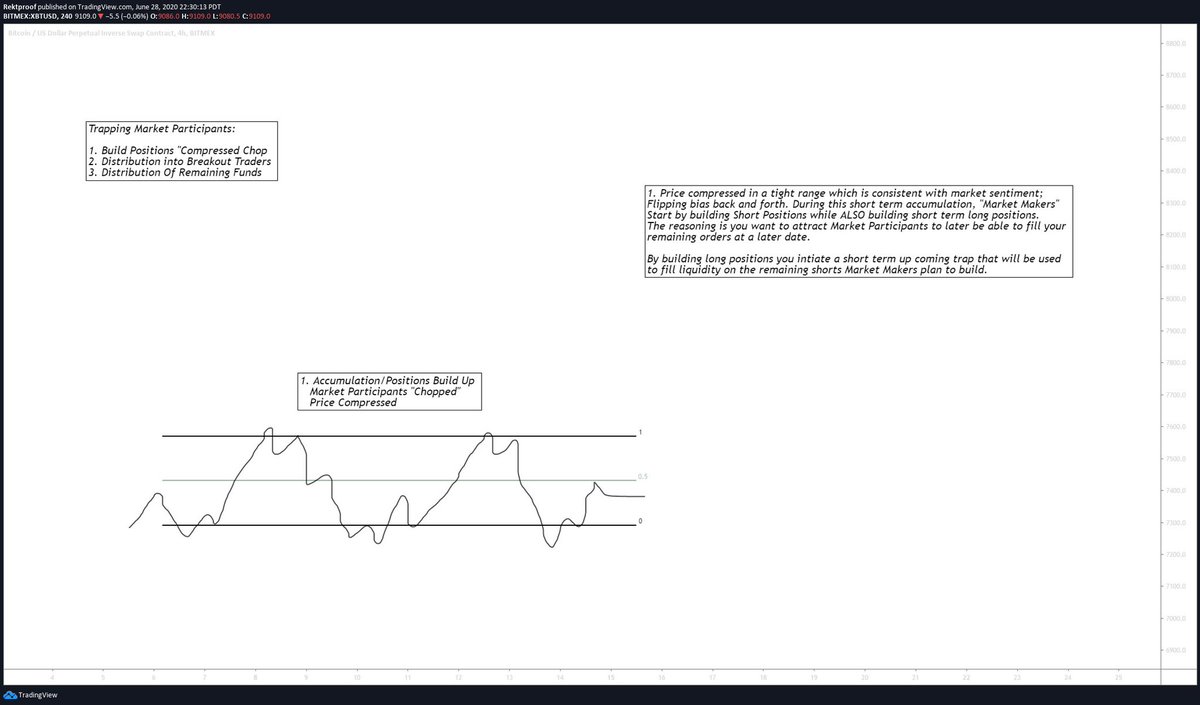


 1. Long Example
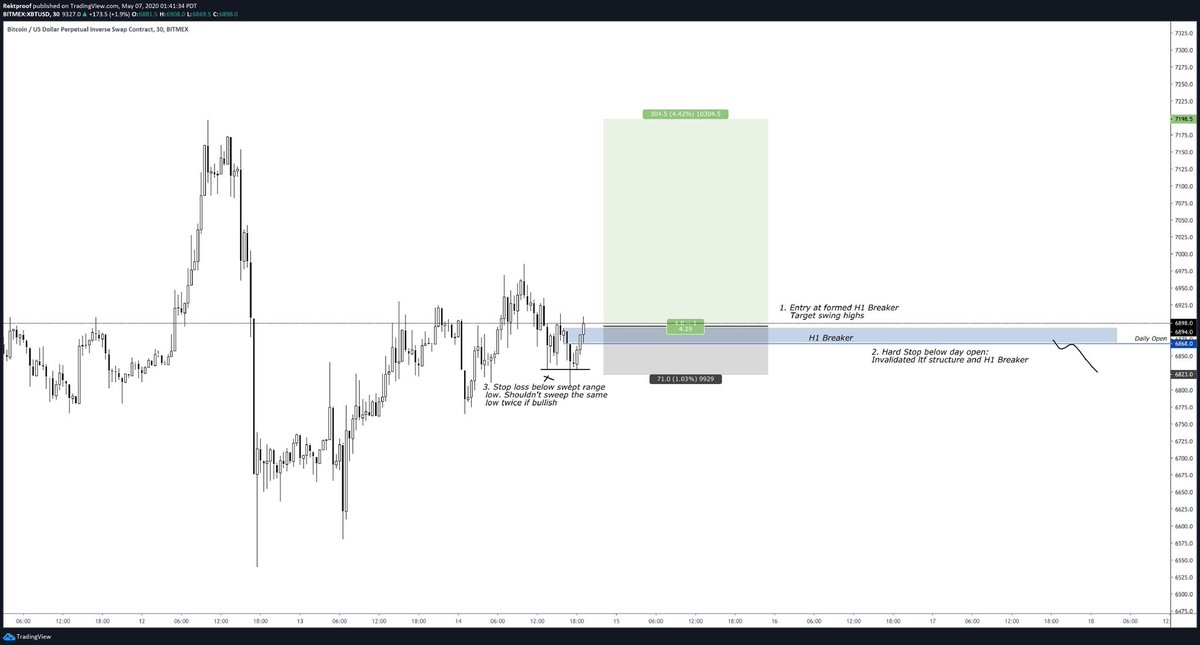


 /
/ 
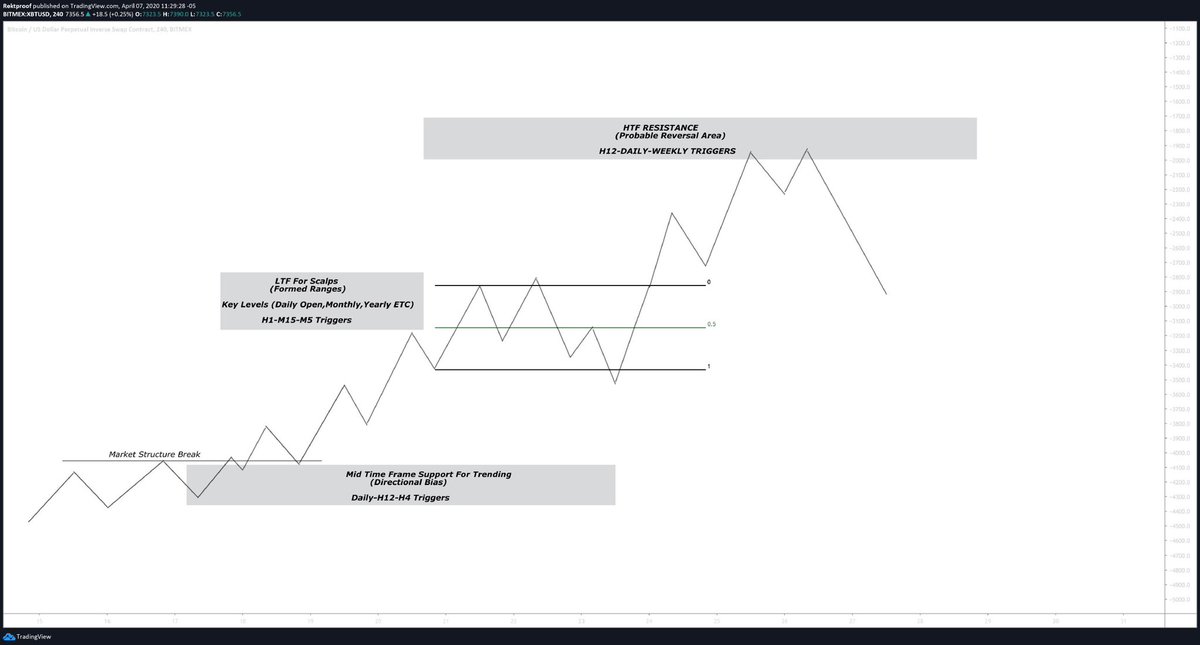
 1. Previous Price Action
 /
/ 

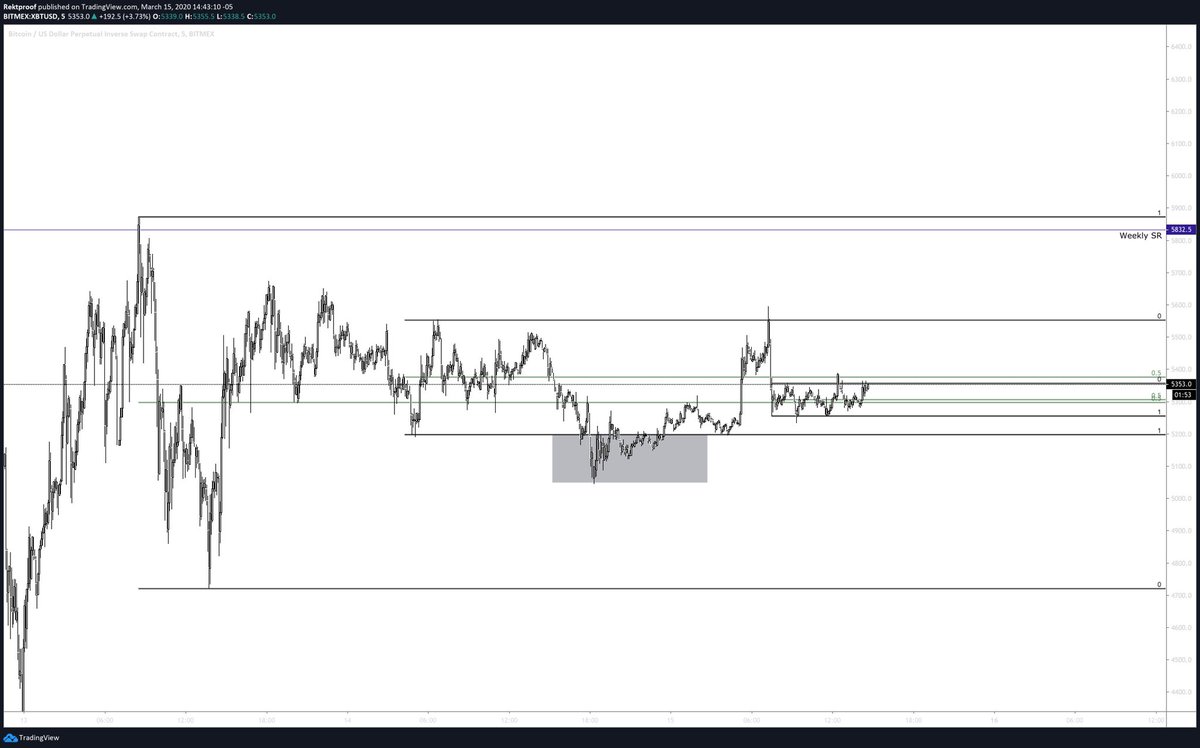 $BTC / $USD


 2/4
2/4

