Measuring Sky brightness from satellites. Is it possible? Probably!!! It is what our last study says: nature.com/articles/s4159…
I will try to explain it here. Thread👇
I will try to explain it here. Thread👇
This paper has a long story. Everything began 11 years ago, when I was making my PhD. Thesis in Galaxy evolution and @cefalopodo and @peleonk where my PhD. supervisors. at the time, the light pollution was an extreme minority field of research.
We bought some of the very first USB Sky Quality Meters And as I was too busy with my PhD. We discussed that would be very interesting to make a map for the sky brightness distribution around Madrid. So we convinced a student Berenice Pila Diez to start it linkedin.com/in/berenicepil…
She did a great job and published the very first map of the light pollution of Madrid, and one of the very first maps in the World. eprints.ucm.es/11364/
Later, may others like Paco Ocaña, @22CETA22, Alberto Fernández, @jgcasta, Mireia Nievas, @peleonk, @cefalopodo and me, joint to create this map that we did publish here: sciencedirect.com/science/articl… zenodo.org/record/51713#.…
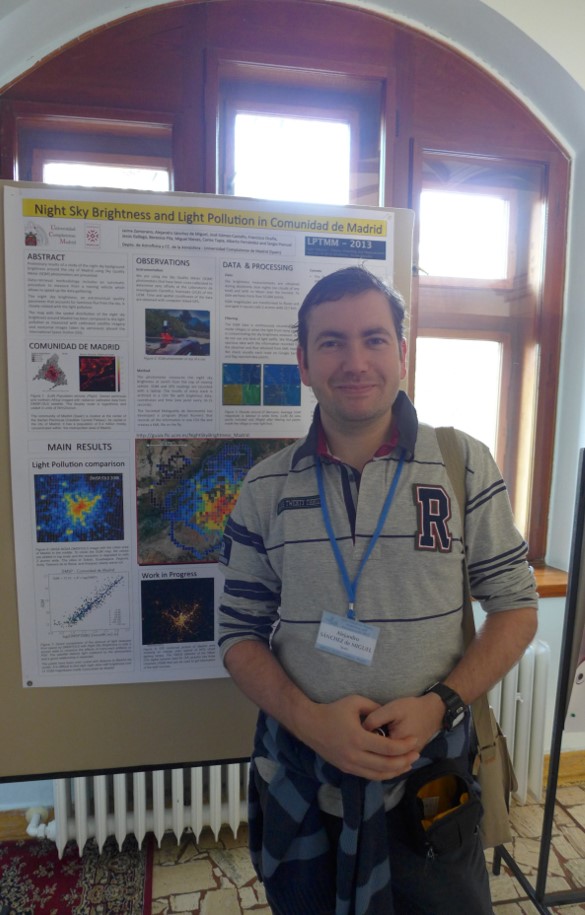
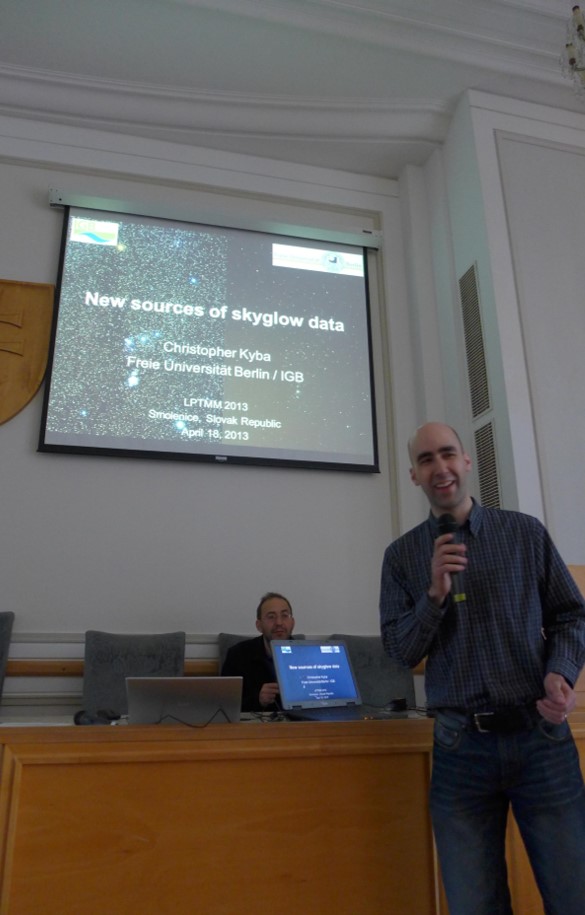
Before that publication, in 2013. I went to present our preliminary results to the first LPTMM.
There I met @skyglowberlin . We did have a discussion about the nature of the correlation that we found between sky brightness measurements and the sat data.
Chris was in favour that the relationship was purely instrumental and was just a coincidence. I was convinced that the relationship was real. He was just about to publish this: nature.com/articles/srep0… with the @GLOBEatNight data. That was data of all the World
We did just published this poster: eprints.ucm.es/24201/
So, for my thesis, I started to study if there was any correlation with the ISS and the VIIRS. And I did found it. Indeed the @IAU_org made a PR where they included that preliminary result among other things. iau.org/news/pressrele… (see fig. PR Image iau1510e)
If you want to see more things of my thesis, the English translation is here: zenodo.org/record/1289933…
Spanish original here: zenodo.org/record/1289896…
Spanish original here: zenodo.org/record/1289896…
But that was not enough. Why this was happening? Out theory was that the same light that is scattered down by the atmosphere, scattered up because of the symmetry of the scattering.
Did that mean that there were no instrumental effects? Neither @skyglowberlin and I were completely right neither completely wrong.
Even on the VIIRS image, there was some instrumental effects as well probably on the DMSP.

Here can be seen how the light of Chicago gets inside the Lake Michigan

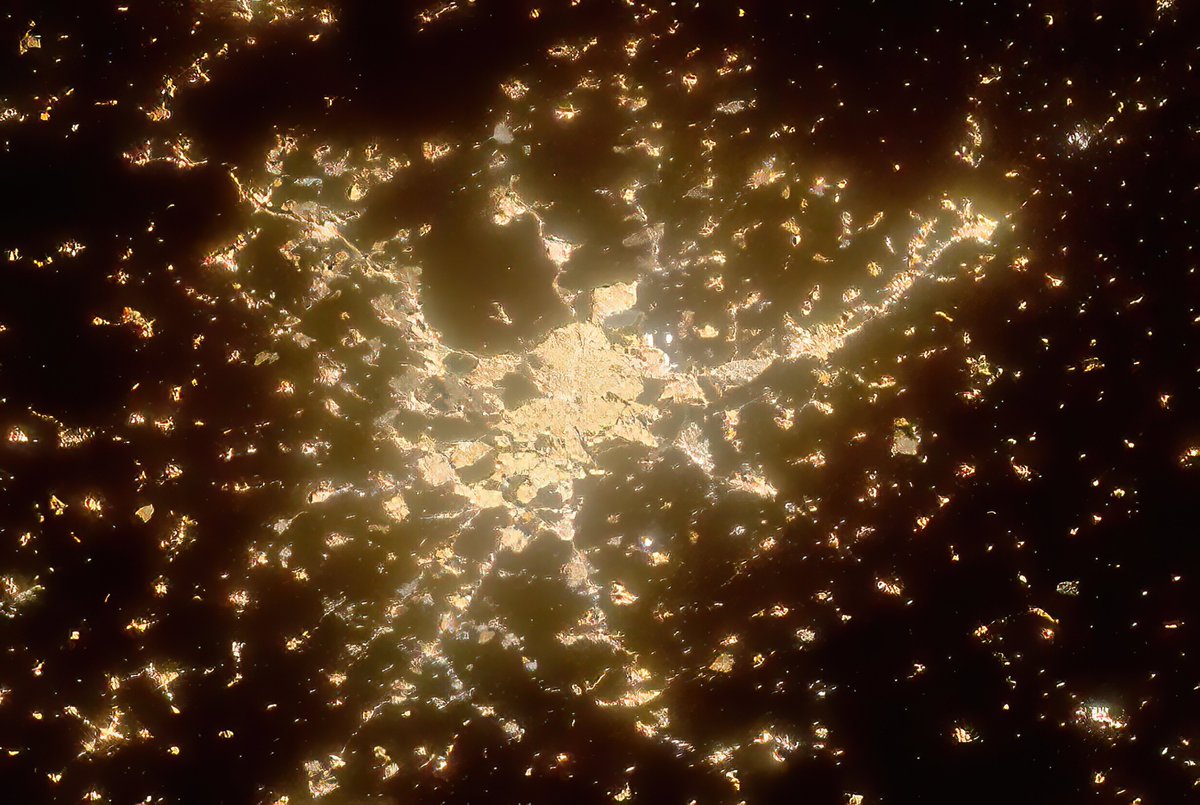
Or here how the glow of Madrid was lighting unlighted areas ad the Monte del Pardo.

I had lot under development but I was mentally stock when @KevinJGaston and @skyglowberlin help me to put all this in an understandable way and helped to interpret some of the results.
Which are the conclusions of the paper?
First: Most of the diffuse light of served is actually what usually we call light pollution from the ground.

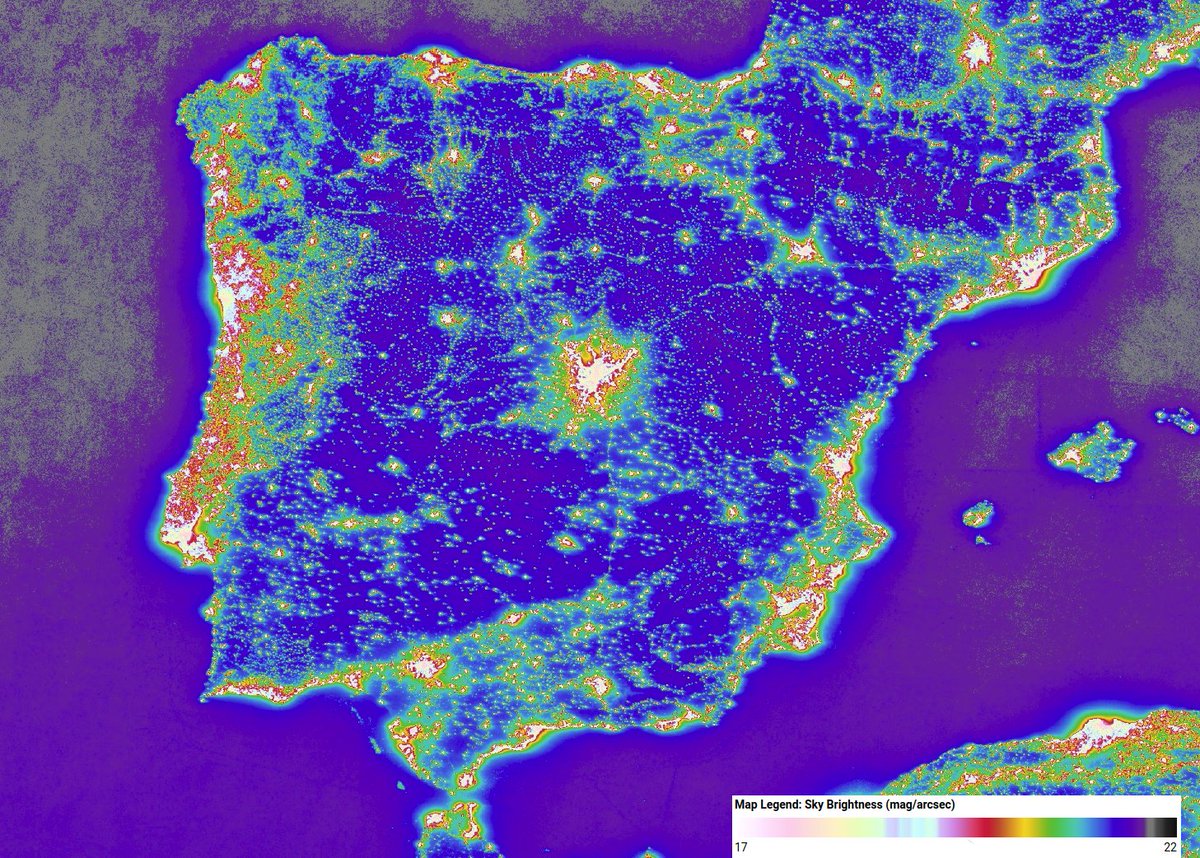
Second. The Diffuse light seen from VIIRS was highly correlated with the Sky Brightness models like F. Falchi et. al 2016

This is a very important result because many colleagues have been struggling with the diffuse light to find the city edges. Now, you only need to subtract the WA to the VIIRS images to solve that problem.
Another result is that we can make 2D sky brightness maps using this sat data. Like this made with images from the ISS.

This particular image and others where possible thanks to the Nightpod without @esaspaceflight @NASA_Johnson @MassimSabbatini @astro_Pettit @astro_Pettit this images would not exist. Because ...
... @cefalopodo, me and other colleagues, requested to NASA to make HDR images. eprints.ucm.es/12729/1/iss_pr… And ESA made it possible with the tracking of the Nightpod.
Unfortunately, not many locations had ISS HDR images.
So. We know that we can make Sky brightness maps with Sat data. Get it!!! No, wait, it is not that simple. Because we found that there also other diffuse light sources.
We did found that the VIIRS satellite is so sensitive that even we can see the milky way effected on the ground. So, we need to subtract that from the data.

Also, there are VIIRS calibration problems. So, until we do not control all the parameters we cannot be 100% of the precision.
Also, we see differences between our predictions assuming that the all diffuse light is artificial light.

This can be good news, the models cannot explain every thing. For example, F. Falchi et. al. 2016 do not include booking effects. So, here there is mountains in between the source and the area might be darker than expected. Here Fabios paper. advances.sciencemag.org/content/2/6/e1…
Also, Our study only uses data from Madrid. Is it representative of the World? Fig 17 of Falchi et. al. 2016 indicate that is the case.

But we need more data to validate these details. Like @travislongcore published a paper recently about correlations between Sky brightness and sat data iopscience.iop.org/article/10.108…
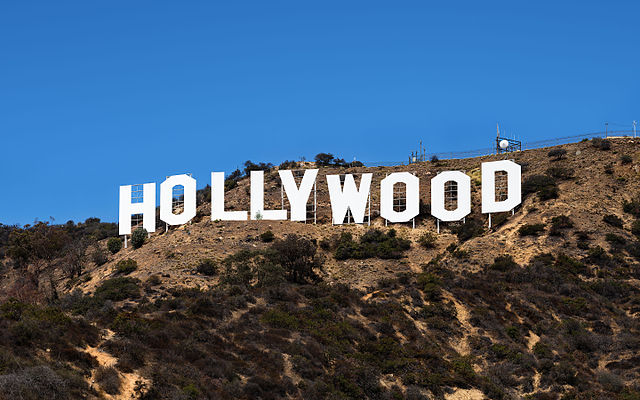
But his sample was probably contaminated by direct light some the sat. But very close to L.A. there is a very interesting area. Angeles National Forest seems that do not match with the predictions. Probably because of the hills and other mountains of the area.

The Hollywood sing hill(en.wikipedia.org/wiki/Hollywood…)
or the @GriffithObserv are just examples of hills/mountains that could be blocking the L.A. Light pollution into the surroundings.
or the @GriffithObserv are just examples of hills/mountains that could be blocking the L.A. Light pollution into the surroundings.
In Spain, we have a similar case with Santander. Because all the city is on one side of a hill.

So, we need measurements to get a better estimation of the Sky Brightness using sat images. But, we do not want to wait until you can start checking your self what are our preliminary predictions. So, we have a Beta version of an app to check what would be the Skybightnees.
Thanks to @googleearth #GoogleEarthEngine you can check the sky brightness of your location. pmisson.users.earthengine.app/view/trends
But you have to consider some limitations. This VIIRS images do not have colour, so if the location has turned to White LEDs, this cannot be reliable. We did explained a lot on this here: academic.oup.com/mnras/article/… and here advances.sciencemag.org/content/3/11/e…
The ground reflection correction still a complicated topic, but possible, as @USRA_Roman et. al. showed in sciencedirect.com/science/articl…
All these also have other implications. Like my colleagues, Miro and @salvabara published recently here: academic.oup.com/mnrasl/article… We can use this data to characterize the physical properties of the aerosols (Aka. Air pollution, sea salts, etc.)
This can mean, that you do not need to take hundreds or thousands of SQM measurements to create a @IDADarkSky or @FundStarlight protected area as my friends @SusanaMaln1 and @AstroAndalus does. They only will need a few ones and use the VIIRS image to scale them.
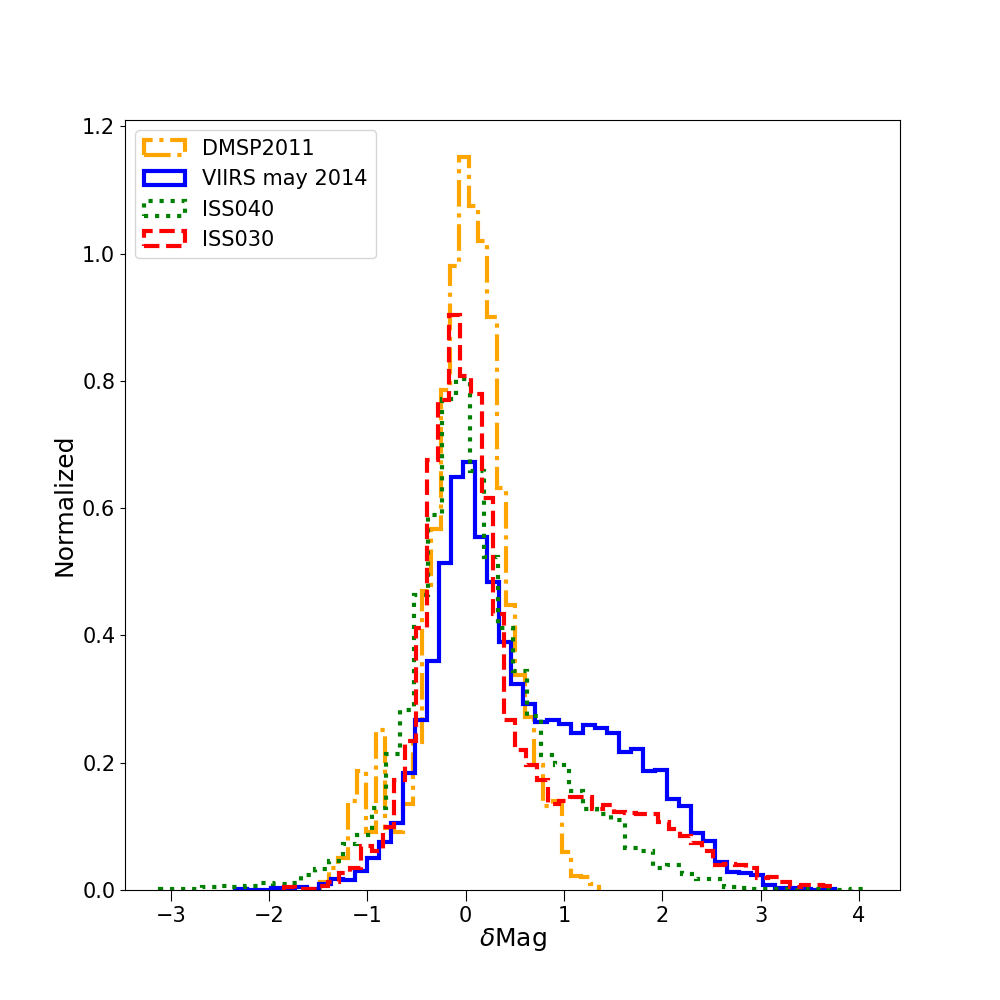
A limitation that we also have, is that the data inside cities are not reliable. Because that is NOT diffuse light. That is direct light. Although, maybe in some cases, we could use a different relationship for inside cities. We can see two things here.

One relationship the left for the diffuse light, and maybe another on the right for direct lights.
We see that there is on all sats always these two components.

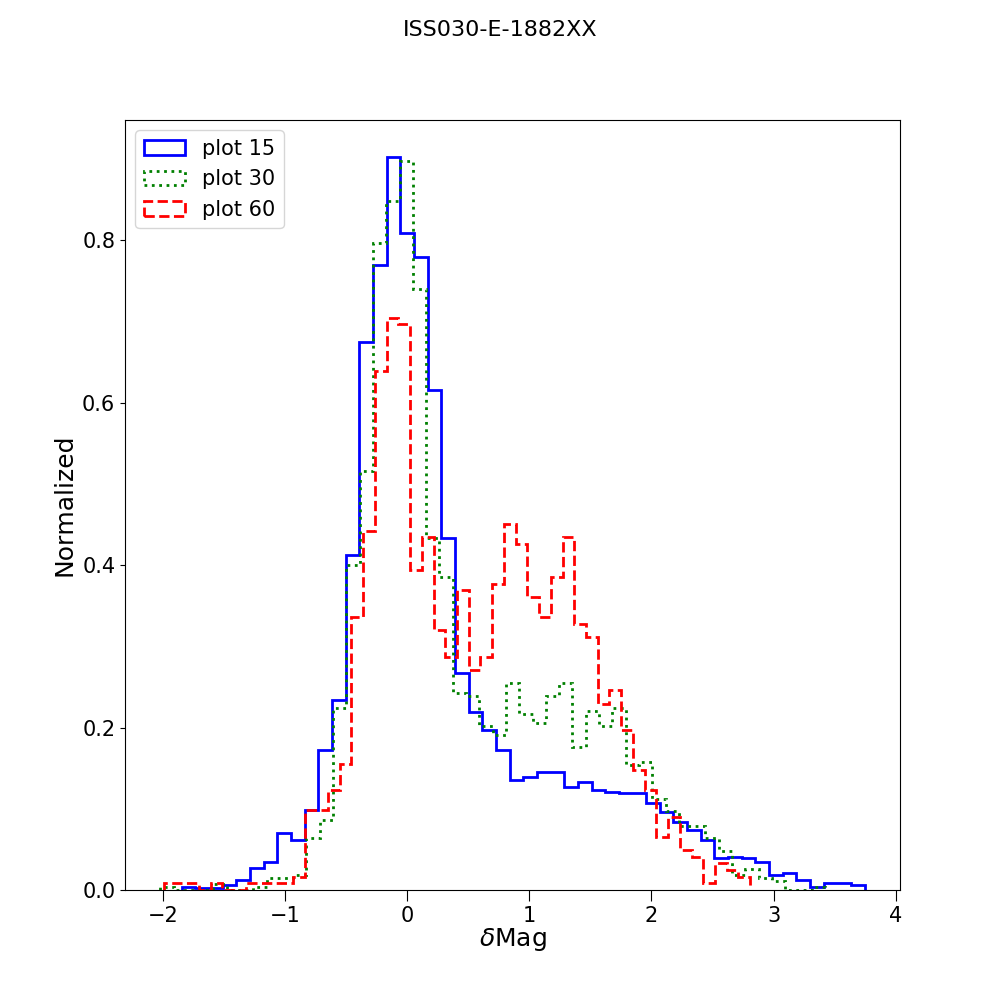
Except for the DMSP that the PSF is so big that the two effects are indistinguishable. That is why my friend @skyglowberlin was right. But we can see how if we reduce artificially the resolution (for example on an ISS image) we get similar results. The two relationships merge.
Penultimate thing I want to say about this macro thread.
If you want to improve and support this kind of research you can do it by helping us on several citizen science programs like @cities4tnight lostatnight.org @GLOBEatNight vigilantesdelanoche.es play.google.com/store/apps/det…
Ask your favourite Institution to release the SQM data openly.
Last but not least. Thanks to @eogatpayne all @esa @NASA @csa_asc @JAXA_en @roscosmos @ISS_Research for their images. To the volunteers of @cities4tnight and all the colleagues that have help on this research as @FabioFalchi9 and so many other.
Unroll @threadreaderapp