My Authors
Read all threads
NEW:

Over a third - 36% of care homes in England, 5,546 out of 15,514 have now reported an acute respiratory outbreak of COVID-19 in past two months.

47% of care homes in North East. 42% in London. 41% in North West.
NB - this is the same data - on outbreaks, not deaths, that I’ve been following on this long thread since early April... (below)

2 issues...

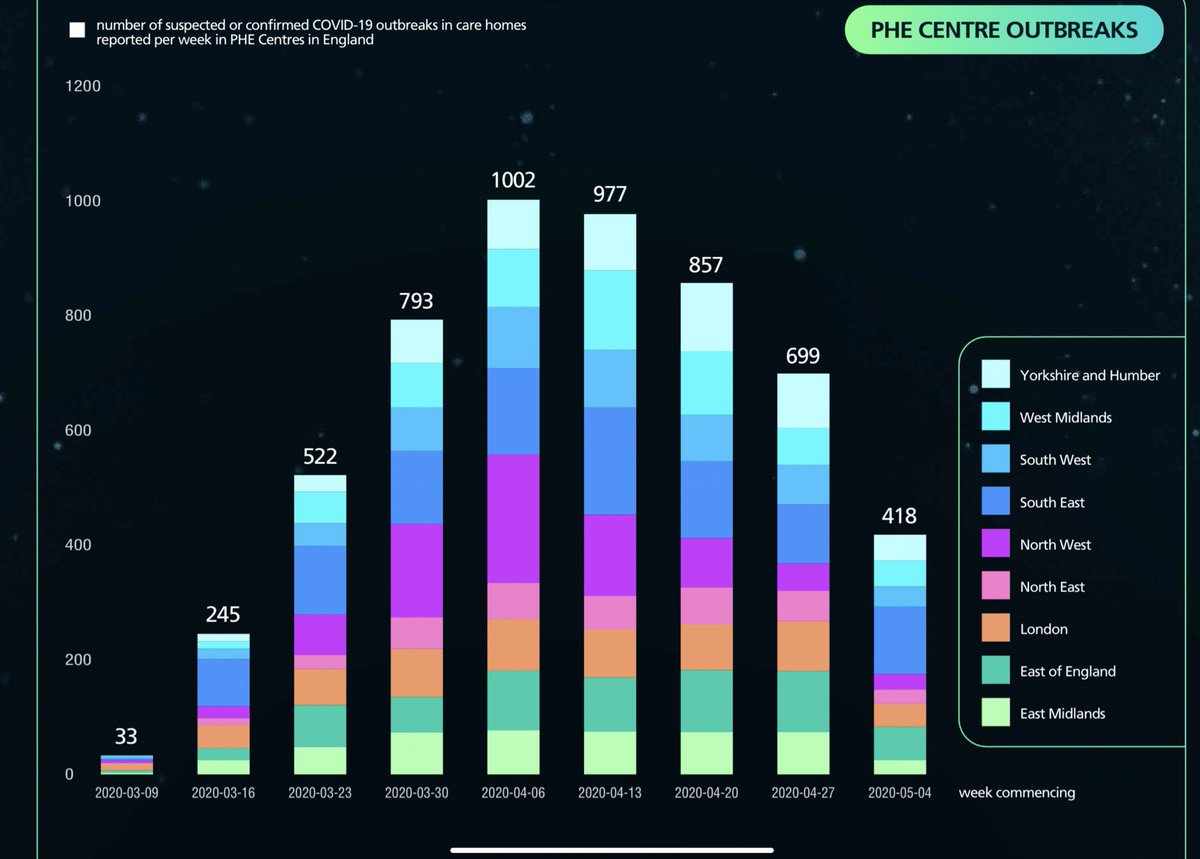
1. Number of outbreaks peaked. But how are hundreds of care homes (418) reporting new outbreaks even last week?

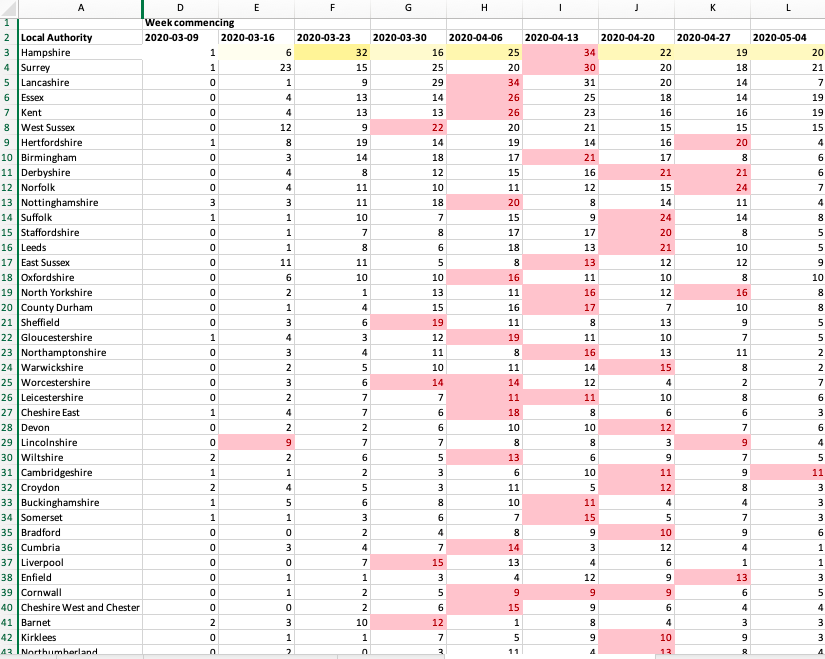
The data is broken down by week - which shows fewer infections than a month ago, but still plenty of care homes newly reporting outbreaks just last week... mainly in shires...
Actually many council areas with highest proportion of infection, now returning zero - so this shows how the infection has spread across the country’s care homes, & still does.

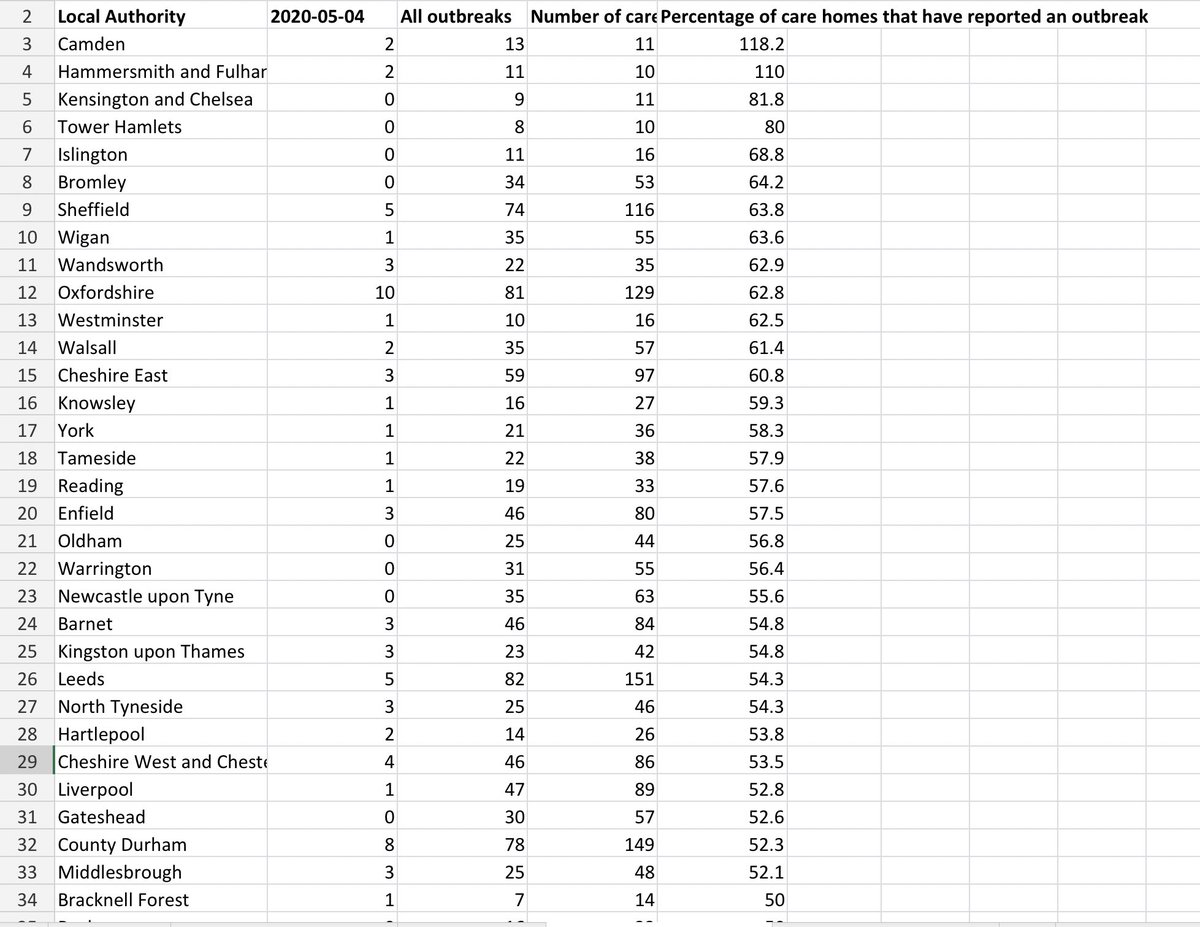
percentage affected ranges from just 16% in Torbay and Devon to over 100% in Hammersmith & Camden...
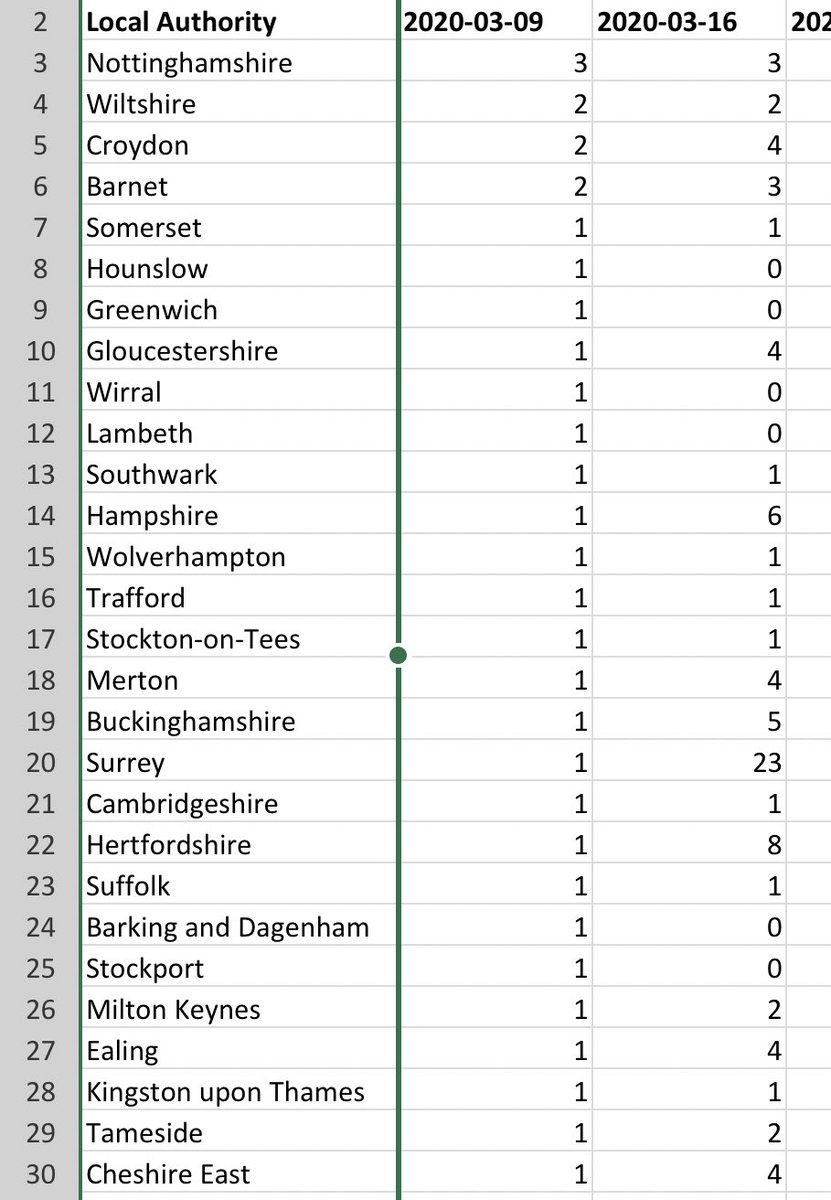
And then secondly, it gives a good picture of where the outbreaks in care homes began... in early March, where care homes do appear to be notifying a large jump in the number of outbreaks...
One of many troubling things here is that even 5-6 weeks after lockdown starts, beginning of May average of 100 new care home outbreaks per day reported in England, now down a bit to 70. At peak in April 140 new outbreaks a day.
..but the UK wide version of this chart shows also shows that in week 10 at beginning of March, all cause care home acute outbreaks start going up, then they are well above trend in the second week, and then they rise to never before seen levels and over 1000 in a week after that
Mystery to me why the data (which is meant to track flu weekly but was good heads up on Covid care home crisis evidently occurring in Italy, Spain) at precise moment spike starts is not produced normally. Became fortnightly instead “while flu activity low”... missed 1st spike up
Care homes were still sending their notification of outbreak forms to the Government, so the information would still be there. It’s just at a crucial time, it wasn’t being published in as timely a fashion as normal...
Now though, the data is v good and published by week, by region, by council - really surprised eg local politicians aren’t across the local figures of what is happening here and how it has progressed - here it is - what are you finding in your area?

gov.uk/government/sta…
Blue line here is 2019 care home deaths by day (2019)...

Blue bars are deaths confirmed as including Covid-19 in care homes...

Yellow bar is other causes...

— peak in care homes markedly later than hospitals (9-10 days)
— Drop is mostly from other causes of death, not Covid
So Tom’s piece below says that R-has gone up despite there being less infection generally, because the greater proportion of remaining infection is in care homes...

BUT - see above still hundreds new care home outbreaks reported in latest week’s figures

Eg 5546 care homes in England alone reported outbreaks to CQC in past 2 months, over thousand in past fortnight..

So policy will be to quarantine every single visitor to UK to prevent a new source of infection...

But what proportion of 5,546 no longer have outbreaks? Biosecure?
Ie hospitals shd be quite biosecure, and only a few hundred of them.

But thousands of care homes spread around UK? Eg public data alone show that in latest week data available (4-11 May) 115 out of 145 English upper tier council areas reported at least one new care home outbreak
Also here is a measure of the extent of testing in care homes...

Between 4th-11th May 468 care homes reported acute respiratory outbreaks to PHE - (normal number in May 5-10)... how many confirmed with testing: 176, just over a third.
Number 10 announced this morning that the above number is up to 5,889 of 15k English care homes reporting a coronavirus outbreak to PHE, or 38% of them...
some reports of new recorded outbreaks in care homes - interesting curiosity in PHE data last Thursday - 2 boroughs reported percentage of care homes infected had gone above 100% - ie some care homes had reported more than one outbreak - Camden (13/11)/ Hammersmith (11/10)
All of those boroughs though have very few actual homes... in any event these are the council areas where more than half of care homes have reported an outbreak...
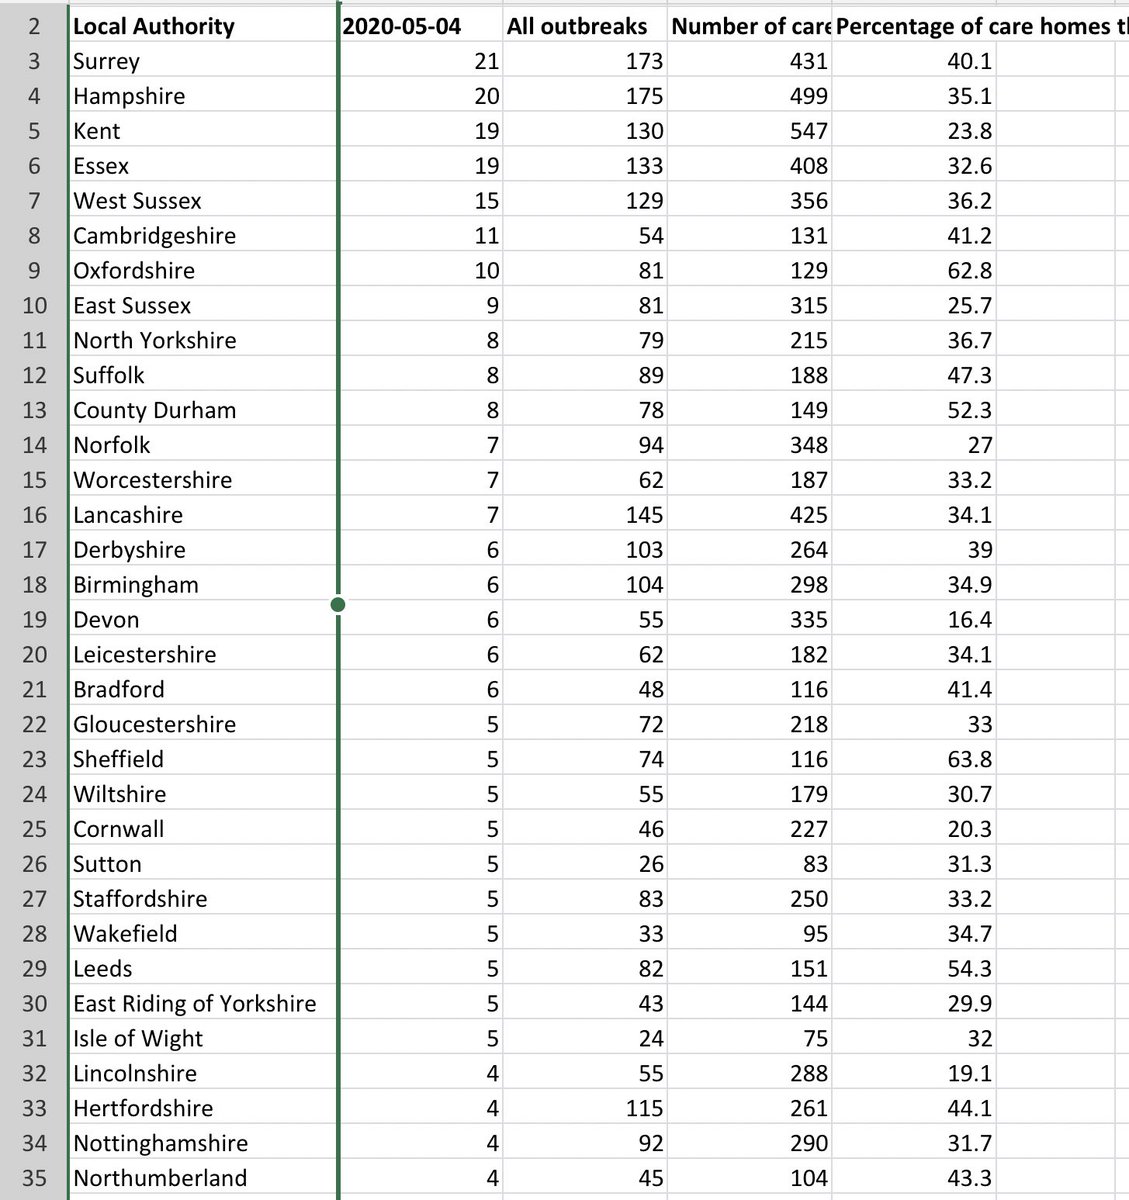
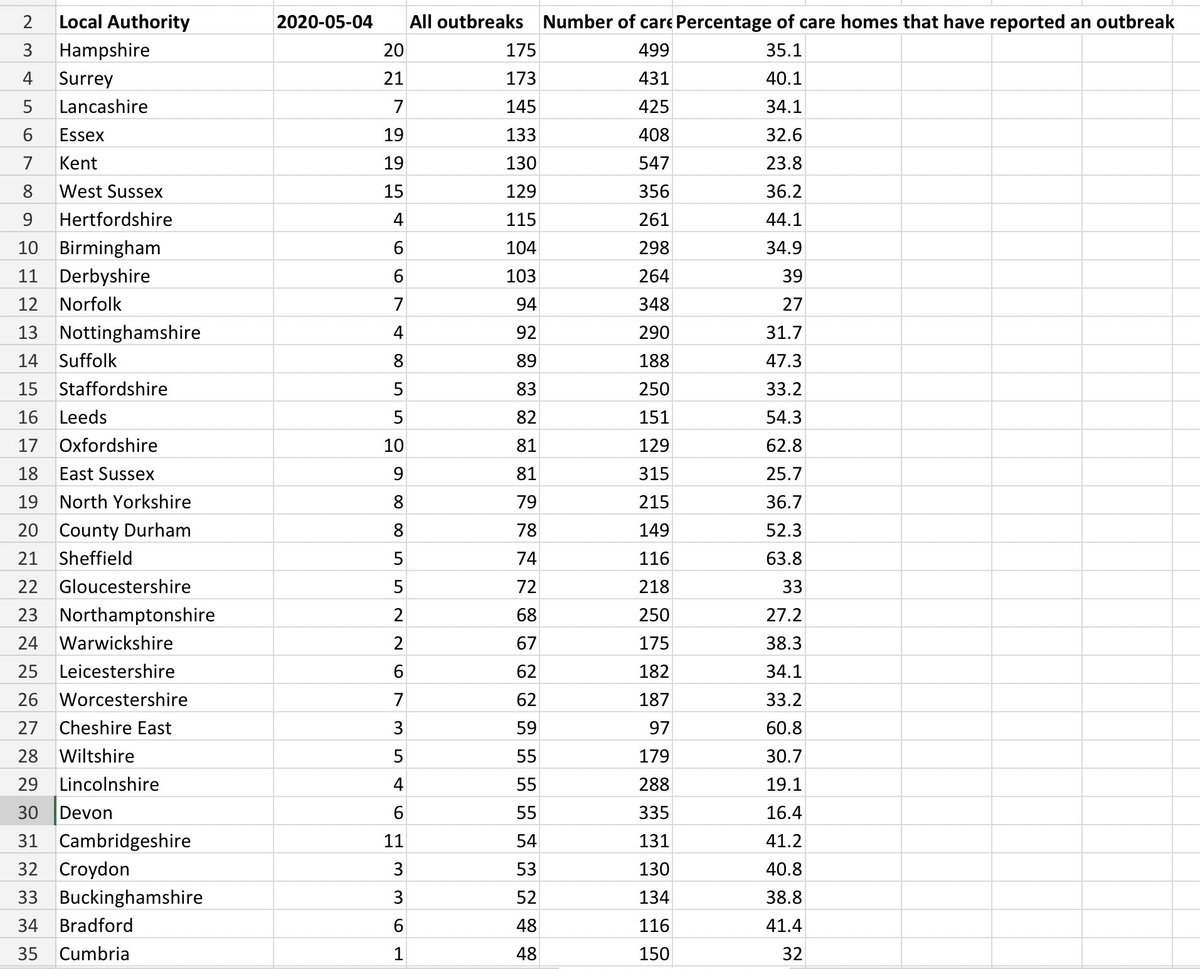
Same data ranked by actual number of care home outbreaks...

Hertfordshire, Suffolk, Leeds, Oxfordshire, County Durham, Sheffield, Cheshire East have as many as 64% of care homes suggesting outbreaks, as well as that meaning several dozen actual outbreaks...
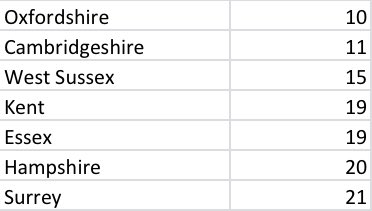
Double digit outbreaks in latest week (4th-11th May):

Hampshire, Surrey, Essex, Kent, W Sussex, Oxfordshire, Cambridgeshire
here is a very simple excel highlight of the peak in reported care home outbreaks (ie not deaths, earlier than that) by English region... notable difference between national peak in 2nd week in April, and peak in East, Yorkshire, and plateau in N East closer to end of April....
So 9 day delay to peak in care home deaths generally from hospital deaths, but also regional pattern in outbreaks - why later down East of England? Can dig deeper..council level:

peak in latest week: Cambridgeshire & Sutton
week before: Herts, Norfolk, Derbys, Lincolns, Southend
And by lower tier council... v different patterns around the country at this level. Bulk of peak in early April ... but over 40 councils had peak or joint peak of reported outbreaks in latest week, over 70 in latest two weeks

eg Tendring, Chichester, Maidstone, Fenland, Woking
New: ONS data out this morning show 50% more “excess deaths” in care homes (22k) than hospitals (15k) and the excess deaths in care homes overtook that in hospitals since mid April. Excess deaths in hospitals now negative - ie NHS protected, but care home ones still above 2k...
Orange is hospital excess deaths by week, grey care home excess deaths by week ... 👆🏽
Missing some Tweet in this thread? You can try to force a refresh.

Enjoying this thread?

Keep Current with Faisal Islam

Profile picture

Stay in touch and get notified when new unrolls are available from this author!

Read all threads

This Thread may be Removed Anytime!

Twitter may remove this content at anytime, convert it as a PDF, save and print for later use!

Try unrolling a thread yourself!

how to unroll video

1) Follow Thread Reader App on Twitter so you can easily mention us!

2) Go to a Twitter thread (series of Tweets by the same owner) and mention us with a keyword "unroll" @threadreaderapp unroll

You can practice here first or read more on our help page!

Follow Us on Twitter!

Did Thread Reader help you today?

Support us! We are indie developers!


This site is made by just two indie developers on a laptop doing marketing, support and development! Read more about the story.

Become a Premium Member ($3.00/month or $30.00/year) and get exclusive features!

Become Premium

Too expensive? Make a small donation by buying us coffee ($5) or help with server cost ($10)

Donate via Paypal Become our Patreon

Thank you for your support!