
US Coronavirus Update, Two Days at Once
Wednesday, May 13, 2020 & Thursday, May 14, 2020
~ Trending calmer
Fatalities first, 2-day edition
• Deaths, last 24 hours, 5/14: 1,855
• Deaths, prior 24 hours, 5/13: 1,641
--> 7 days without deaths over 2,000 in 24 hours
Wednesday, May 13, 2020 & Thursday, May 14, 2020
~ Trending calmer
Fatalities first, 2-day edition
• Deaths, last 24 hours, 5/14: 1,855
• Deaths, prior 24 hours, 5/13: 1,641
--> 7 days without deaths over 2,000 in 24 hours
2/ The drop in nationwide deaths below 2,000 a day now seems significant.
There has not been a 7-day stretch below 2,000 deaths a day since April 6.
See the graph below (from @washingtonpost).
And before April 6, there had never been a day of 2,000 deaths.
There has not been a 7-day stretch below 2,000 deaths a day since April 6.
See the graph below (from @washingtonpost).
And before April 6, there had never been a day of 2,000 deaths.
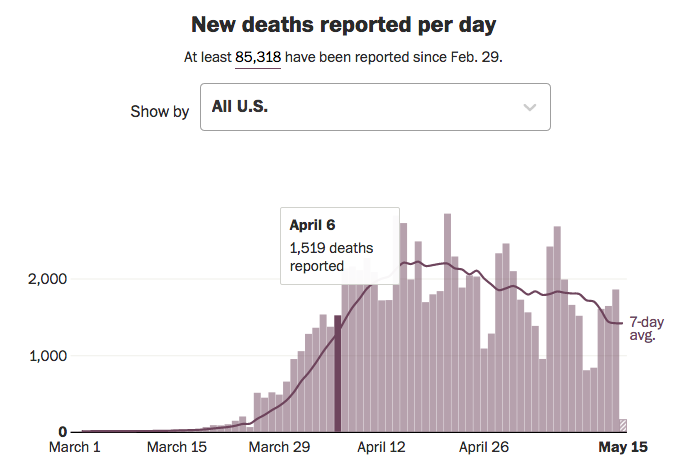
3/ Reminder of this stretch of deaths below 2,000 a day — just so we don't get too numb to it:
Thu: 1,855
Wed: 1,641
Tue: 1,603
Mon: 836
Sun: 803
Sat: 1,513
Fri: 1,654
Average: 1,415 deaths a day
Thu: 1,855
Wed: 1,641
Tue: 1,603
Mon: 836
Sun: 803
Sat: 1,513
Fri: 1,654
Average: 1,415 deaths a day
4/ Eight weeks ago, covid-19 didn't rank in the top 10 causes of death in US.
Since Apr 7, it has been the #1 cause of death in the US.
• Covid-19 killed 2,079 in US a day (4/7 to 5/7)
• Heart disease kills 1,774 in US a day (est)
• Cancer kills 1,641 in US a day (est)
Since Apr 7, it has been the #1 cause of death in the US.
• Covid-19 killed 2,079 in US a day (4/7 to 5/7)
• Heart disease kills 1,774 in US a day (est)
• Cancer kills 1,641 in US a day (est)
5/ Vivid animated graphic of this development below (via @DrDanilychevMD).
Important note on the data:
Heart disease & cancer deaths are calculated based on data + modeling. The covid-19 deaths are actual confirmed deaths.
public.flourish.studio/visualisation/…
Important note on the data:
Heart disease & cancer deaths are calculated based on data + modeling. The covid-19 deaths are actual confirmed deaths.
public.flourish.studio/visualisation/…
6/ The daily-death comparisons are really order of magnitude. Coronavirus is having a huge impact.
Second reminder: People who have cancer or coronary artery disease aren't about to 'die anyway' — any more than anyone else is.
Second reminder: People who have cancer or coronary artery disease aren't about to 'die anyway' — any more than anyone else is.
7/ If you live to be 75 in the US, your life expectancy is 12 years.
If you live to be 80 in the US, your life expectancy is 9 years.
Even Americans in the 'over 70' category are losing a decade of life.
And yes: Life expectancy tables take account of 'underlying conditions.'
If you live to be 80 in the US, your life expectancy is 9 years.
Even Americans in the 'over 70' category are losing a decade of life.
And yes: Life expectancy tables take account of 'underlying conditions.'
8/ The last 7 days have averaged 1,415 deaths a day—still 59 deaths an hour.
Almost 1 death a minute, every minute for the week.
If those 1,415 people only lose an average of 10 years, that's 14,150 years of productive life lost each day.
Still: Better than 2,000 deaths a day.
Almost 1 death a minute, every minute for the week.
If those 1,415 people only lose an average of 10 years, that's 14,150 years of productive life lost each day.
Still: Better than 2,000 deaths a day.
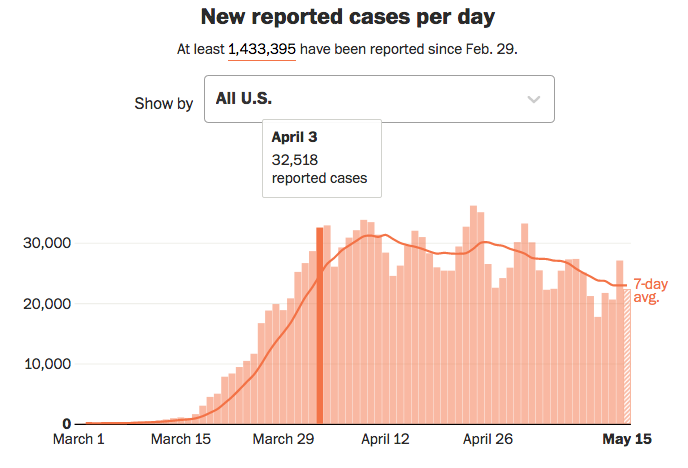
9/ Now new cases, 2-days-at-once version.
New US confirmed cases:
• Cases, last 24 hours, 5/14: 26,972
• Cases, prior 24 hours, 5/13: 20,592
--> 7 days without new cases over 30,000 in 24 hours
New US confirmed cases:
• Cases, last 24 hours, 5/14: 26,972
• Cases, prior 24 hours, 5/13: 20,592
--> 7 days without new cases over 30,000 in 24 hours
10/ The US new-confirmed-cases chart from @washingtonpost is below.
This 7-day stretch without 1 day over 30,000 cases is significant, just the way 7 days without deaths over 2,000 in a day is.
First time we've had 7 days in a row without topping 30,000 new cases since April 3.
This 7-day stretch without 1 day over 30,000 cases is significant, just the way 7 days without deaths over 2,000 in a day is.
First time we've had 7 days in a row without topping 30,000 new cases since April 3.
11/ As we noted earlier this week, we're in the 4th week in which the highest day or two in the week is lower than the previous week's highest days.
And the typical day this week is lower than the typical day last week.
Good trend, good news.
And the typical day this week is lower than the typical day last week.
Good trend, good news.
12/ New York is helping tremendously.
See the fantastic drop in daily cases in the graph below. But also notice the scale: NY state alone still adding 2,000 cases a day. No. 1 or No. 2 in the country each day. But better than adding 10,000 cases a day.
See the fantastic drop in daily cases in the graph below. But also notice the scale: NY state alone still adding 2,000 cases a day. No. 1 or No. 2 in the country each day. But better than adding 10,000 cases a day.

13/ New Jersey is also helping.
See the drop in daily cases in the graph below. Not as dramatic in raw numbers as New York state, but still 2,000 fewer new cases a day than mid-April.
See the drop in daily cases in the graph below. Not as dramatic in raw numbers as New York state, but still 2,000 fewer new cases a day than mid-April.

14/ The only question for both new cases & deaths on a downward slope:
Can the trend survive reopening?
Experience so far is mixed.
Georgia, which opened Fri, Apr 24, amid attention & controversy, has not seen any growth in new cases.
Today: 3 weeks. Spike could have started.
Can the trend survive reopening?
Experience so far is mixed.
Georgia, which opened Fri, Apr 24, amid attention & controversy, has not seen any growth in new cases.
Today: 3 weeks. Spike could have started.

15/ Georgia residents are clearly being careful.
Georgia is still averaging 600 new cases a day. That number isn't going down, but it isn't rising.
Plenty of viral spread there.
Georgia is still averaging 600 new cases a day. That number isn't going down, but it isn't rising.
Plenty of viral spread there.
16/ Georgia is a success so far.
It is one of those cases where 'no spike' does not mean things are getting safer.
'Success' doesn't mean you should loosen your guard. It just means, what everyone in Georgia is doing right now is working okay, for the moment.
It is one of those cases where 'no spike' does not mean things are getting safer.
'Success' doesn't mean you should loosen your guard. It just means, what everyone in Georgia is doing right now is working okay, for the moment.
17/ Now, Texas.
TX is the opposite case.
Cases in TX have done nothing but rise since it loosened stay-at-home rules on May 1.
This weekend is 1st moment when the looser rules could magnify those increases.
Highest day yet for new cases in TX was: Yesterday.
Graph below.
TX is the opposite case.
Cases in TX have done nothing but rise since it loosened stay-at-home rules on May 1.
This weekend is 1st moment when the looser rules could magnify those increases.
Highest day yet for new cases in TX was: Yesterday.
Graph below.

18/ When Texas started loosening stay-at-home rules on May 1, average number of new cases daily was 900 — and new cases had been rising on average for 7 days.
Today, 2 weeks later, the average number of new cases daily in Texas is 1,200 — and it has risen steadily for 14 days.
Today, 2 weeks later, the average number of new cases daily in Texas is 1,200 — and it has risen steadily for 14 days.
19/ Texas did not have control of the spread of coronavirus on May 1, when it started loosening rules.
Since then, the number of new cases daily has jumped 33%.
Texas has less control of the coronavirus today than when re-opening started.
Graph below again for ease of use.
Since then, the number of new cases daily has jumped 33%.
Texas has less control of the coronavirus today than when re-opening started.
Graph below again for ease of use.

20/ Deaths in Texas are also an unnerving & negative story.
Graph below.
Highest 2 days for deaths in 24 hours: yesterday & today.
• Total deaths in Texas to date: 1,272 (since Mar 16)
• Total deaths in Texas, last 48 hours: 114
Graph below.
Highest 2 days for deaths in 24 hours: yesterday & today.
• Total deaths in Texas to date: 1,272 (since Mar 16)
• Total deaths in Texas, last 48 hours: 114

21/ Texas increased its total death toll from the pandemic by almost 10 percent in the last 2 days, with the 2 deadliest days so far, going back 2 months.
And those deaths were based on new cases from 2 weeks ago—when the TX new case surge was 7 days old.
It's 21 days old now.
And those deaths were based on new cases from 2 weeks ago—when the TX new case surge was 7 days old.
It's 21 days old now.
22/ Could testing account for the 'new cases' in Texas? Is the state just finding cases by testing much more widely as it opens?
Texas did more new tests Wed & Thu of this week, in 2 days, than in the previous 5 days. And those were the highest tests-performed days ever in TX.
Texas did more new tests Wed & Thu of this week, in 2 days, than in the previous 5 days. And those were the highest tests-performed days ever in TX.
23/ And Texas had high 'new case' numbers Wed & Thu.
But tests have been steady the previous 3 weeks, and new cases rose steadily.
And the death toll tells the same story. Deaths are unrelated to testing, and they are rising steadily.
But tests have been steady the previous 3 weeks, and new cases rose steadily.
And the death toll tells the same story. Deaths are unrelated to testing, and they are rising steadily.
24/ Are there any states of size that have re-opened where cases have gone down since re-opening?
Trend of averages cases in some re-opened states:
AZ: up
OH: up
KS: down a bit
NV: down a bit
CO: down
MO: down
SC: unchanged
Graphs for MO (6m ppl) & AZ (7m ppl) below.
Trend of averages cases in some re-opened states:
AZ: up
OH: up
KS: down a bit
NV: down a bit
CO: down
MO: down
SC: unchanged
Graphs for MO (6m ppl) & AZ (7m ppl) below.


25/ Now test data.
• New tests performed
>> Thu, May 14: 366,944
>> Wed, May 13: 324,426
• Not 1 day of testing below 200,000 tests a day since April 27.
• Not 1 day of testing below 300,000 since Sunday.
• New tests performed
>> Thu, May 14: 366,944
>> Wed, May 13: 324,426
• Not 1 day of testing below 200,000 tests a day since April 27.
• Not 1 day of testing below 300,000 since Sunday.
26/ Testing seems to have reached a new plateau:
From 150,000 to 200,000. Then to 250,000. Now 4 days in a row over 300,000.
We will need many times that a day for an active summer & back-to-school season.
But rising significantly. That's good.
More tomorrow.
#
From 150,000 to 200,000. Then to 250,000. Now 4 days in a row over 300,000.
We will need many times that a day for an active summer & back-to-school season.
But rising significantly. That's good.
More tomorrow.
#

