
Let me take us all on a magical walk through the @Surgisphere "revision" and explanation given to the @lancet. Not everything looks like what it seems. I would hope @richardhorton1 would have pushed for better explanations.
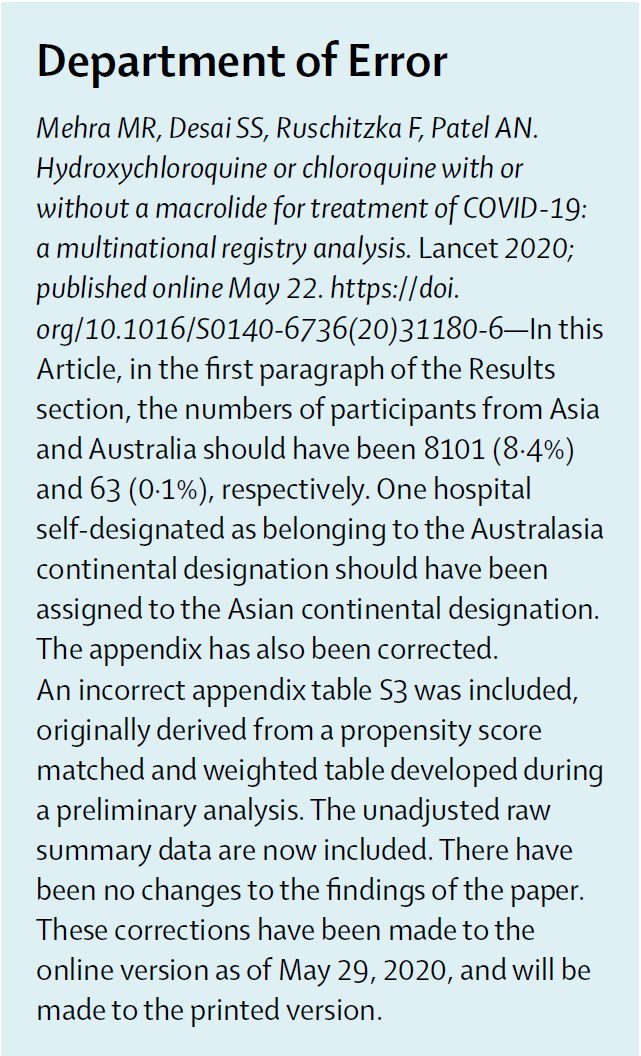
Let us start with the correction statement. One hospital from Australia should have been in Asia. Not sure why a hospital a company sold a product to would need to self-identify for a cloud-based data analytics platform: 
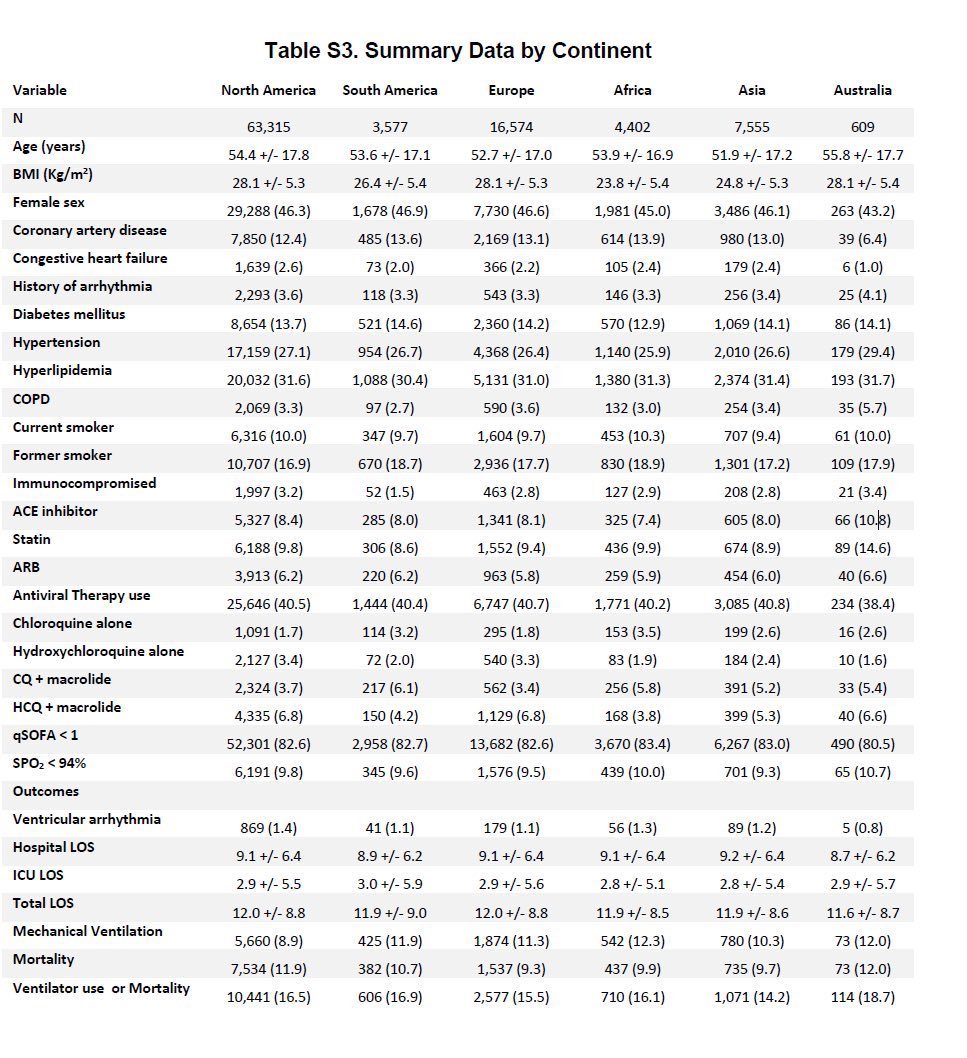
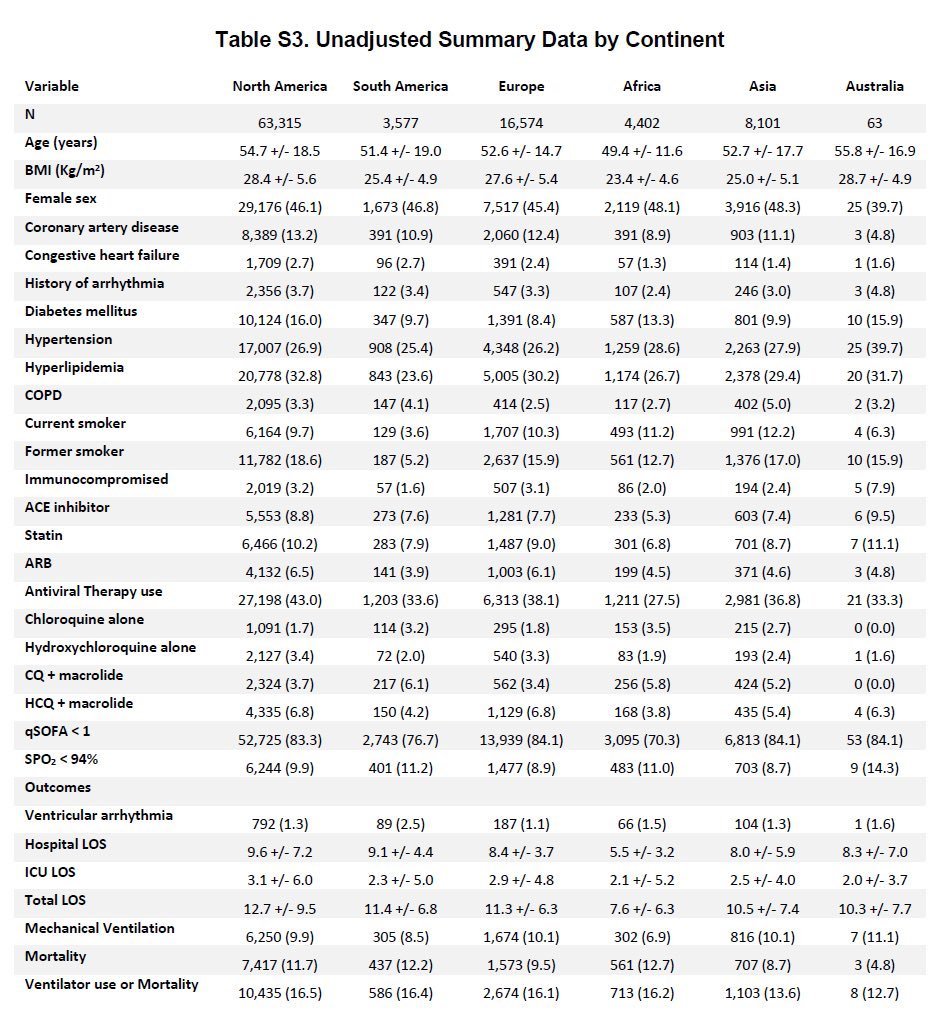
They also notify us that the original table S3 was corrected and the lack of variation was because they presented "propensity matched and weighted" tables rather than raw estimates.
Here are these marvelous tables original and corrected that many on @Twitter first identified as problematic.
Now it's probably best to save those images and keep them handy to walk with me through the changes.
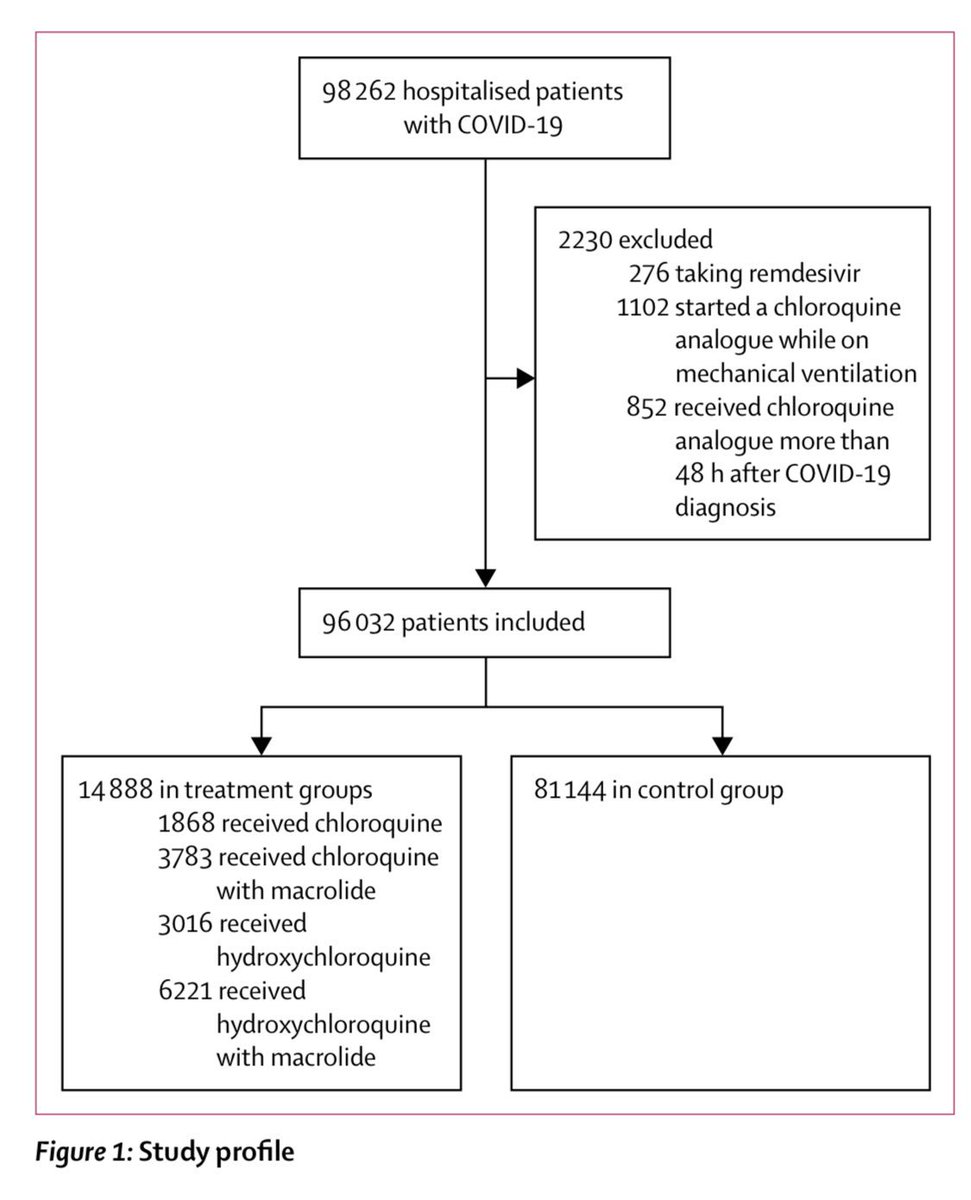
Next, I'd like to include the flow diagram that mirrors the study "design."
Next, I'd like to include the flow diagram that mirrors the study "design."
Let's keep track of some numbers. This is a "propensity matched" analysis. That means a two-step process. First calculate the propensity to receive treatment vs. not. Next do the analysis for matched cohort (FYI matching is inefficient)
They seem to claim they did 1:1 matching with calipers of 0.001 for 4 treatment groups, but the study manuscript does not report anything about matched group characteristics only for the entire "control group"
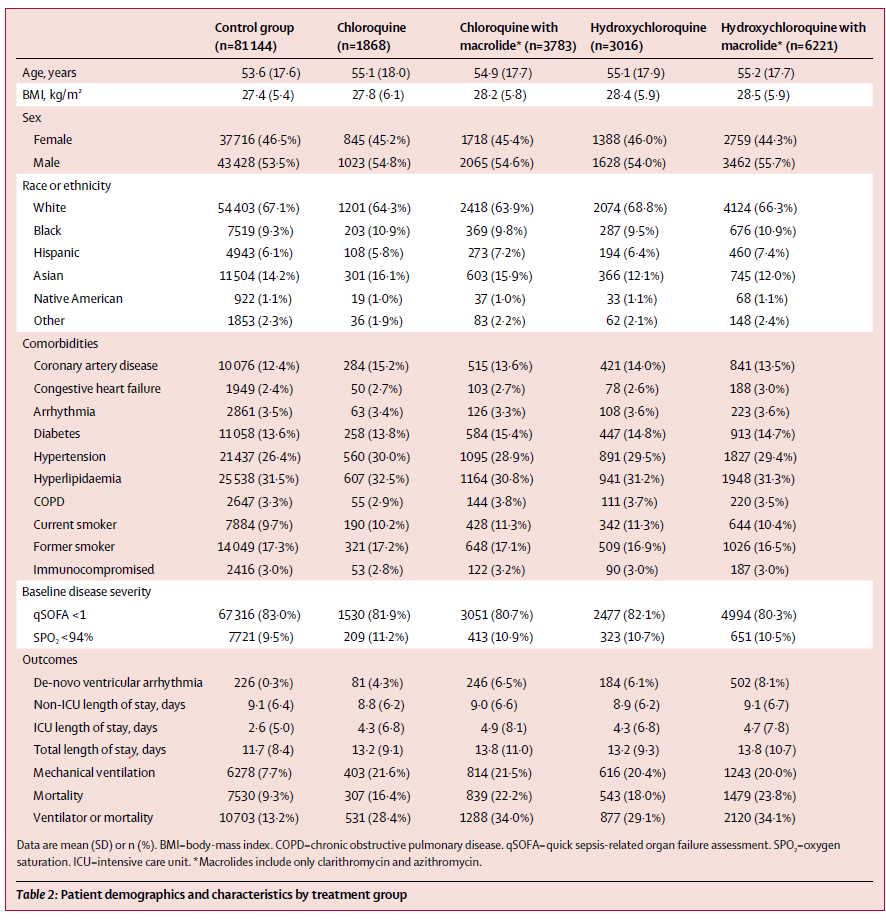
Now let's go back and revisit table S3. Look at the first row. The numbers add up. Final study population in the flow diagram is 96,032 and it's the same for both the wrong and corrected S3 tables.
However, let's revisit the "explanation" for the error. They claim that the original table that lacked variation was because they used propensity matched characteristics. Well which characteristics did they because there are 4 matched cohorts per their methods.

The original table S3 looks like it was made in @msexcel . To make this coding error, one would have to ask for these characteristics after matching for only one treatment group or control. Not both. Also by continent which isn't typical.
You would then have to take a % and multiple it by row 1 actively. This not a simple coding mistake. You have to be very confused to produce the original S3 if we accept their explanation as true. There is no statistical workflow that makes sense for me to generate this error.
I don't use R or SPSS, but I can think of no explanation for how one would even generate the original S3 with a few coding errors.
Next, despite their being more variation the distribution of characteristics still seems odd across continents. CAD and DM rates are usually not so close in prevalence, especially for North America. Vent rates and mortality still similar. Overall, odd and unlike other studies.
So who did this analysis? The CEO of @Surgisphere

Dr. Sapan Desai is a self-described full-time clinical Vascular Surgeon. He has a few companies under his name @surgisphere @QuartzClinical . His PhD is in Anatomy and Cell biology and dissertation was on the inner ear physiology. linkedin.com/in/sapansdesai/
I am intrigued by how one man seems to have run a company providing services to 671 for some sort of data analytics with very little evidence of any IT infrastructure on the website or Linkedin. The address for which seems to be his home.
He also cleaned data from multiple countries with language differences coding standards to get such a detailed analysis.
The @nejm and @TheLancet need to do their due diligence with identifying the data source and hospitals involved with the Surgical Outcomes Collaborative. I suspect it may not even been a real EHR product.
Even if it is a real product, there's no way hospitals were aware of data being siphoned off. @MRMehraMD needs to come clean with how he was approached about this study and how much involvement he had with the supervision.
You can see the type of content that's gobbledygook on their website here:
There was serious harm performed by this study with public dissemination and disruption of randomized trials during the midst of the worst pandemic of many of our lifetimes.
Ok I will add some clarification to the statistical steps that need to happen to get the original explanation for the error in table S3 that should less variation in characteristics.
First they did 4 propensity matching analyses by treatment. They would have had first do a matched analysis for one treatment. Unclear what kind of cluster adjustments if any.
Next, they would have to request output of the prevalence of risk factors for the propensity by continent. That seems unlikely to provide an output with such balance even if using only matched cohorts.
The matched cohort population sizes would have been much smaller. They would then had to have multipled each proportion by the total population by row and column in Excel. Actually, that’s probably precisely what they did, because no stats program gives you such an output.
They would also have to be blissfully unaware that the sample sizes in their R or SPSS output was no where close to the numbers in their excel table.
Related thread:
Dug up his dissertation for anyone interested: dropbox.com/s/kk6ioakfdmvv…
Adding more:
How about machine learning that is basic HTML code:
Twitter peer review/investigations are the best:
More:
More implausibility:

