I don't know if anyone cares as much as I do, but 'Fantasy Strength of Schedule' is a subject I've written about and grappled with for about 4-5 years now
With the help of the great @beerswater, there came a breakthrough
Here's what we came up with:
[Articles out this week]
With the help of the great @beerswater, there came a breakthrough
Here's what we came up with:
[Articles out this week]
Essentially,,,
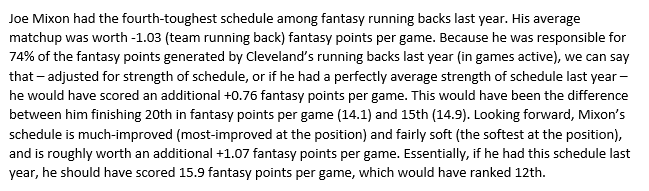
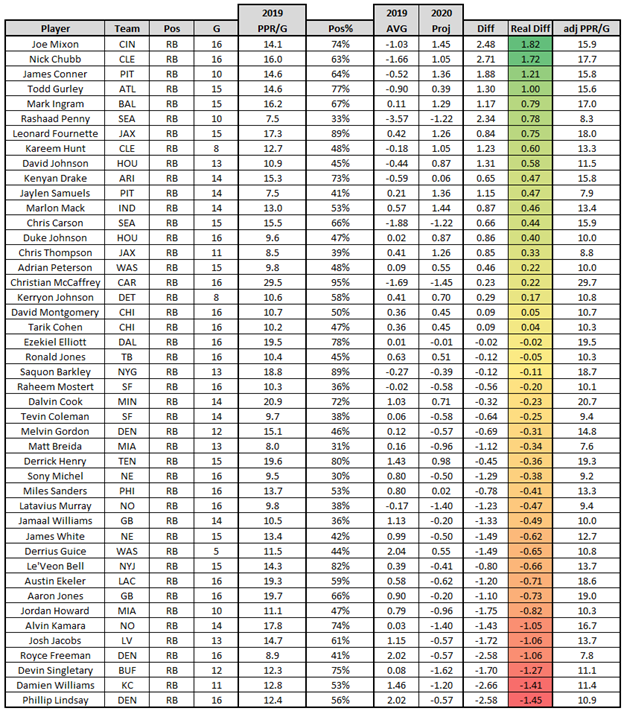
The difference between Joe Mixon’s schedule last year and his schedule this year is the difference between him finishing 20th (14.1) and 12th in fantasy points per game (15.9).
The difference between Joe Mixon’s schedule last year and his schedule this year is the difference between him finishing 20th (14.1) and 12th in fantasy points per game (15.9).
First,
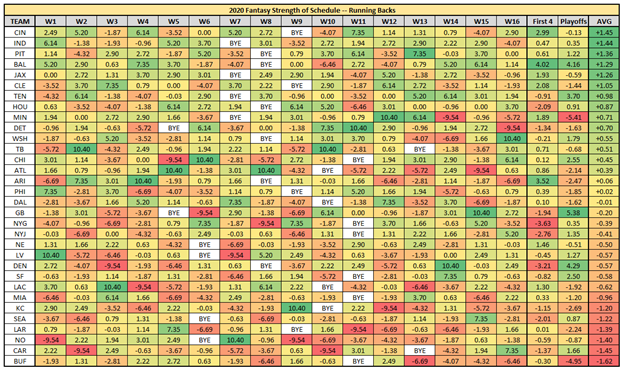
We measured the toughest / easiest fantasy matchups last year. We used the #DFBeersReport, which reflects fantasy points per game above an opponent's average.
We measured the toughest / easiest fantasy matchups last year. We used the #DFBeersReport, which reflects fantasy points per game above an opponent's average.
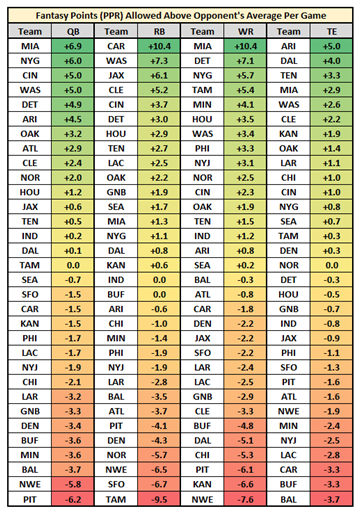
For instance, last season, opposing RBs averaged +10.4 fantasy points per game over their season-long average when facing Carolina
When facing Tampa Bay, a team's RBs (the full backfield) fell short of their season-long average by 9.5 fantasy points per game
When facing Tampa Bay, a team's RBs (the full backfield) fell short of their season-long average by 9.5 fantasy points per game
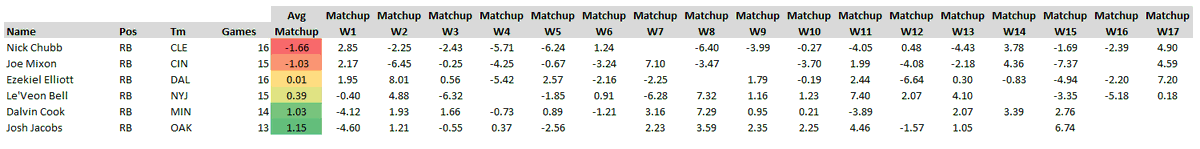
So, looking back: Joe Mixon had the fourth-toughest strength of schedule last year. Worth, on average, -1.03 fantasy points per game off his season-long average
Here's him vs. a few other RBs
Here's him vs. a few other RBs
Using these numbers, we can also project out the 2020 fantasy schedule
Cincinnati actually has the softest strength of schedule for running backs this year (worth an additional +1.45 team RB fantasy points per game)
[This will be available for download]
Cincinnati actually has the softest strength of schedule for running backs this year (worth an additional +1.45 team RB fantasy points per game)
[This will be available for download]
This can tell us:
- Best / Worst Overall Schedules (Weeks 1-16)
- Fast / Slow-Starters (Weeks 1-4)
- Best / Worst Postseason Schedules (Weeks 14-16)
But also,,,
- Best / Worst Overall Schedules (Weeks 1-16)
- Fast / Slow-Starters (Weeks 1-4)
- Best / Worst Postseason Schedules (Weeks 14-16)
But also,,,
This can also tell us who saw the biggest improvement or decline in strength of schedule. And we can quantify that difference in real terms using actual fantasy points.
The difference between Joe Mixon’s schedule last year and his schedule this year is the difference between him finishing 20th (14.1) and 12th in fantasy points per game (15.9).
Here's my math:
Here's my math: