The disparities report. Much interesting data but no recommendations? (1) assets.publishing.service.gov.uk/government/upl
Death rates increase as deprivation increases. (2)
Age adjusted death rates for confirmed COVID19 by ethnicity and gender. (3)
Cardiovascular disease, diabetes and hypertension are the commonest illnesses that increase your risk of COVID19 death

• • •

Missing some Tweet in this thread? You can try to force a refresh
 

Keep Current with Anthony Costello

Anthony Costello Profile picture

Stay in touch and get notified when new unrolls are available from this author!

Read all threads

This Thread may be Removed Anytime!

PDF

Twitter may remove this content at anytime! Save it as PDF for later use!

Try unrolling a thread yourself!

how to unroll video
  1. Follow @ThreadReaderApp to mention us!

  2. From a Twitter thread mention us with a keyword "unroll"
@threadreaderapp unroll

Practice here first or read more on our help page!

More from @globalhlthtwit

11 Oct
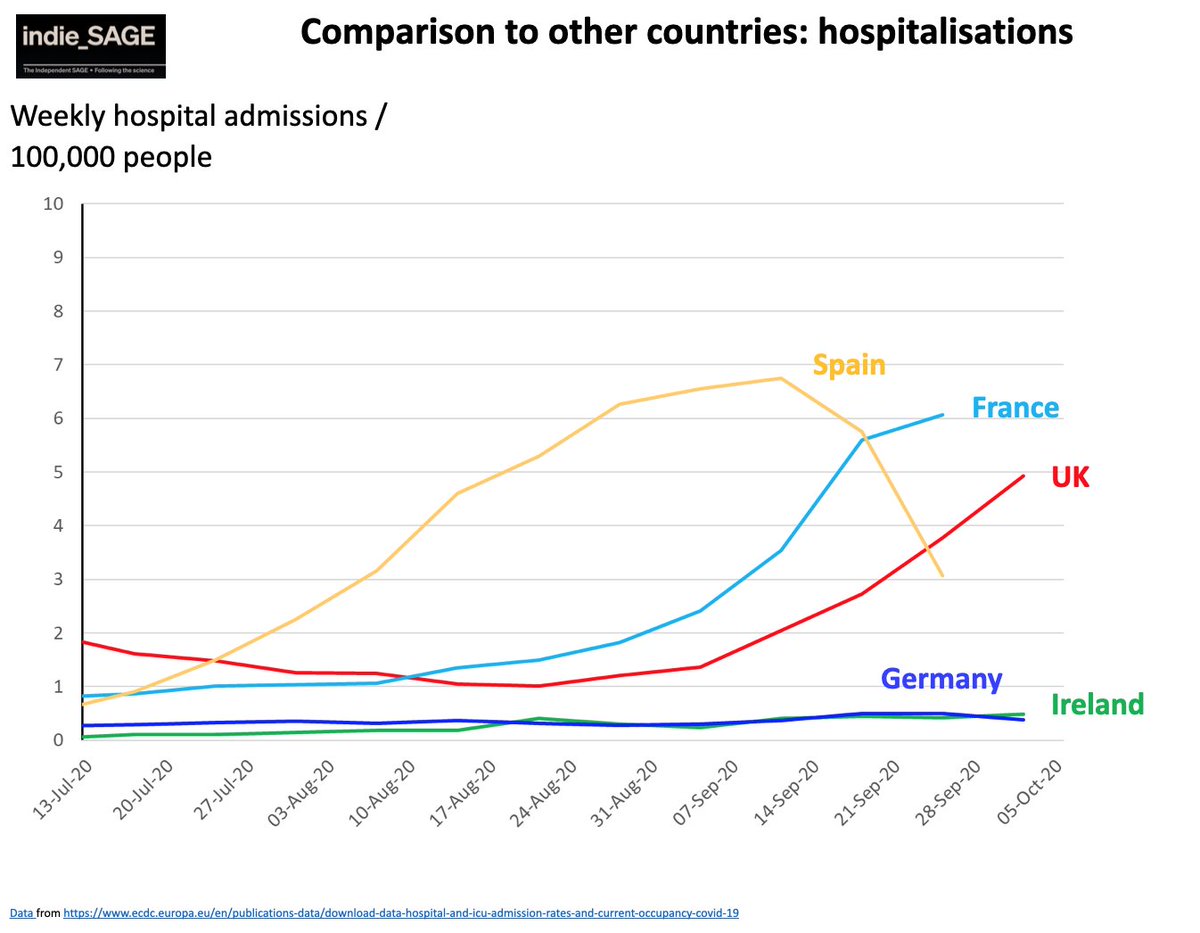
We’re in a mess. Cases, hospitalisations and deaths are all rising. It's too late for test and trace to stop it. Things will just get worse. We have FOUR options: (1) Image
Option 1. LOCAL LOCKDOWNS: politicians don't want a national lockdown, so local restrictions only. But RISKS are that cases and deaths rise, with possible exponential spread (as in March), even if death rates r lower than Mar/April because more vulnerable people will shield.(2)
Option 1 risks (cont): other countries will block travel to and from UK, NHS overload, indirect NHS casualties from other conditions will mount, many people off work, economy falters like last time. (3) Image
Read 24 tweets
7 Oct
The Barrington Declaration from the quadrangles of Yale, Stanford + Oxford: "People who are more at risk may participate if they wish, while society as a whole enjoys the protection conferred upon the vulnerable by those who have built up herd immunity." (1) Er....No.
How long does immunity last?
Will herd immunity be achieved?
What about Long Covid?
Sweden tried this with 582 deaths/million, Norway 51 deaths/million didn't.
How practical is shielding 30% of the population? No data.
What are their death projections v economic benefits?
(2)
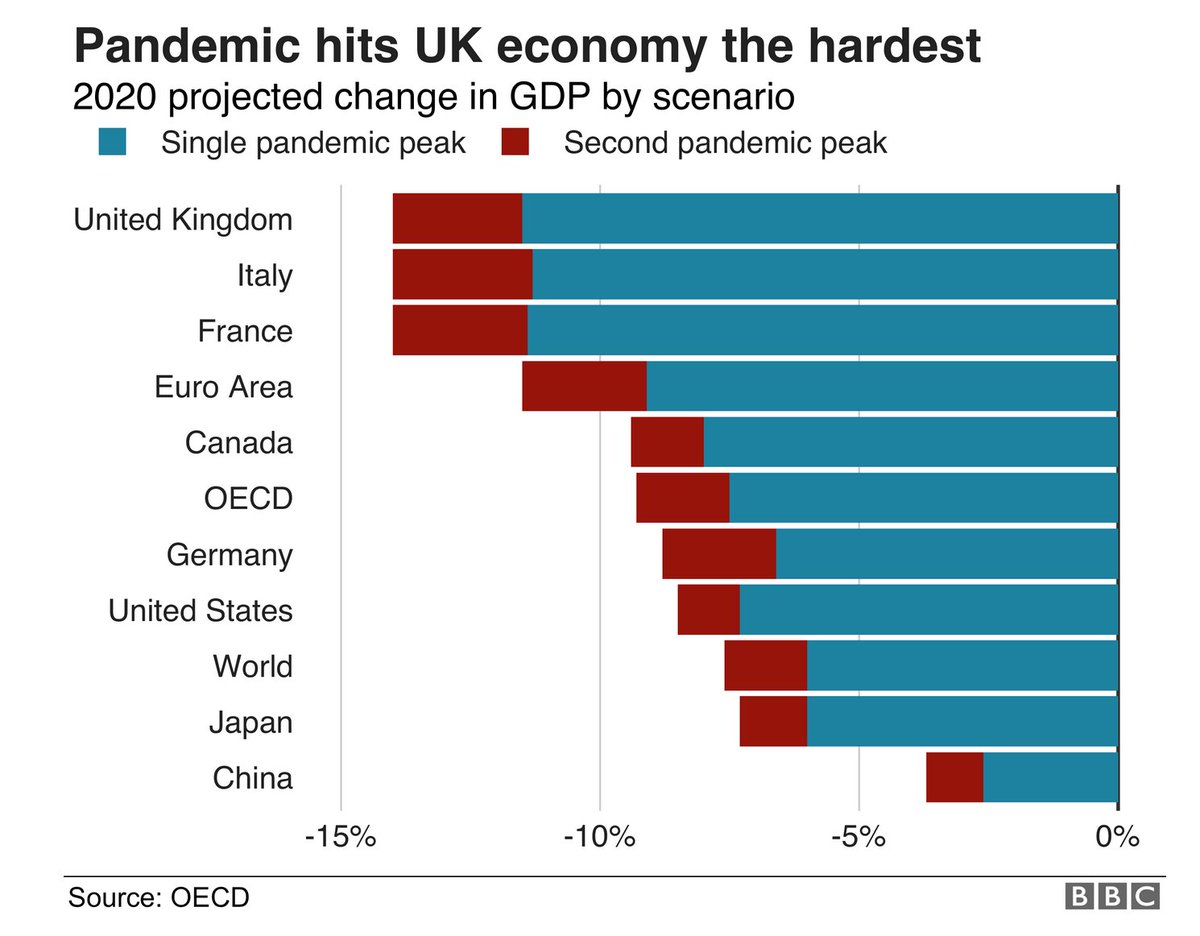
It seems odd that the countries who failed to tackle the pandemic effectively, which the Barrington people want, suffered the biggest economic hit. (3)
Read 7 tweets
7 Sep
Karl Friston's model suggests that LSHTM/Imperial/Academy of Medical Sciences projections of numbers of deaths in a second wave are way too high. But a functioning ‘find, test, trace, isolate, support programme’ will keep them even lower. (1) medrxiv.org/content/10.110… (pre-print)
Prepare now for a winter peak warned the Academy of Medical Sciences..."It estimates the number of COVID-19-related hospital deaths (excluding care homes) between September 2020 and June 2021 could be as high as 119,900." (2)
acmedsci.ac.uk/more/news/prep…
Davies, Kucharski et al from LSHTM state “We projected a median unmitigated burden of 23 million (95% prediction interval 13–30) clinical cases and 350 000 deaths (170 000–480 000) due to COVID-19 in the UK by December, 2021.” (3)
Read 15 tweets
26 Aug
Colin Mathers, former coordinator of mortality and burden of disease statistics at WHO, raises challenging issues over ownership of global health data. (1) biomedcentral.com/epdf/10.1186/s…
He asks whether it is sustainable and politically acceptable for WHO to devolve data ownership and coordination to the Gates-funded Institute of Health Metrics and Evaluation at Univ of Washington in Seattle. (2) @richardhorton1 @IlonaKickbusch @devisridhar @fgodlee
"The current (WHO) administration does not seem concerned that WHO reports are publishing inconsistent statistics from IHME and from UN Interagency Groups." (3)
Read 9 tweets
18 Jun
The test and trace data from government is highly misleading. How many people are estimated to have the virus? We dont know. How many were missed by the tests? Don't know.
And why are PHE and local authority public health doing almost EIGHT times as much contact tracing as SERCO? 25,000 call handlers tracked only 10,000 contacts in 2 weeks. That's why they are twiddling their thumbs. At our expense.
The positive lab test results graph shows 300-400 positives per day for June 4-10. That adds up to about 2500 cases. Yet they say they received 5900 cases reported to test and trace. Where did the other 3400 cases come from? Image
Read 4 tweets
3 Jun
This paper provides important information about the immune response to SARS-CoV-2. Three key findings. (1)
A. 'Circulating SARS-CoV-2-specific CD8+ and CD4+ T cells were identified in 70% and 100% of COVID-19 convalescent patients, respectively.' (2)
B. 'The M, spike, and N proteins each accounted for 11%–27% of the total CD4+ response.' This suggests vaccine candidates should not simply focus on the spike protein. (3)
Read 8 tweets

Did Thread Reader help you today?

Support us! We are indie developers!


This site is made by just two indie developers on a laptop doing marketing, support and development! Read more about the story.

Become a Premium Member ($3/month or $30/year) and get exclusive features!

Become Premium

Too expensive? Make a small donation by buying us coffee ($5) or help with server cost ($10)

Donate via Paypal Become our Patreon

Thank you for your support!

Follow Us on Twitter!