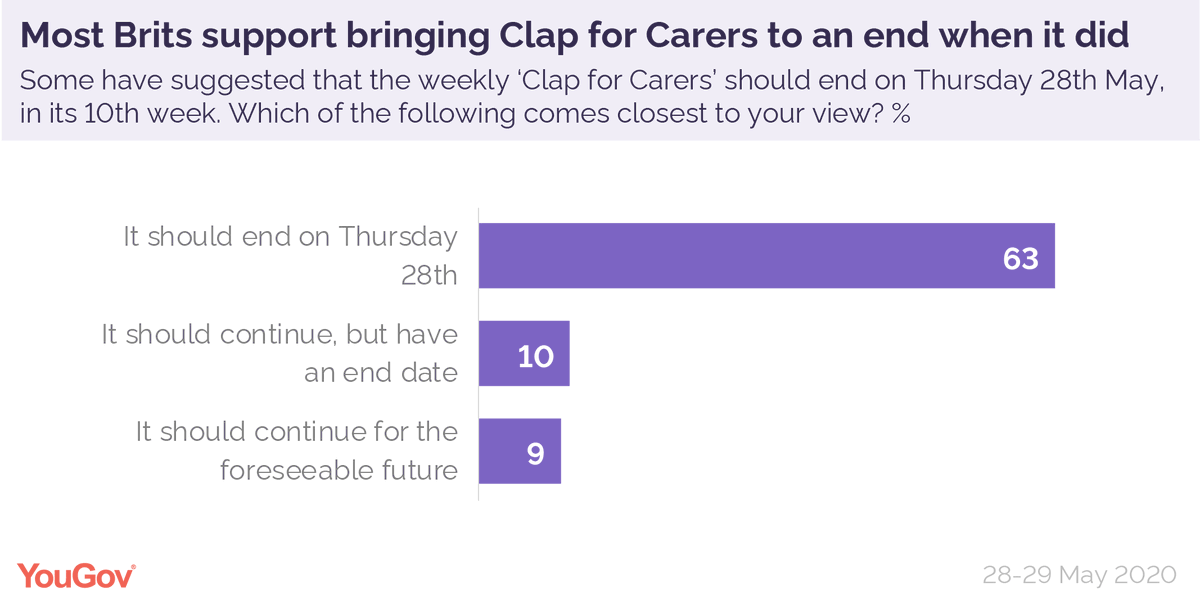
Tonight would have been the 11th week of #ClapForCarers. 63% of Brits agree with the decision to wrap up the event last week, however. Only 19% think it should have continued
Overall 69% of Britons participated in at least one #ClapforCarers, including 29% who took part every week. Only 29% didn't take part at all yougov.co.uk/topics/politic…
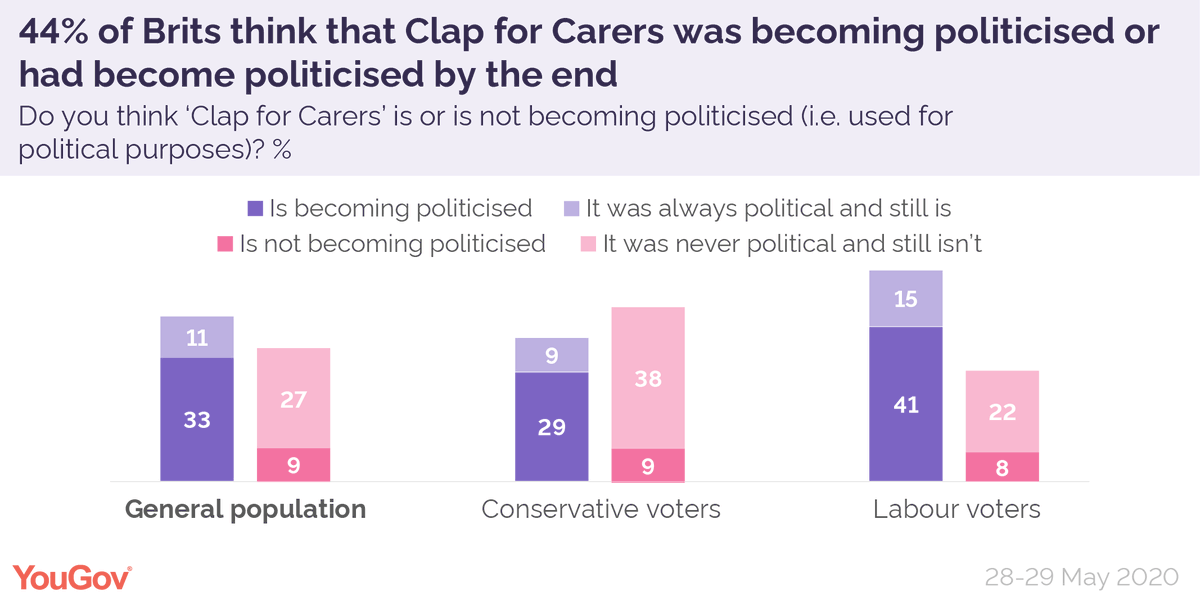
By the end of its run 44% of Brits thought that #ClapforCarers was becoming, or had become, politicised.
🧵/ Where does the British public stand on transgender rights in 2024/5?
The 4th study in our series shows that scepticism has grown across the board over the last two years, including among groups typically more sympathetic to trans people
On transgender social/legal status, % of Britons think...
Social
Should be able to identify as a different gender: 49% (-6 from 2022)
Should not be able to identify as a different gender: 35% (+10)
Legal
Law should allow people to change legal gender: 34% (-6)
Law should not allow people to change legal gender: 48% (+11)
As many Britons now say you should be able to change *neither* your social nor legal gender as say you should be able to change *both*
Should be able to change neither: 33% (+10 from 2022)
Should be able to change both: 32% (-6)
Change social, but not legal: 10% (-1)
Change social, unsure on legal: 7% (+1)
Unsure on both: 11% (-5)
Other combos: 8% (+1)
While Western Europeans are much more likely to want Ukraine to win than Russia, the number who do so AND care a great/fair amount about it has fallen noticeably in some countries since early 2023
With Donald Trump due to become president again in January, Western Europeans typically expect that he will end support to Ukraine – although they are less sure whether he will follow through on threats to withdraw from NATO
Negative attitudes towards Labour have not crystallised just yet. Most Britons (54%) still say they are willing to give the new government the benefit of the doubt
Have high hopes, think they will do well: 19% (-2 from 20 Jun)
Do not have high hopes, but give benefit of doubt: 35% (=)
Do not have high hopes, think they will do badly: 38% (+5)
Nevertheless, many Britons feel let down by Labour. 23% say they expected them to do well in government, but have been disappointed so far
Expected to be bad, and they have: 39%
Expected to be good, but have been disappointed: 23%
Expected to be bad, but have been better than expected: 3%
Expected to be good, and they have: 11%
25 years after devolution for Scotland, and 10 years after the independence referendum, what constitutional set-up do Scots support having?
Devolution, more powers: 51% support
Devolution, current powers: 46%
Autonomy within UK: 42%
Full independence: 41%
Abolition of devolution: 21%
Devolution, fewer powers: 19%
In Wales, existing or enhanced devolution are also the most popular options, though 31% would support abolishing devolution
Devolution, more powers: 40% support
Devolution, current powers: 39%
Autonomy within UK: 32%
Abolition of devolution: 31%
Full independence: 24%
Devolution, fewer powers: 23%
With the 10 year anniversary of the Scottish independence referendum tomorrow, support for 'Yes' and 'No' among voters stands at effectively the same level as a decade ago
'Yes' voters are more likely to have changed their minds since 2014, but are being replenished by younger voters who lean towards Scottish independence
Two-thirds of Conservative members want to be able to vote on policy at conference and be able to vote on all leadership candidates, with six in ten also wanting to elect a deputy leader