A few quick and dirty #CPSMicrodataDay charts, as I ponder other ones.
According to the household survey, broad labor market disruption fell by 8 million people in May, but there are still 32 million people who have left jobs or had their hours involuntarily cut since February. /1
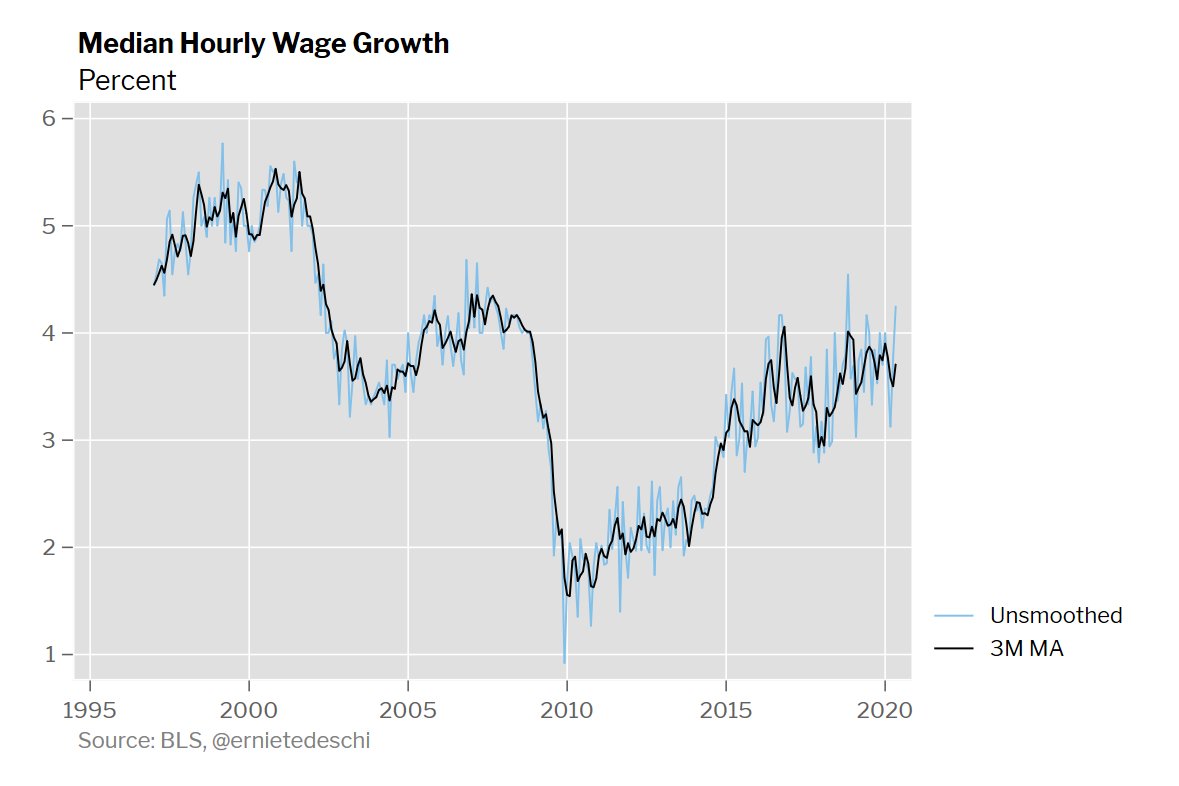
We need to be very cautious about CPS data right now, but one interesting result: median same-worker wage growth hasn't slowed significantly yet, either on an hourly or weekly basis.
That's not what we would expect in such a sharp downturn, though perhaps this takes time. /2
That said, non-raise rates are rising, though note this series is noisy and the 12-month moving average I use will necessarily only change slowly. /3
But--and this is why we need to be more cautious these days--response rates are plunging, widening the uncertainty bands around the data. /4
Moreover, in-person interviews are plunging too (for utterly defensible reasons!), but in-person interviews consistently yield higher unemployment rates for some reason, so this shift may be having a compositional effect on the CPS, though I'm sure BLS has tried to adjust. /FIN
• • •
Missing some Tweet in this thread? You can try to
force a refresh
New from @Stripe Economics today:
One of the biggest labor market uncertainties is whether AI will displace human work at scale. Evidence so far is still early & mixed. The story of travel agents—a clear case of tech displacement—is instructive. And not entirely bleak. 🧵 /1
Some background: Between 1980 & 2000, US travel agent jobs tripled to ~340K thanks in part to airline deregulation. Then came a one-two punch: airlines slashed agent commissions, & internet platforms like Expedia let consumers book it themselves. /2
But displacement didn't happen linearly or gradually. It came in recessionary bursts. After the 2001 recession, travel agency employment fell precipitously—and never clawed back. The pattern repeated in other downturns. Today travel agency employment is 60% below its 90s peak. /3
I'm in @Opinion today talking about three "partial truths" in the US economic narrative. "Partial truths" are not myths--they have more than a kernel of fact behind them--but they demand caution, asterisks, and grains of salt.
@opinion Partial Truth #1: AI is driving a boom in GDP growth.
There's no question business investment in AI has surged. But on the question of **real GDP** effects specifically, it's important to note that a lot of the investment has been imported, which needs to be netted out.
2/9
@opinion If you just looked at the gross effects of software, information equipment, & data centers on GDP, you'd conclude they added 1.3 points to 2025 H1's 1.6% SAAR growth!
But net out imports & the contribution falls to ~0.5pp. Still big! But just enough to offset tariff effects. 3/9
New @The_Budget_Lab tariff update out tonight, incorporating the heavy truck, furniture, and pharmaceutical tariffs announced by President Trump yesterday. Details are still sparse; we will update in the future as more specifics about the policy are published.
In brief...
1/10
@The_Budget_Lab TARIFF RATE: The September 25 announcement raises the average effective tariff rate by 0.5pp to 17.9% pre-substitution (as of Oct 1), the highest since 1934. After consumers & businesses shift their spending mix, the post-substitution rate is 16.7%, highest since 1936.
2/10
@The_Budget_Lab PRICES: The price level rises by 1.7% in the short-run (2-3 yrs) from all 2025 tariffs, assuming the Federal Reserve looks through their price effects. This is the equivalent of a $2,400 average per-household loss of purchasing power in 2025$.
3/10
New @The_Budget_Lab tariff analysis incorporating all tariffs through Sept 3. This is a major update. We:
• incorporate higher assumptions about Canada & Mexico tariff-free import shares;
• show 2 scenarios: all tariffs & no IEEPA tariffs after Jun 2026.
In brief...
1/12
@The_Budget_Lab Under our all-tariff baseline, consumers face an effective tariff rate of 17.4%, a 15.0pp increase from 2024 & the highest since 1935. After shifts in spending in reaction to the tariffs, the effective tariff rate will be 16.4%, a 13.9pp increase & the highest since 1936
2/12
@The_Budget_Lab The price level from all 2025 tariffs rises by 1.7% in the short-run under our all-tariff baseline, an average per-household income loss of $2,300 in 2025$. The post-substitution price increase settles at 1.4%, a $1,900 loss per household.
3/12
We have a new @The_Budget_Lab report out today looking at the short-run effects of tariffs so far. Basically, we asked the questions, "What do we see in actual data to date, and how does it compare to our priors." In brief...
1/13
@The_Budget_Lab REVENUE & TARIFF RATES. New 2025 tariffs have raised ~$88B thru Aug, with $23B in Aug alone. The actual effective tariff rate was ~11.5% in Aug vs 18.2% statutory. The wedge b/t the actual & statutory rates is due to factors that lag revenues & low tariff shares from Canada.
2/13
@The_Budget_Lab GOODS PRICES. Goods prices are higher than they would be absent tariffs. Durable goods prices (furniture, appliances, electronics, etc.) & all core goods prices (durables plus apparel & other nondurable goods) were 2.3% & 1.9% above their pre-2025 price levels in Jun & Jul.
3/13
Headline CPI 0.29% MM/2.70% YY, core CPI 0.32% MM/3.06% YY. Small upside surprise on monthly headline inflation, rest in line with expectations.
Grocery & energy prices declined MM, core goods inflation stayed at a warm 0.2%, & core services inflation picked up to 0.4%.
In June, excess monthly core inflation was largely a goods story, in large part driven by tariff price adjustments.
In July, the excess is a bit larger on net but more split between goods & services.
On the core goods side, several tariff-sensitive items are still above pre-2025 trend price levels. The most significant are furniture, windows/floor coverings, & household equipment. Appliances & electronics also above trend. Girl's apparel slightly below trend.