
Holy moly- I’m crying for MEXICO 🇲🇽. The over 50% is the *POSITIVITY* percentage!!! More than half of all who get a test are positive. Even in the worst periods of NYC or Madrid or Lombardy... they never approached 50% positivity!! Mexico may be undergoing unprecedented #COVID19. 
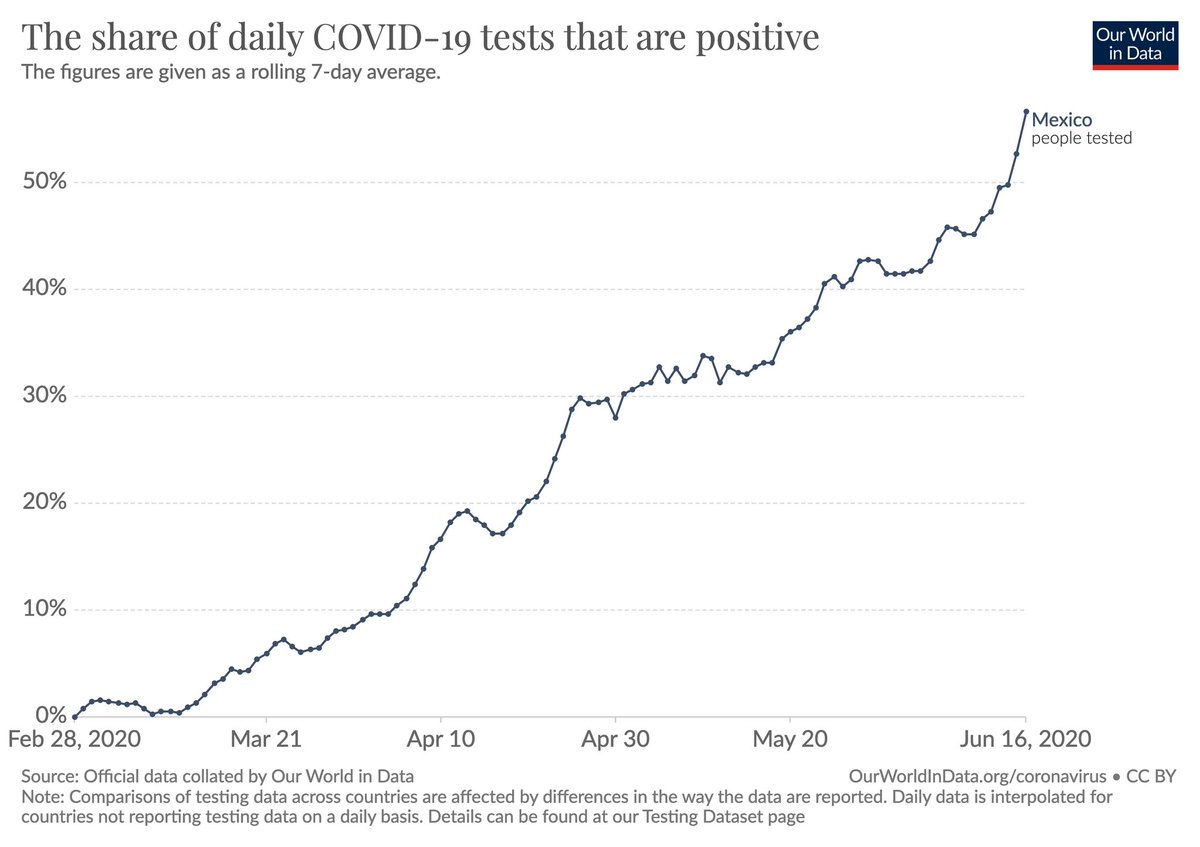
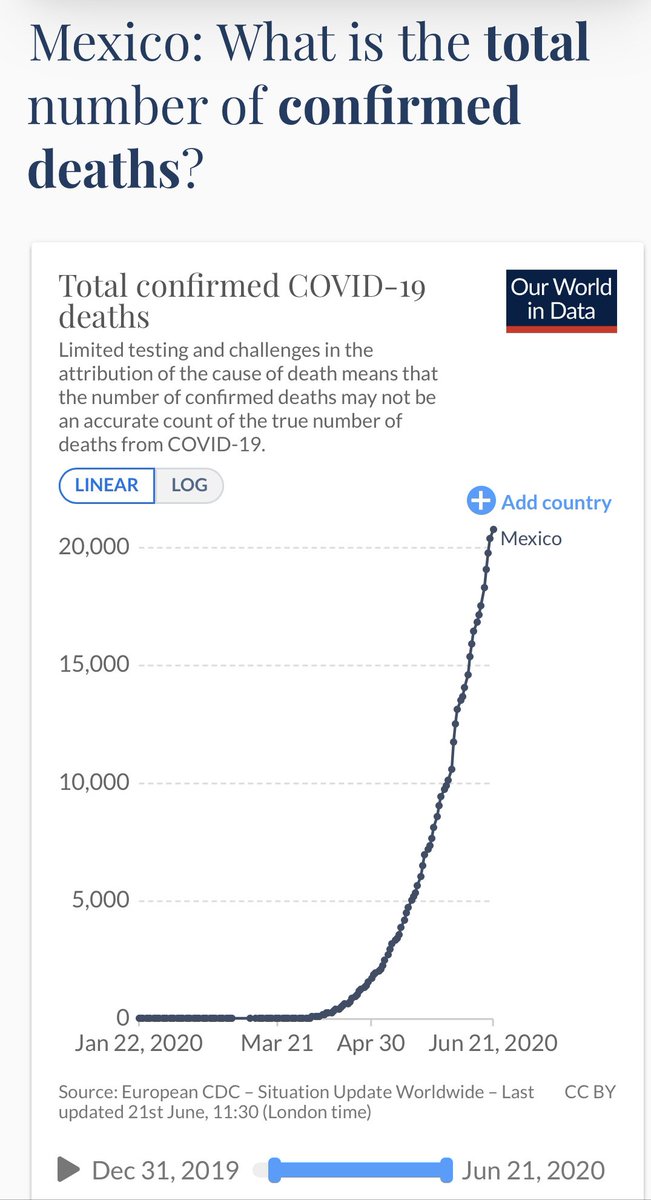
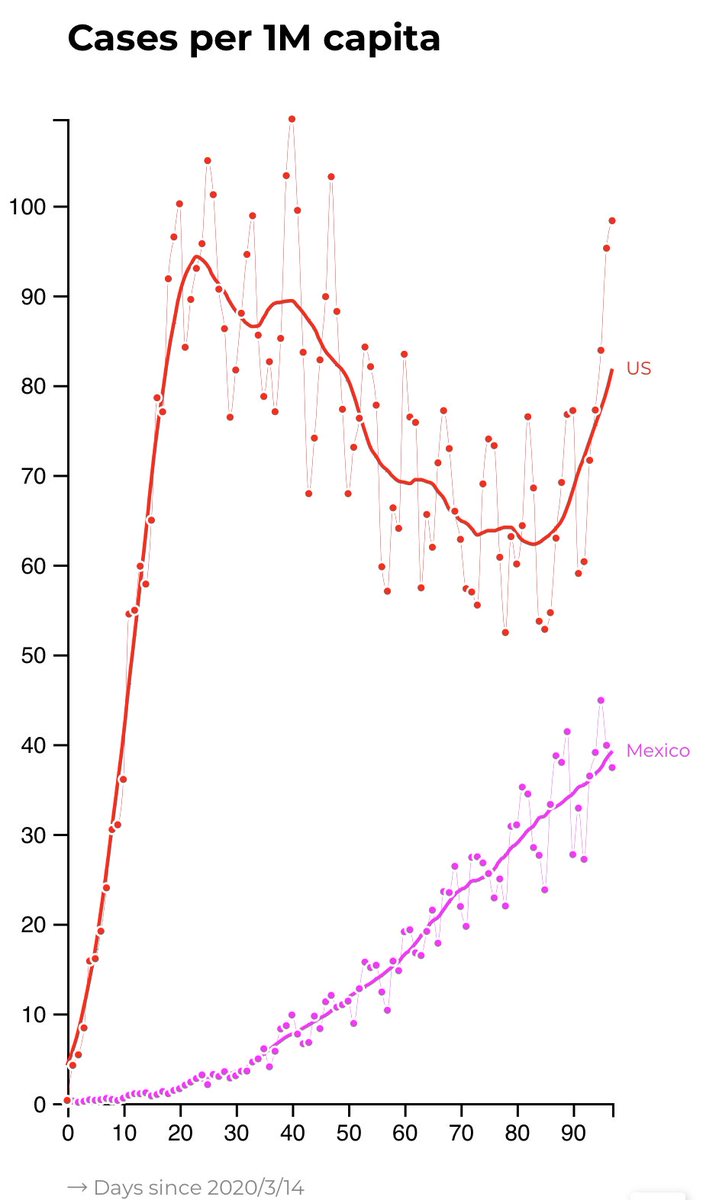
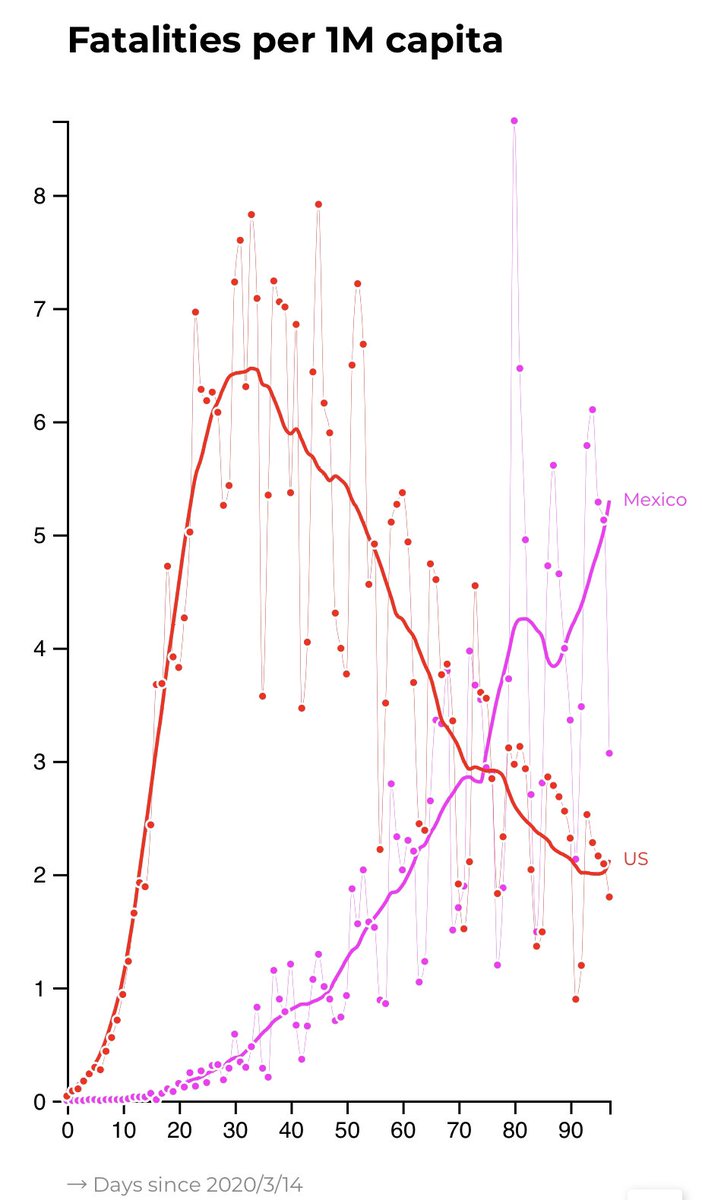
3) Mexico per capita cases and mortality versus the US. There is clearly underdiagnosis in Mexico and poor treatment. The 56% positivity reflects that. So yes, damnit, we need more testing.
4) I’m seeing comments from people who either don’t understand % positivity or state that it doesn’t mean anything other than restricted testing to those with symptoms. Some have a misunderstanding, and some are outright wrong. Let’s clear it up below...
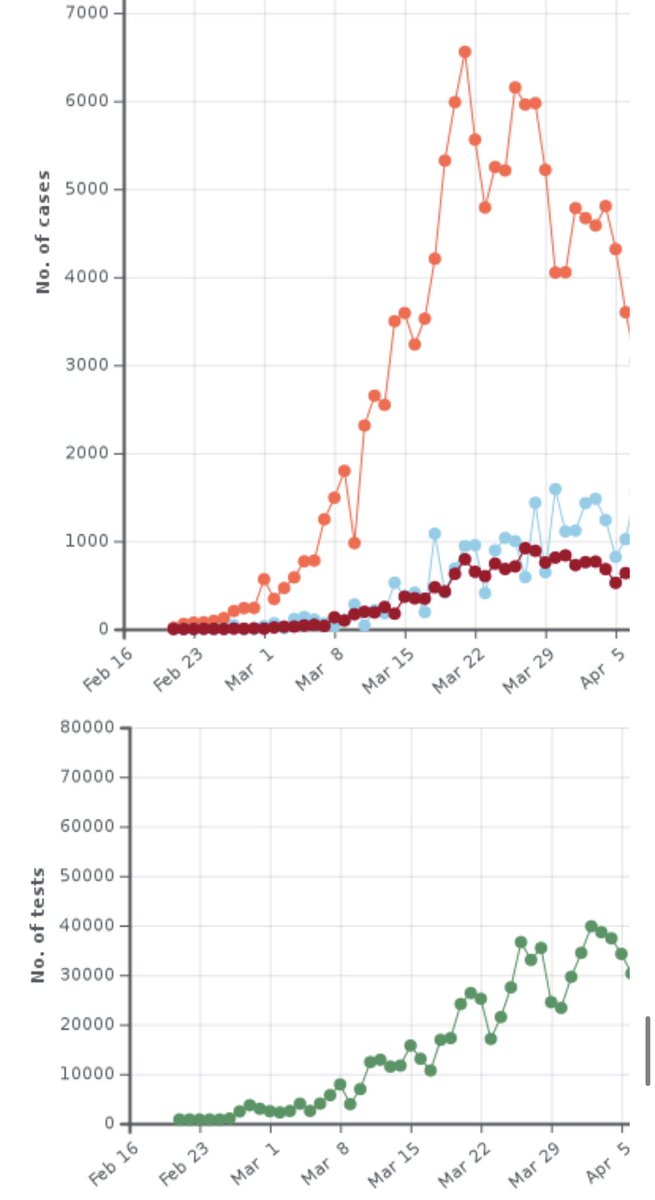
5) Positivity is a function of several things - # cases, testing volume / availability, and how late one is testing. Italy also has restricted testing at one time, but never did the country as a whole come close to approaching 50% positivity. See Italy daily cases & tests below.
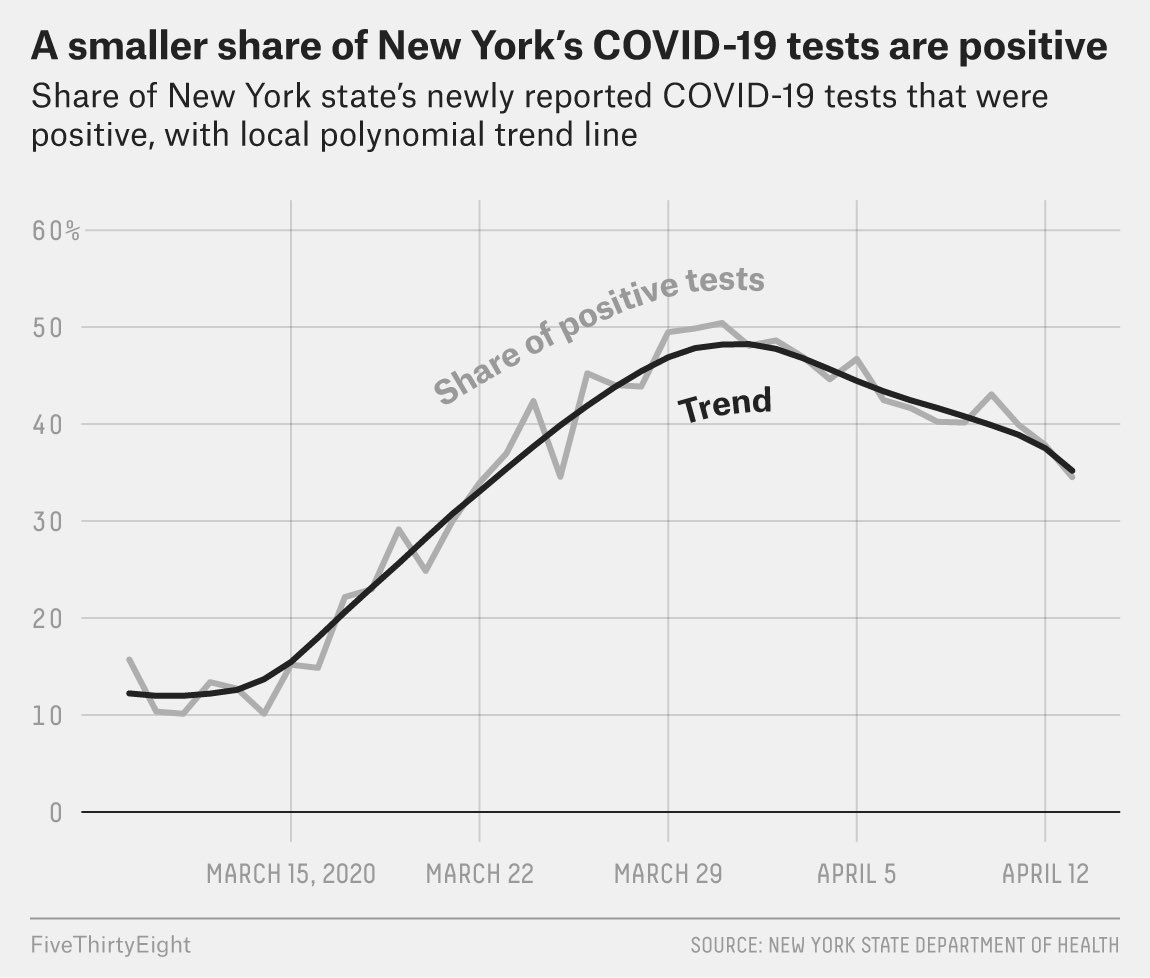
6) Meanwhile, here was New York’s positivity % chart during the worse days of the epidemic, when tests were limited. NY state as a whole never surpassed 50%. For 🇲🇽 to hit 56% for a whole country meanwhile is just insane. It must test more! The epidemic breeds on undertesting.
7) Often, when I show rising cases alone, many will shout it’s not adjusted for population. When I show cases per capita, some say it’s just more testing. That is why % Positivity is useful -it shows cases divided by tests. Per capita graphs below don’t show lack of tests.
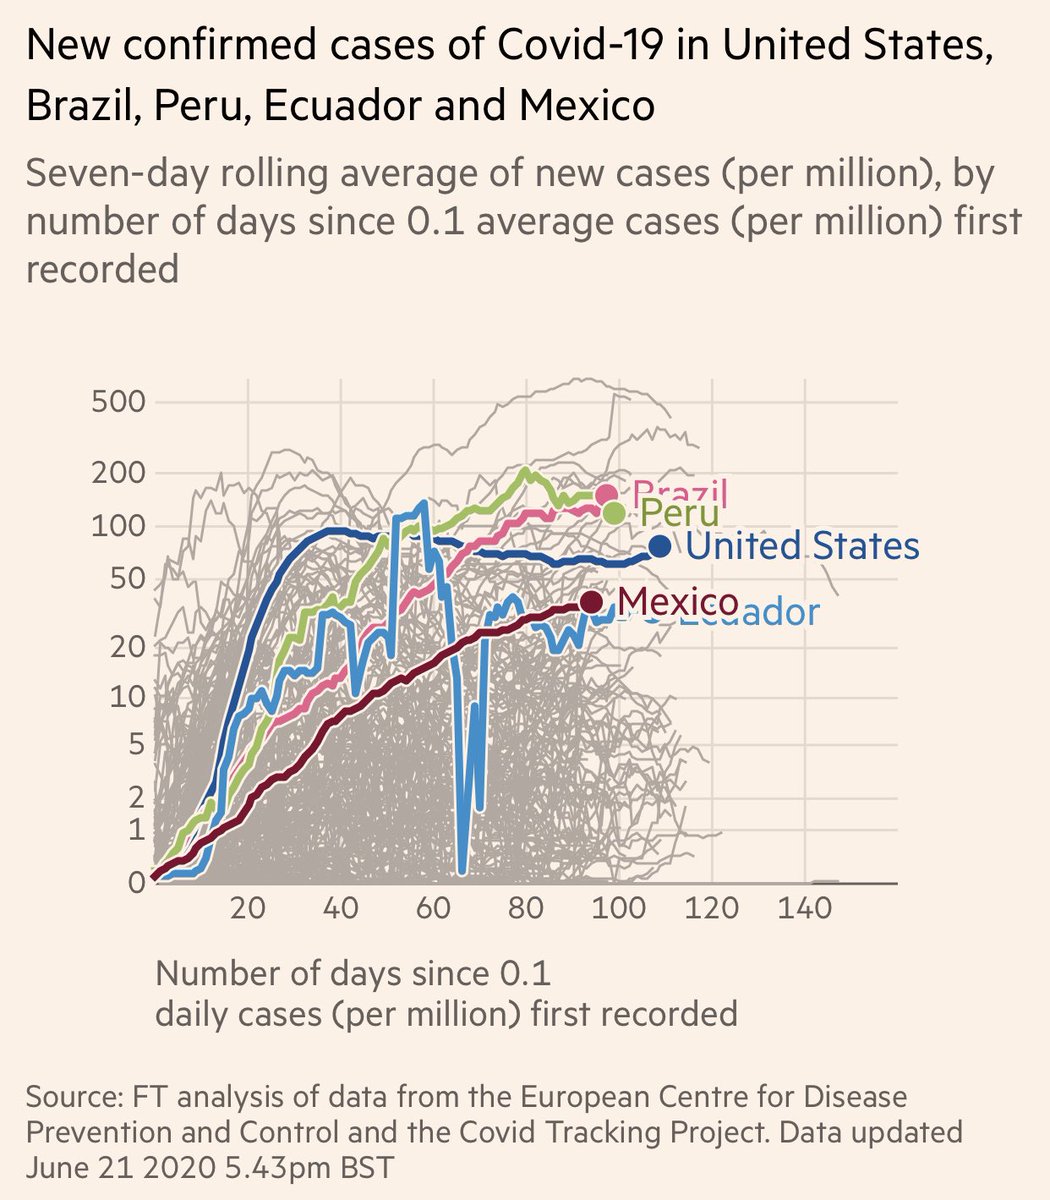
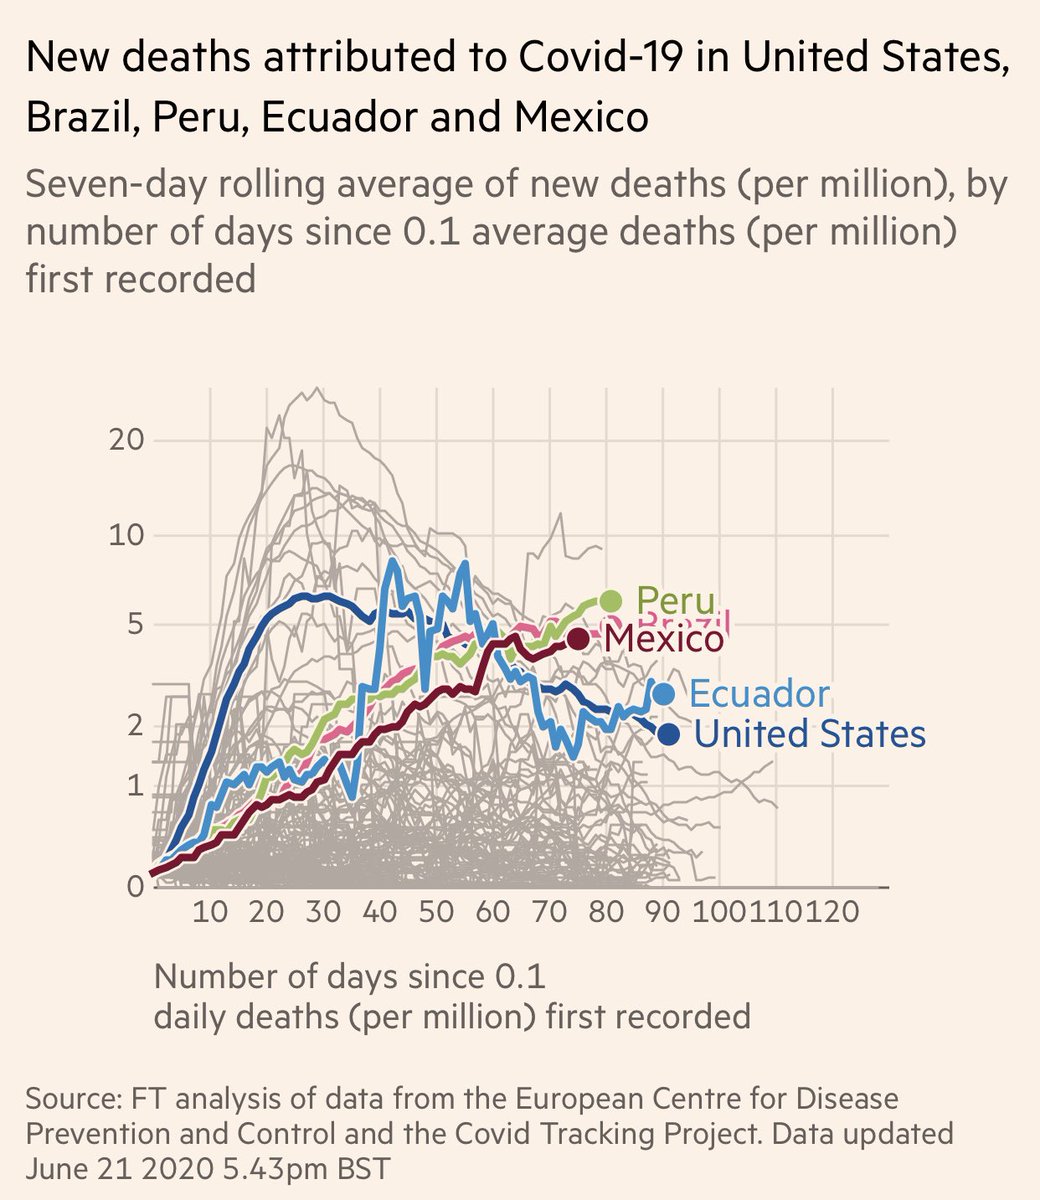
8) hence, no single statistic is perfect - they all need to be read in context of population, testing volume, undertesting. What % positivity shows is relative lack of testing/severity. South Korea had 2% positivity, as did others. Positivity rate is a “decent proxy for severity”
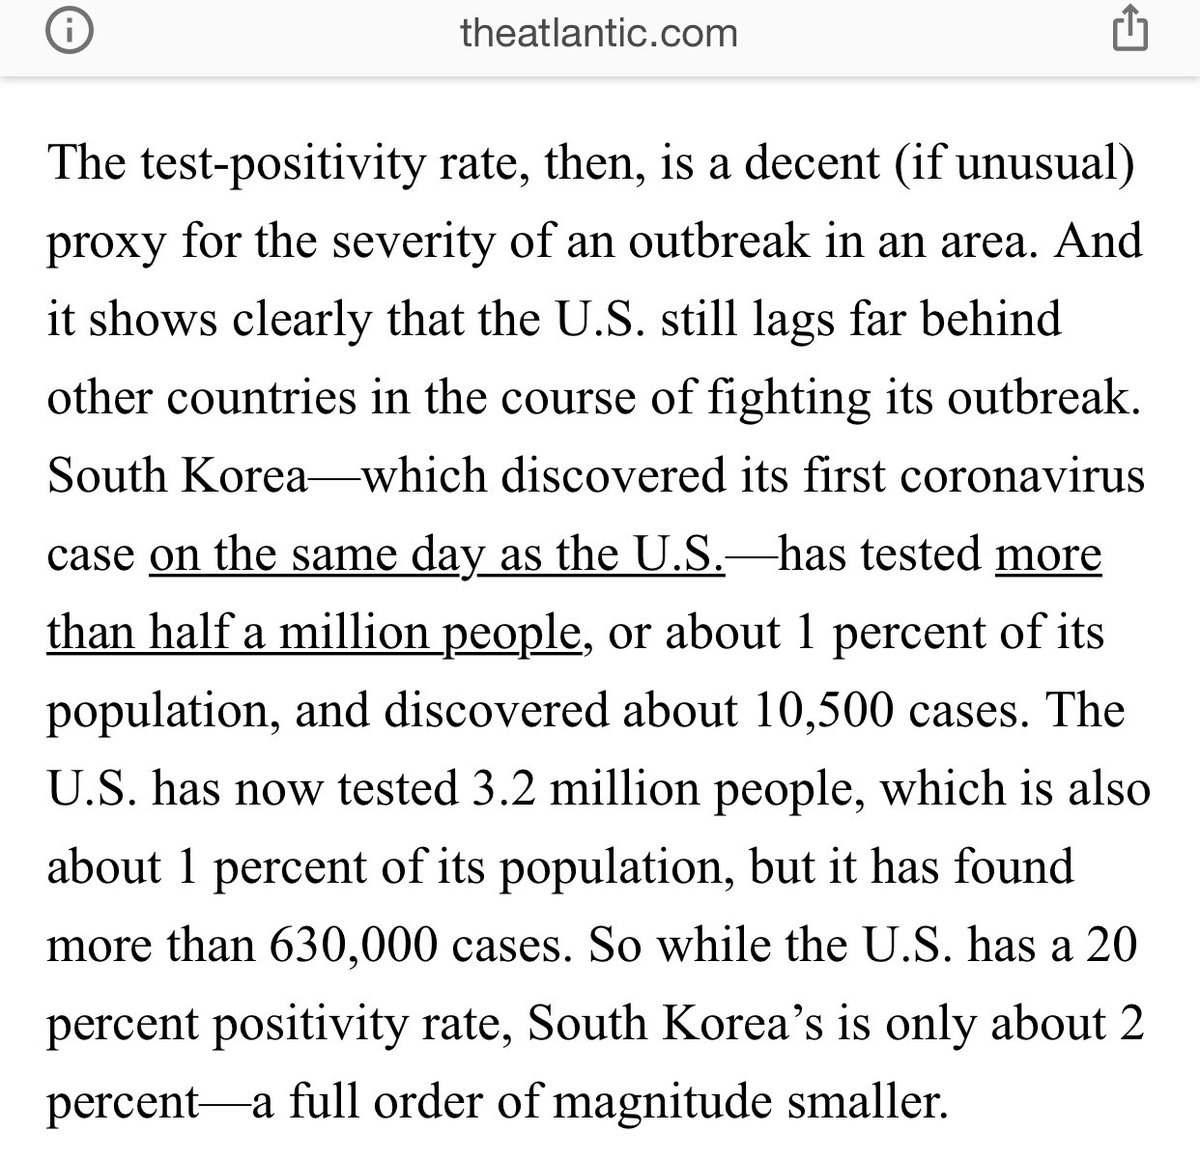
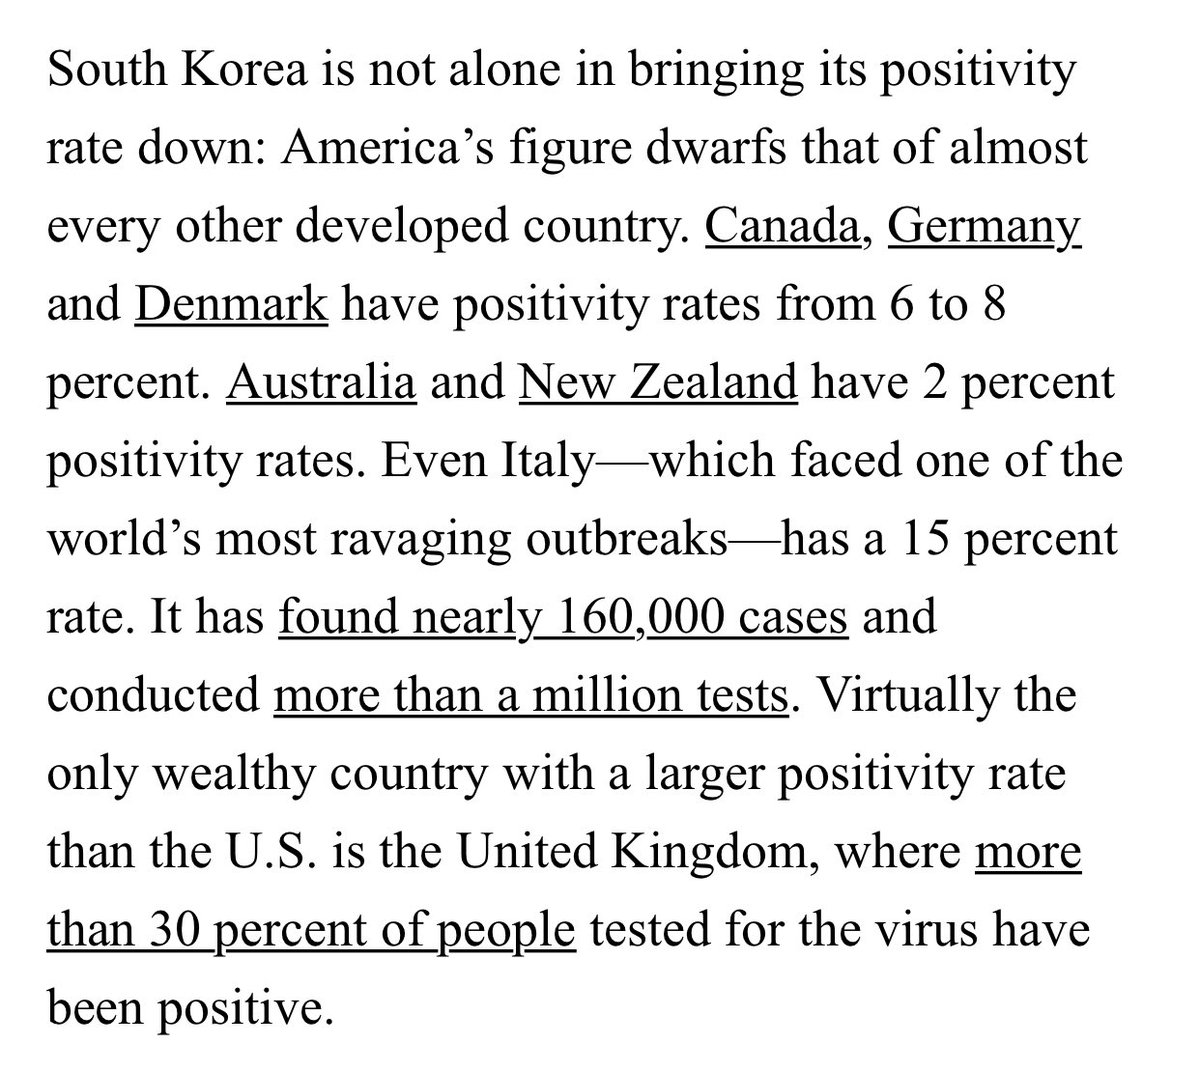
9) This article is a good summary on the logic of the POSITIVITY RATE (or %) theatlantic.com/technology/arc…
10) p.s. NYC did hit mid 50% in positivity during its peak, as did Lombardy. But those are sub-national hotspots. US, NY state, and Italy never did. Mexico’s 56% is national overall number. There are part of 🇲🇽 with much much higher than 56% if we want to compare apples to apples
11) There are other factors than only the number of basic tests offered. Some countries like 🇰🇷 have really aggressive contact tracing + testing, which tries to turn every rock to find more cases. But many countries unable to do tracing-combined testing well, if at all.
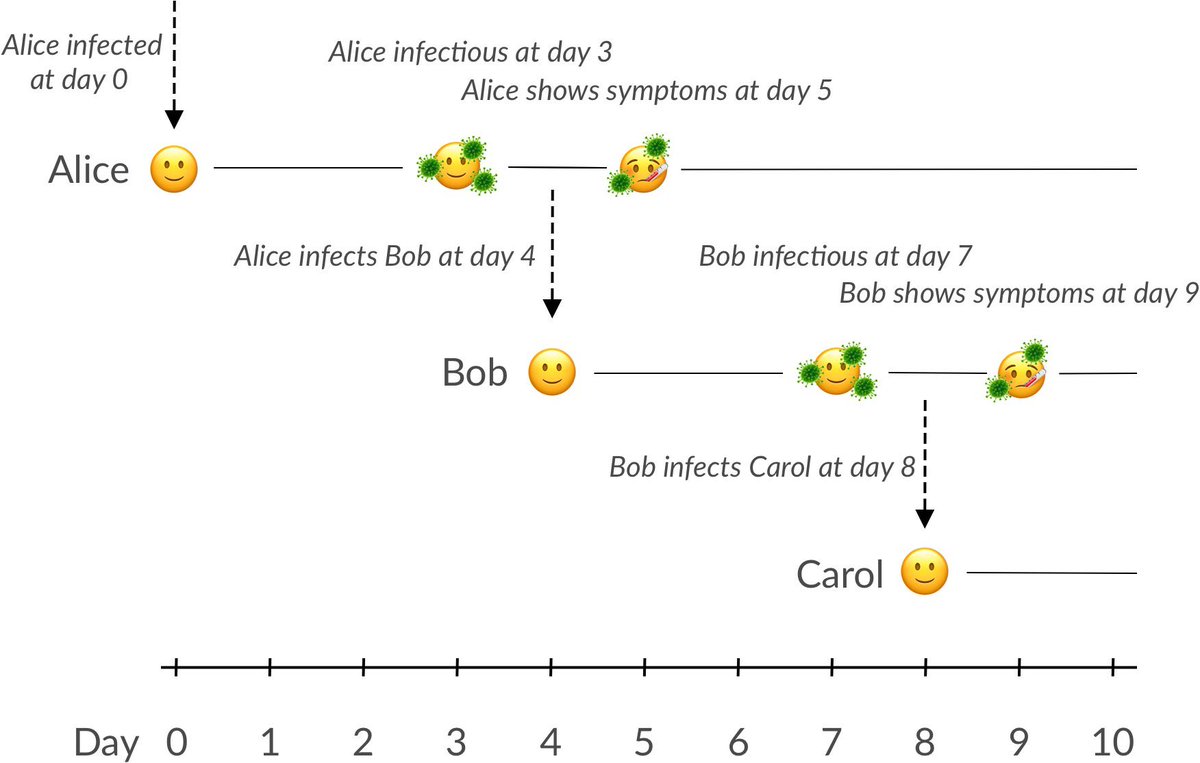
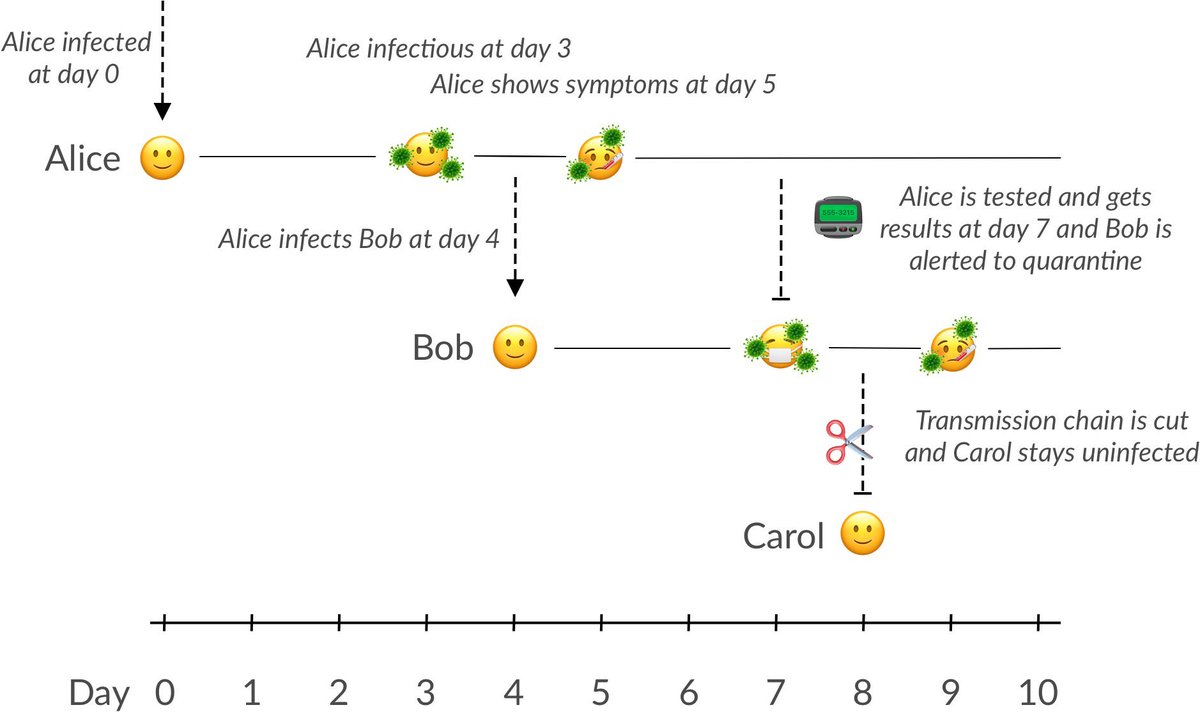
12) The main advantage early aggressive testing + contact tracing is the ability to stop transmission chain. If you test too late, you won’t be able to stop the ‘ALICE=>BOB=>CAROL’ chain of infection below. But with fast testing and tracing, you can!
13) Another alternative indirect testing approach is wastewater testing it virus particles. It is gaining support worldwide, with companies like @BiobotAnalytics doing it. And recently also successful in finding the epidemic hit Europe in December. statnews.com/2020/05/28/was…
14) Many are asking who are being tested in the US? Early on, it was very limited (the US had many mistakes), but US testing has increased dramatically. Testing is now covered by most private insurance and govt insurance. Much easier now to test than before. Which is critical.
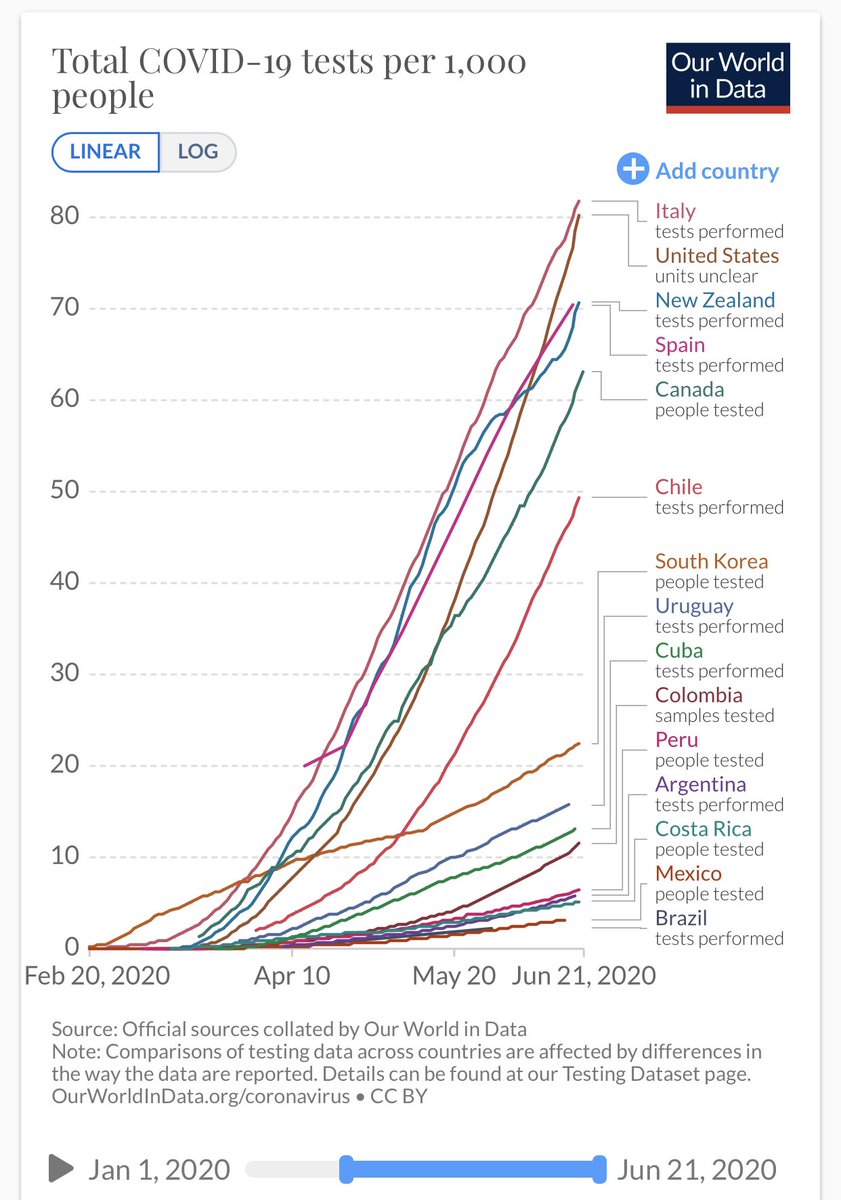
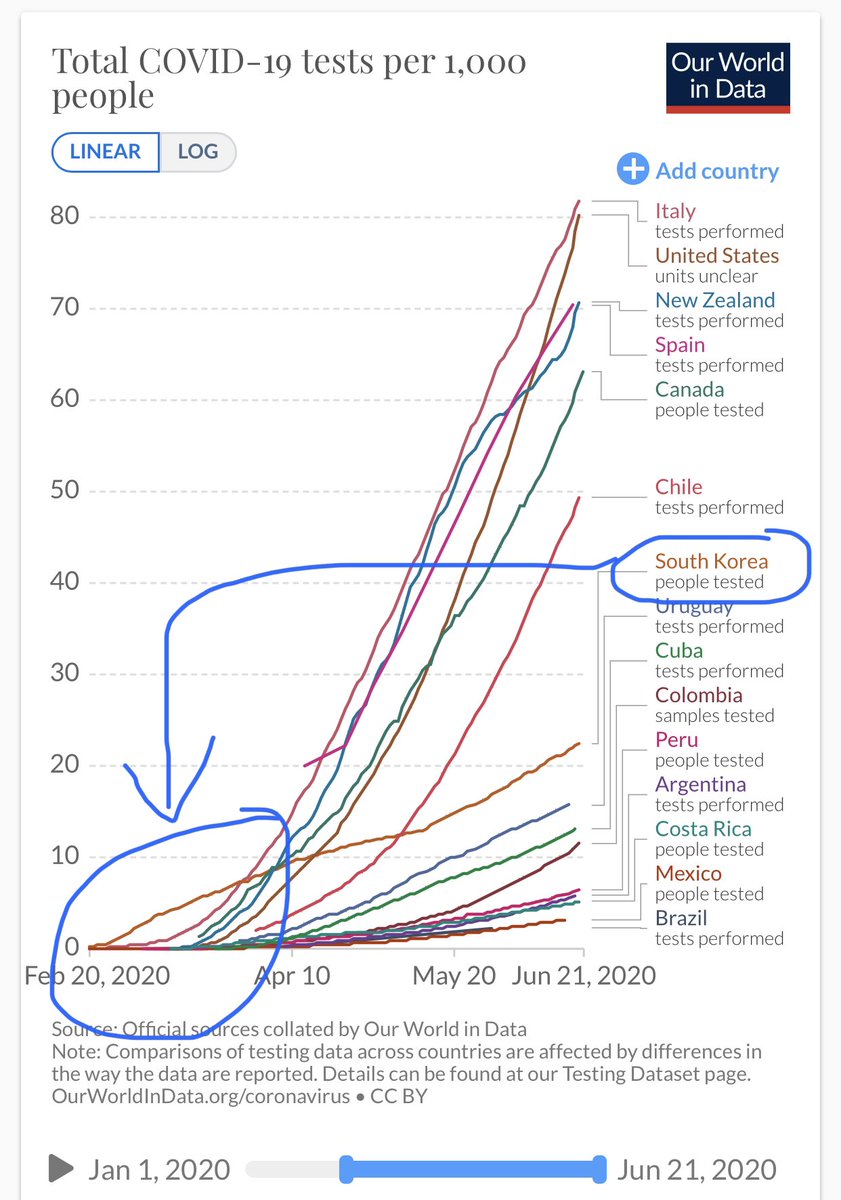
15) Finally, TESTING PER CAPITA of different countries. This is most asked of all: here is the graph. Mexico 🇲🇽 is very far down the list of testing per capita. This is cumulative testing, not daily. South Korea 🇰🇷 tests less now Cuz epidemic contained. ourworldindata.org/grapher/full-l…
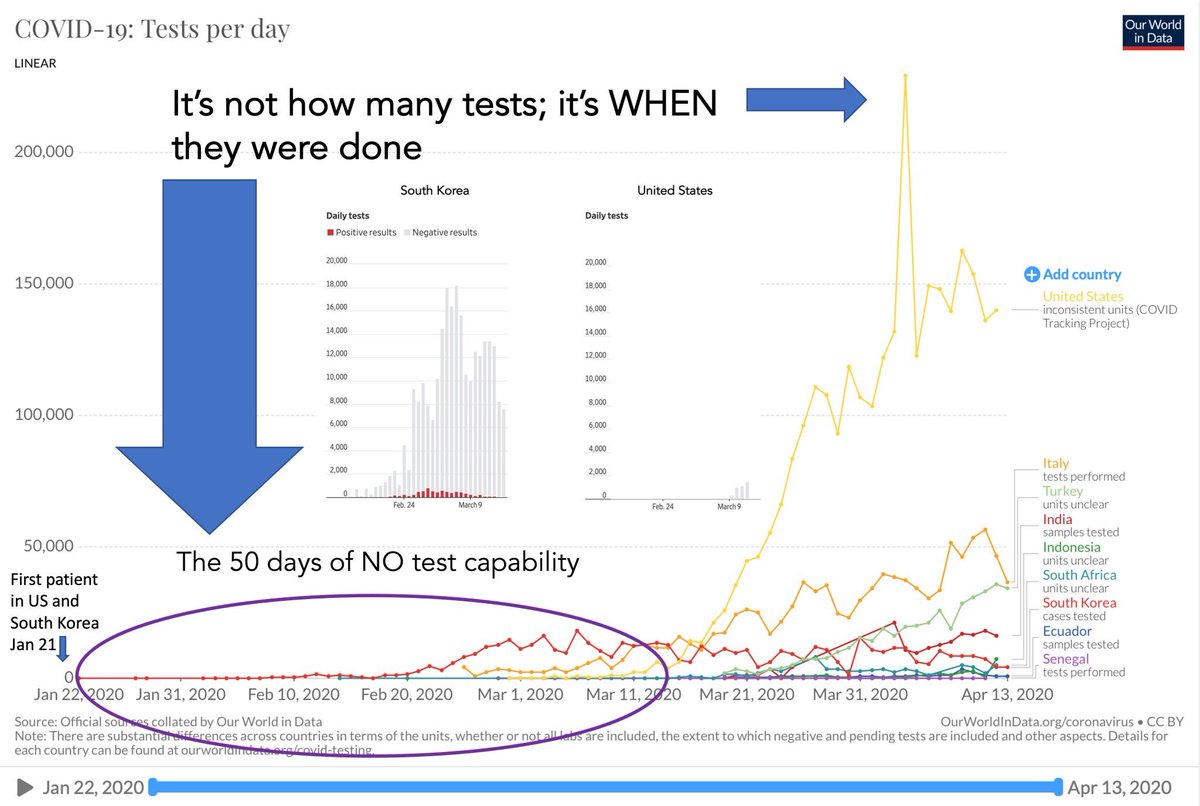
16) Also it’s extremely important to consider not just HOW MUCH YOU TEST, but WHEN you test. Early testing is critical. Early testing stops an epidemic before it rages out of control. US was late to start testing. Italy did similar testing to New Zealand but 🇮🇹 was late lockdown.
17) I encourage people to investigate the daily testing volume in Mexico, and compare with change in cases. See this example from US in the last 2 weeks: CASES INCREASING FASTER THAN TESTING = true epidemic growth. This is also seen by % POSITIVITY RATE.
18) Mexico testing declining even in the past few days according to @OurWorldInData


