How does effective viral surveillance change when (1) some people refuse to participate, and (2) sample collection errors lead to lower sensitivity, indep. of a test's limit of detection? Questions raised by @jhuber @awyllie13 & others after I posted this preprint last week.👇 1/
I love twitter+preprints precisely because of this community. In the updated preprint, we've corrected a couple typos, and created a new supplement, "Adjustments for false negatives and test refusal" which I'll quickly summarize below. 2/ medrxiv.org/content/10.110…
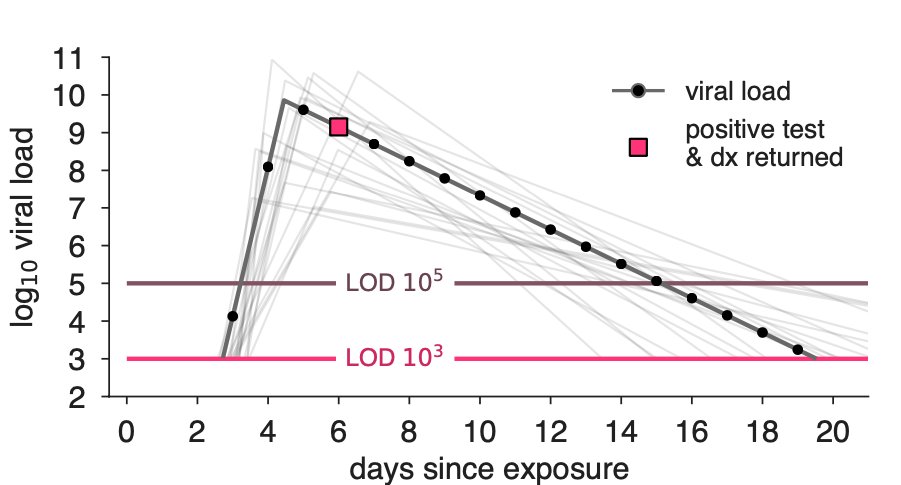
Previously, we estimated the impact of a policy on R by measuring the "infectiousness" the testing, relative to no testing. The formula's values correspond to the heights of bars in plots like this one. f0 is the leftmost hatched bar. ftest is the total height of a policy bar. 3/ 


Assuming independence between (1) refusal status, (2) viral load, (3) sample collection errors, we can adjust the previous formula. If 1-se is the probability of a false negative due to sampling, and r is the refusal rate, the new formula blends effective testing with failure. 4/

[sanity check: plug in se=0 (catastrophic sampling errors) or r=1 (total refusal) and you find that R≈R0.]
This means, for example, that if a perfectly implemented policy brought R from 2.0 down to 1.0, a 10% refusal rate and 2% false negative rate would leave R at 1.1 5/
This means, for example, that if a perfectly implemented policy brought R from 2.0 down to 1.0, a 10% refusal rate and 2% false negative rate would leave R at 1.1 5/
The broader implication is that any testing surveillance policy must account for testing refusal and procedural errors—aspects which we would be wise to try to quantify prior to any proposed rollouts. (Looking at you, college campuses.) How many students would refuse testing? 6/
In any case, our first-draft conclusions — that test sensitivity is secondary to frequency and turnaround time for COVID-19 surveillance — still apply, but have been extended & expanded thanks to community feedback #teamscience 7/
medrxiv.org/content/10.110…
medrxiv.org/content/10.110…
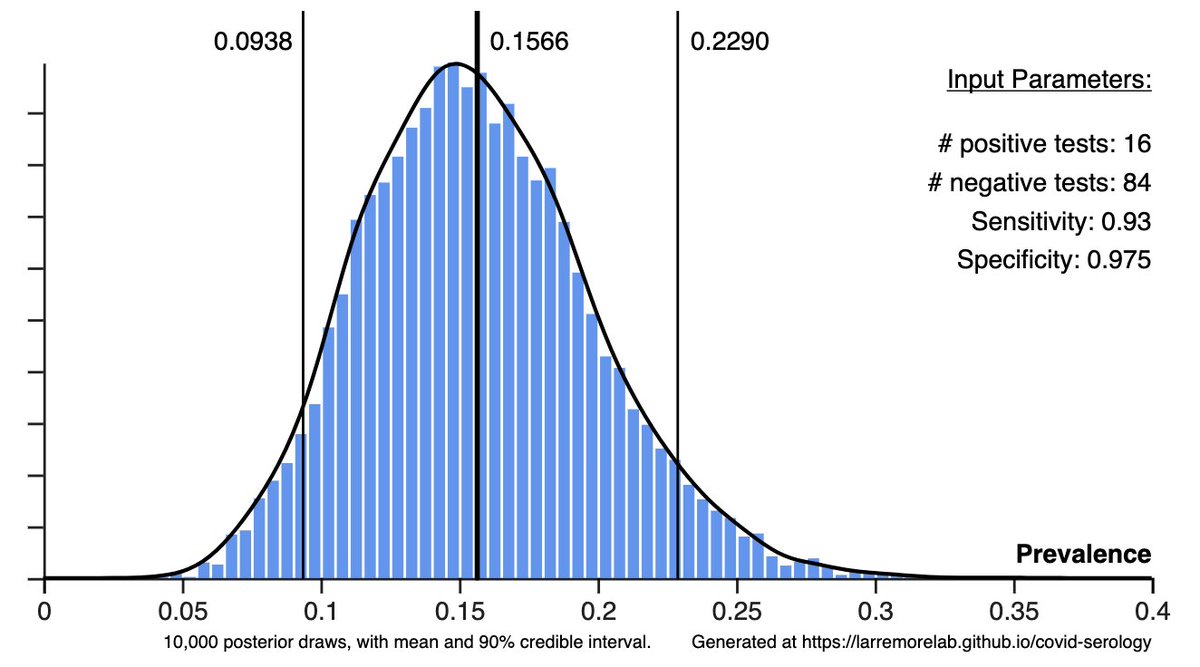
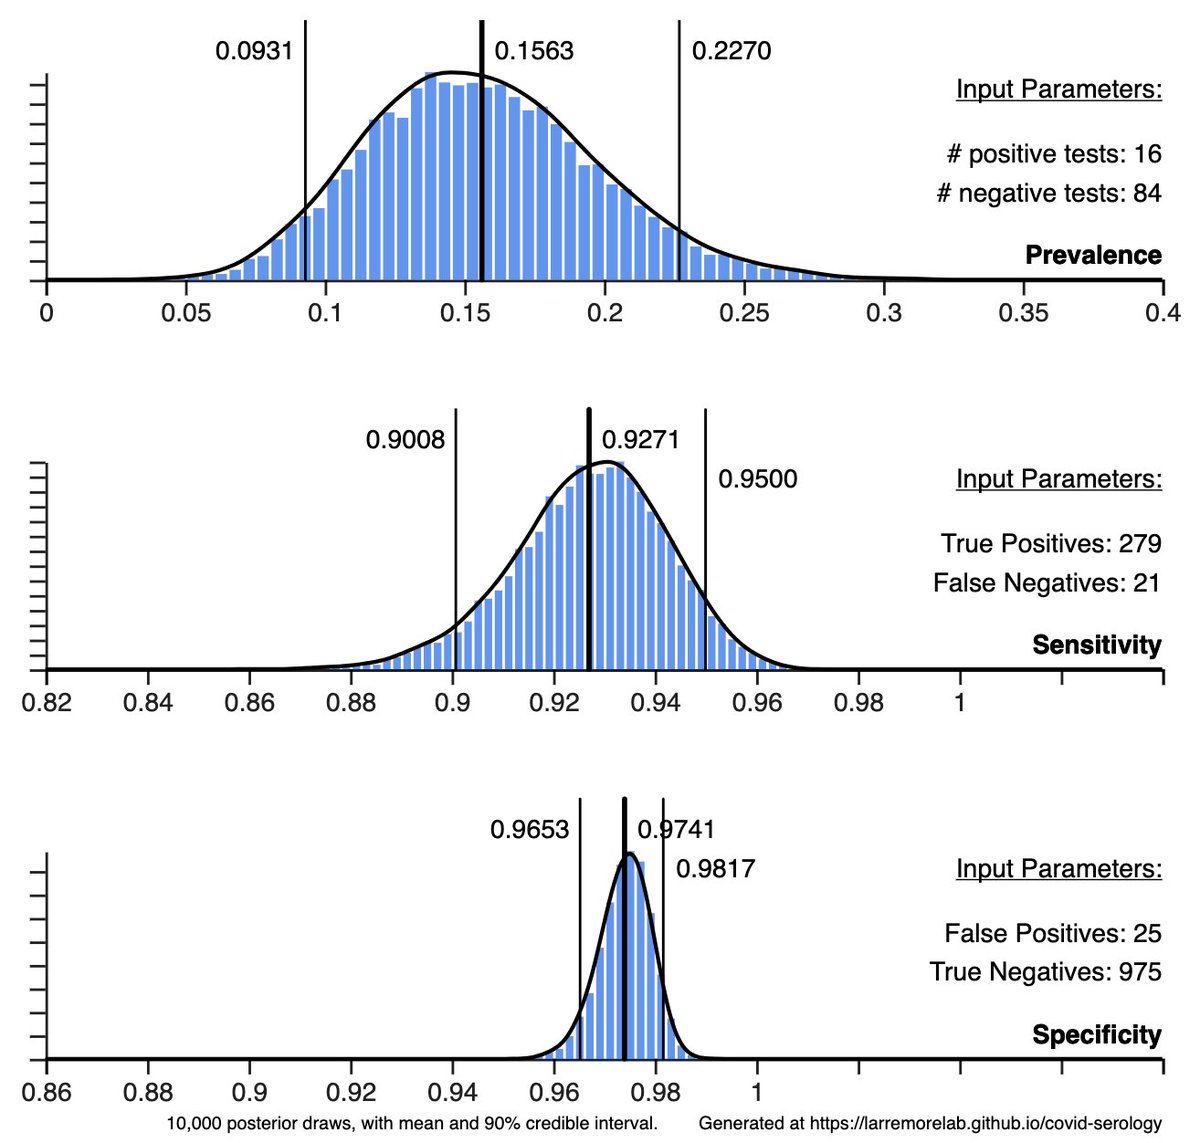
Finally, @_szhang updated the online calculator thx to feedback from 💫 @baileyfosdick & @elray67 who suggested drawing more samples to stabilize estimates in the charts. The R reduction factor discussed above is also shown, w/o se and r adjustment. 8/8
larremorelab.github.io/covid-calculat…
larremorelab.github.io/covid-calculat…