Scott Irwin Profile picture
Jul 6, 2020 10 tweets 4 min read Read on X
1. WASDE yield projections in May, June, and July always a source of market conversations/controversy. Corn yield forecast was 178.5 bpa in May and June for the US. What will it be in the July WASDE that will be released on Friday, July 10?
2. Since 2013, WASDE yield projections for May-July have been based on a crop weather regression model. In our experience, the model and how it is used is not very well understood. So we wrote a #FDD last week to try to explain the model. farmdocdaily.illinois.edu/2020/07/unders…
3. First thing to get straight is that the WASDE/WAOB May-July corn yield forecasts are model-based, while NASS Aug-Nov yield forecasts are survey-based. Completely different methodologies. Only looking at WAOB model here.
4. We first set out to replicate the original crop weather model first published in this USDA publication back in 2013. ers.usda.gov/publications/p… It does a pretty good job of explaining the modeling but some details left out.
5. Did our best to collect the data and specify variables the same as in the USDA pub. Model is actually pretty simple. Explanatory variables for US avg corn yield include: trend, planting progress, June precip shortfall, July precip, July temp. Image
6. We came very close but could not quite exactly replicate the original 1988-2012 regression estimation results in the USDA pub. See for yourself below. Differences probably due to slight differences in the data. Image
7. Next thing we wanted to do was to see if we could replicate the 2020 May and June forecast of 178.5 bpa. Updated data through 2019 and re-estimated model. Image
8. To forecast for 2020 using this version of the WAOB corn model, plugged in 33 for trend, 10 year avg planting progress (excluding 2019), avg July temp 1988-2019, and avg July precip. The last one is a bit tricky because July precip is a non-linear quadratic in the model. Image
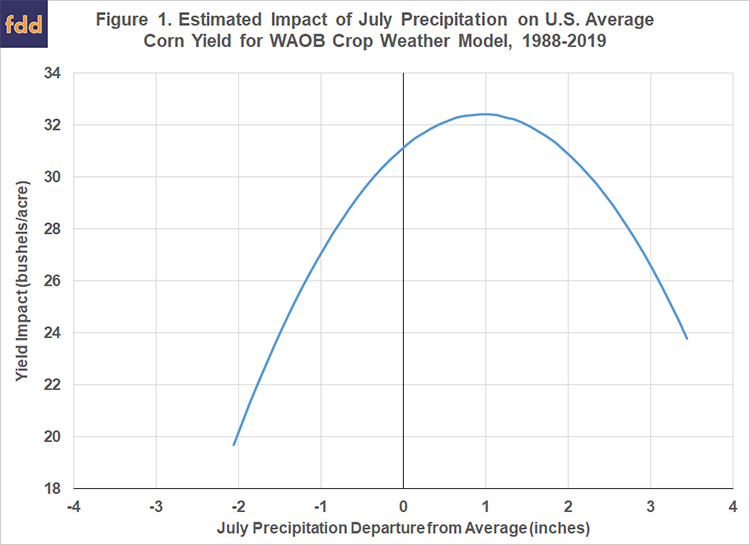
9. Tricky think here is that we want average yield across all precip observations. This is not the point given by avg precip (zero in chart). Reason is that low precip pulls down yield more than high precip pulls it up. Details in article how we handled. Image
10. With the non-linear July precip adjustment, we exactly replicated the current WAOB/WASDE estimate of 178.5. Hopefully that was not just luck! Anyway, there you have it. That is how the WAOB makes its corn yield forecasts in May, June, and July. Image

• • •

Missing some Tweet in this thread? You can try to force a refresh
 

Keep Current with Scott Irwin

Scott Irwin Profile picture

Stay in touch and get notified when new unrolls are available from this author!

Read all threads

This Thread may be Removed Anytime!

PDF

Twitter may remove this content at anytime! Save it as PDF for later use!

Try unrolling a thread yourself!

how to unroll video
  1. Follow @ThreadReaderApp to mention us!

  2. From a Twitter thread mention us with a keyword "unroll"
@threadreaderapp unroll

Practice here first or read more on our help page!

More from @ScottIrwinUI

Mar 20
1. I guess today is the day to talk about corn yields. Just received an email from @aaea announcing a new Choices article "A Slowdown in US Crop Yield Growth" by David Boussios. Here is the link: choicesmagazine.org/choices-magazi…
2. The author of the Choices article argues: "The statistical evidence of a productivity slowdown in crop yield growth builds each year. The linear yield growth trends since 2013 for corn, soybeans, and wheat are all statistically lower than one starting in 1988. Models, forecasts, market participants, and policy makers should consider that yields in the future will probably be lower than forecasted by the USDA and that extrapolating trends into the future without revision is problematic."
3. This argument is especially interesting because I have seen similar arguments in the grain trade in the last few years. We can all agree that the US average corn yield has been relatively flat since around 2013. That is obvious looking at a chart of corn yields. But one has to be extremely careful in then leaping to the conclusion that productivity growth in corn yields has also slowed. The reason is that runs of poor or good weather can mask the true underlying trend in small samples of years.
Read 7 tweets
Nov 1, 2023
1. Recommended Reading for the Day: Fascinating new FDD from my colleagues on the farmdoc team, led by Carl Zulauf. Long-term look at real crop prices. farmdocdaily.illinois.edu/2023/10/the-po…
2. It has long been a staple of economic thinking that real (inflation adjusted) commodity prices have a strong tendency to decline over time. Probably the most famous example of in this regard is the bet about real commodity prices between Julian Simon and Paul Ehrlich in 1980. See the details here:
3. Carl and team put together the data for a USDA index of real crop prices going back to 1912. This is the chart shown below. Lots of interesting history here, but the 30 year period of stable real crop prices that began around 1990 is unmistakable. The question is whether this is a pause in a very long run downward trend or something new.
Image
Read 8 tweets
Sep 28, 2023
1. Excited to announce that the band is back together! Actually, talked Darrel Good into coming out of retirement to work on this FDD: "The New Era of Crop Prices: A 15-Year Review." farmdocdaily.illinois.edu/2023/09/the-ne…
2. When crop prices started to take off in 2006-07, a huge question was whether this was just another spike like we had seen so many other times, or was this the beginning of a permanent jump in the level of average prices, like in 1973. Image
3. For some reason (temporary insanity?), Darrel and I decided to stick our necks out and predict that a new era in crop prices was afoot AND make specific predictions for the average price and trading range in the new era. As this chart shows, we did not have much data to go on.
Image
Read 8 tweets
Jun 1, 2023
1. Ok, I have hopefully convinced you that the RIN cliff scenario is a logical possibility. Now what are the chances of it actually happening? The first step is to estimate QM in the graph below. Turns out the proposed RVOs released by EPA last December are the place to start. Image
2. We can use the proposed RVOs to come up with a defensible estimate of the maximum demand for biomass-based diesel (BBD) for 2023, 2024, and 2025. We can do this because we know mandates are and will be binding. Image
3. I will leave the details of the computations to the article. Suffice it to say that under the EPA's preliminary rulemaking, the max amount of BBD needed is about 4BG each year. That is national demand for sum of RD and BD. Image
Read 11 tweets
Jun 1, 2023
1. Ok, had to take a brief pause for the cause (a meeting). Anyway, diving into the heart of the RIN cliff idea in this thread based on our latest FDD. farmdocdaily.illinois.edu/2023/05/is-the…
2. Here is how RIN pricing works when BBD production is equal to the mandated quantity. In this case, looking at an example of D4 biodiesel RIN pricing on May 4, 2023. Predicted D4 RIN price is $1.61 and actual on this date is $1.58. Pretty close. Everything A OK. Image
3. But what if for some exogenous reason, biomass-based diesel (BBD) production is pushed past the RFS mandate? This is the RIN cliff scenario. New market equilibrium is given by intersection of demand w/tax credit and fixed QRC supply of BDD. Red line becomes supply curve. Image
Read 8 tweets
Jun 1, 2023
1. Our latest FDD on the renewable diesel boom is titled "Is the U.S. Renewable Fuel Standard in Danger of Going Over a RIN Cliff?" That should get your attention this morning. It is going to take me several twitter threads to go through the highlights.

farmdocdaily.illinois.edu/2023/05/is-the…
2. In this thread, I am going to go through the first part of our analysis. Start with the very basics of binding and non-binding RFS mandates. In a standard supply/demand framework, here is a binding mandate. Image
3. A binding mandate "binds" in economic terms because the mandate volume exceeds the competitive market equilibrium quanitity. To get the higher than equilibrium Q produced, producers have to be offered a higher price and consumers a lower price. Image
Read 9 tweets

Did Thread Reader help you today?

Support us! We are indie developers!


This site is made by just two indie developers on a laptop doing marketing, support and development! Read more about the story.

Become a Premium Member ($3/month or $30/year) and get exclusive features!

Become Premium

Don't want to be a Premium member but still want to support us?

Make a small donation by buying us coffee ($5) or help with server cost ($10)

Donate via Paypal

Or Donate anonymously using crypto!

Ethereum

0xfe58350B80634f60Fa6Dc149a72b4DFbc17D341E copy

Bitcoin

3ATGMxNzCUFzxpMCHL5sWSt4DVtS8UqXpi copy

Thank you for your support!

Follow Us!

:(