Trendline Investor Profile picture
Jul 11, 2020 11 tweets 5 min read Read on X
Thread: As Promised, here is a multi-timeframe positional strategy based on CCI.

CCI Basics: A CCI reading above 100 is considered Bullish and overbought and a reading below -100 is considered Bearish and oversold. 1/n
I believe in buying overbought and selling oversold and this strategy is based on this assumption.

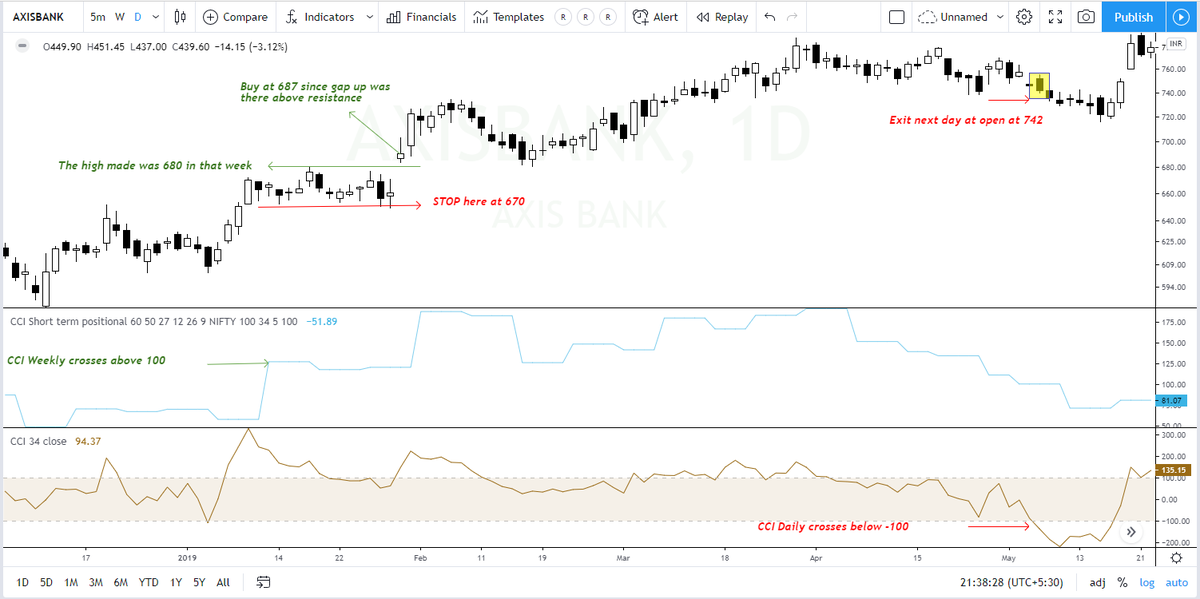
Entry criteria: CCI(34) on Weekly crossed above 100 and CCI(34) on Daily >100. Enter only above weekly high
Stoploss criteria: Recent swing low on the daily chart 2/n
Exit criteria: CCI(34) on Daily<-100
Holding period: Few days to many months
Pyramiding your winners should be considered to make your winners big. I'll write a post on this topic in the future. 3/n
Why trade on a multi-timeframe? This is a top-down approach where we observe the larger trend of the stock before we take entries on the smaller or medium trend of the stock. This concept can be compared to tides in the sea. 4/n
A larger wave in the sea will overpower the smaller waves, no matter what, simply because the larger waves have more velocity and force. In a similar way, a stock trending in the larger TF will overpower the smaller TF trend and will finally take the stock price higher. 5/n
While trading this strategy we presume this will work & buy stock in the shorter TF just when the larger TF is showing bullishness. This ensures we are in the right direction. In case the stock reverses, we exit based on the stop loss or based on the exit criteria. 6/n
Not to mention, this is NOT a holy grail strategy but helps one catch the shorter TF trend very well. You WILL have losing trades. So, it is important to consider proper position sizing and assess your risk before entry. Let's look at examples now. 7/n
Ex: SBIN & Reliance. The larger trend turned bullish. So, we enter just above the weekly high and hold on until the stop hits or exit criterium is met. Note that by buying just above the high, you skip that initial short term downtrend or you might even skip many bad trades8/n ImageImage
Ex: Axis Bank and Maruti. Once the CCI daily goes below -100, you need to exit the next day at open. You never know how deep the stock can correct. 9/n ImageImage
Ex: Bajaj Finance and HDFC Bank - Good Profits. You never know much a stock can rally. So, identify a strategy that can keep you in the trade for as long as possible. Remember, 80% of your profits come from such 20% of trades. Such trades make up your PnL in the long run 10/n ImageImage
Do run this strategy over many stocks to understand it better before you take any trades. #CCI #Tradingideas #shortterm #Positional #Multitimeframe #Tradingstrategy @pachisia_sourav here you go!

• • •

Missing some Tweet in this thread? You can try to force a refresh
 

Keep Current with Trendline Investor

Trendline Investor Profile picture

Stay in touch and get notified when new unrolls are available from this author!

Read all threads

This Thread may be Removed Anytime!

PDF

Twitter may remove this content at anytime! Save it as PDF for later use!

Try unrolling a thread yourself!

how to unroll video
  1. Follow @ThreadReaderApp to mention us!

  2. From a Twitter thread mention us with a keyword "unroll"
@threadreaderapp unroll

Practice here first or read more on our help page!

More from @dmdsplyinvestor

Sep 30, 2023
A FREE Comprehensive Technical Analysis course with...

✅ 9 Modules
✅ 42 Lessons

Protect your hard-earned money & make it grow!🏆

Read on🧵... Image
I. Introduction to Trading Concepts

1. Tradingview for Charting


2. All about Candlesticks


3. Log vs Linear charting


4. All About Trendiness


5. Support & Resistances


6. Best Timeframe to use

Read 15 tweets
Sep 24, 2023
Technical Analysis 101🎯

6 Powerful & Simple Price action strategies...📉

...to easily spot the Beginning/End of an UpTrend/Downtrend

...in all timeframes & Markets!💹

Ready to Learn?🤓
Let’s go…🧵 Image
1 -> A Trend Persists until Its Reversal Is Indicated

- In Dow Theory, a trend is assumed to persist until there is evidence to the contrary

- Trend changes are identified by a penetration of a previous significant High or Low
2 -> How to identify the end of an uptrend?📈

There are basically 3⃣ types of reversal formations that will signal a change in the direction from uptrend to downtrend

✅ Failure Swing
✅ Non-Failure Swing
✅ Double Top sell

Let's look at them in detail!👀

Save this Image👇 Image
Read 14 tweets
Sep 3, 2023
MY TRADINGVIEW SETUP - Explained! 🧵

In this 🧵, I cover
- Indicators I use in Tradingview
- Settings for the indicators I use
- Why do I use these Indicators & Settings

Ready to know what I use?...

Let’s go...😃 Image
1 -> Commodity Channel Index(CCI) Indicator to assess Bullishness

- In short, it is a momentum indicator
- Above 100, indicates bullishness
- Below -100, indicates bearishness

If you do not know what CCI indicator is, watch this video 👇
1.1 -> Which CCI indicator to use in Tradingview? 😅

- Search for the inbuilt Commodity Channel Index in 'Technicals' section

- Go to settings -> Inputs -> Length - change this to 34 from default 20

Refer to this video for details👇
Read 12 tweets
Aug 26, 2023
Fake breakouts & how to navigate them!🤔

A detailed thread!🧵
1⃣ Cardinal rule: Stop chasing breakouts...

- If everyone is talking about it on social media and it has already broken out
- If a stock has moved up already for the last few days
- If a stock is up more than 10% already from breakout zone
- If your SL is deep Image
2⃣ Enter only on breakout & nowhere else if you're trading breakouts...

Buy only…
- above breakout zones (no entry in no-man land)
- above a key resistance zone after a stock consolidates
- 1-2% above resistance zone
- Identify entry points(set alerts on TV/set GTT in zerodha) Image
Read 9 tweets
Aug 17, 2023
Stan's Secret to Identify Multibaggers!🤫

'The Triple Confirmation Pattern'!

Ready to Learn?🤓

Let's go...🧵 Image
This Pattern can help one spot potential Multibaggers!

I'll discuss the following in this thread...

✅ 5 easy-to-follow rules
✅ Essential indicators to use
✅ Scanners to use
Rule 1: Weekly Price must be above the 30 week Moving average(MA)💹

- Why 30? It is just a number & considers last 30 weeks

- Try to consider at least 6 months/26 weeks. With EMA, long term trend changes are easy to spot

- You can use simple MA/EMA/WMA as well Image
Read 11 tweets
Aug 12, 2023
A FREE Comprehensive Technical Analysis course with...
✅ 8 Modules
✅ 40 Lessons

Protect your hard-earned money & make it grow!🏆
Read on🧵... Image
I. Introduction to Trading Concepts

1. Tradingview for Charting


2. All about Candlesticks
https://t.co/Uk9gdwWqSZ

3. Log vs Linear charting
https://t.co/Rwu5uhXKsB

4. All About Trendiness
https://t.co/h6UB9sbSmv


5. Support & Resistances


6. Best Timeframe to use
https://t.co/hb4H7MCcyh
Read 15 tweets

Did Thread Reader help you today?

Support us! We are indie developers!


This site is made by just two indie developers on a laptop doing marketing, support and development! Read more about the story.

Become a Premium Member ($3/month or $30/year) and get exclusive features!

Become Premium

Don't want to be a Premium member but still want to support us?

Make a small donation by buying us coffee ($5) or help with server cost ($10)

Donate via Paypal

Or Donate anonymously using crypto!

Ethereum

0xfe58350B80634f60Fa6Dc149a72b4DFbc17D341E copy

Bitcoin

3ATGMxNzCUFzxpMCHL5sWSt4DVtS8UqXpi copy

Thank you for your support!

Follow Us!

:(