My Authors
Read all threads
Week 6 NHS Test & Trace data.

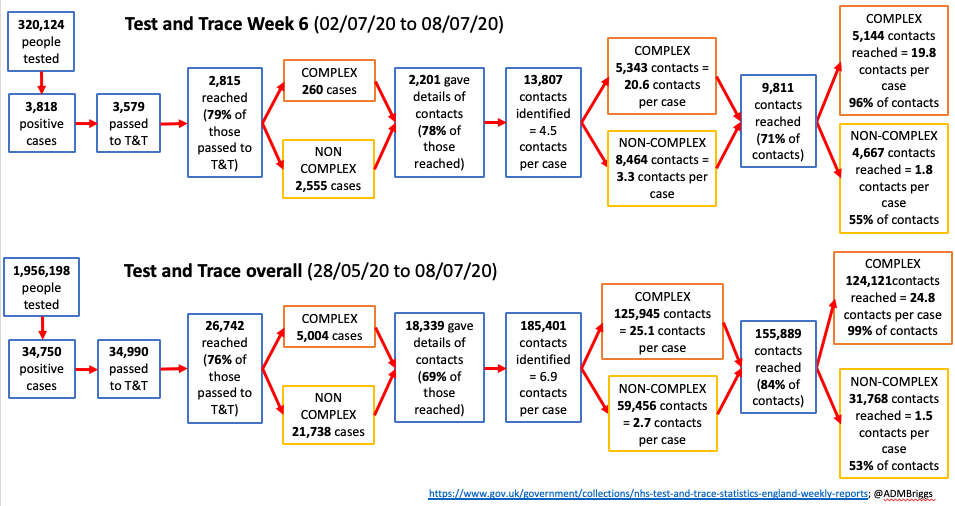
Headline data in picture

Detail in thread 👇

gov.uk/government/pub…
As always, definitions

Pillar 1 = testing in PHE labs/NHS hospitals for those with clinical need and in high risk settings like care homes & hospitals
Pillar 2 = testing for the general public like home kits, drive-through etc.
Complex cases = outbreaks and cases involving high risk settings like care homes and hospitals. Cases and contacts managed by ‘tier 1’ - local/regional PHE health protection teams, bringing in local authority colleagues where necessary.
Non-complex cases = everything else, cases managed by tier 2 call handlers, contacts managed by tier 3 (this is where most of gov recruitment has been focused)

Note – wk 6 figures will be revised slightly as delayed data come through.
Week 6.
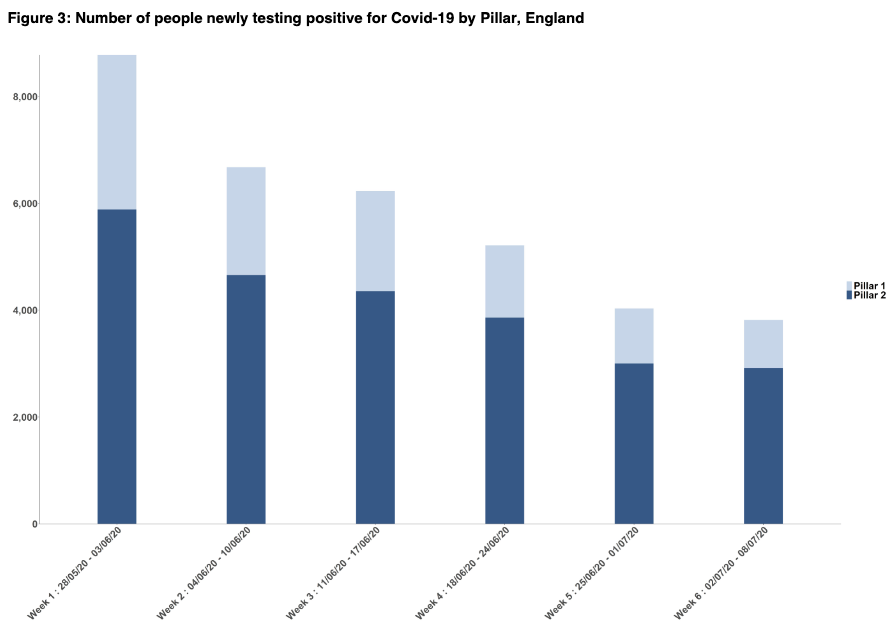
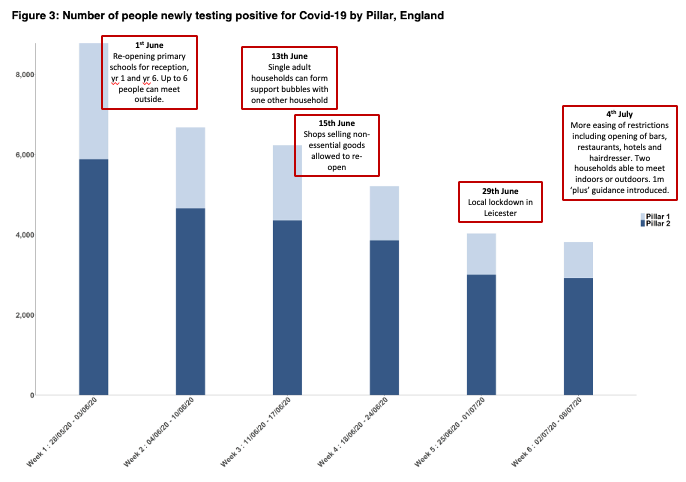
From 2st July-8th July, 320,124 people tested and 3,818 positive – 1.2%.

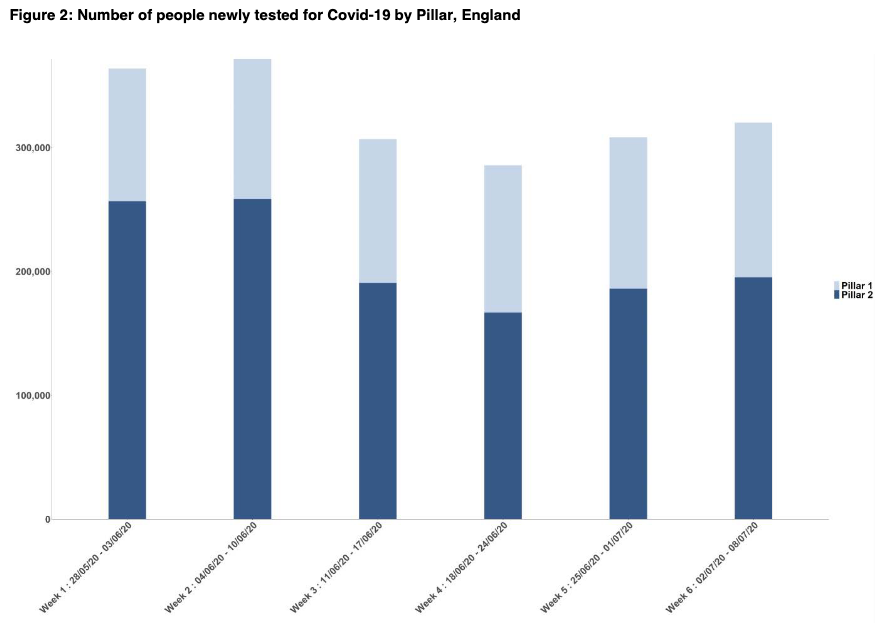
Trends in figures below. Numbers of test increasing, number positive declining, but rate of decline slowing.
Number of tests in both pillars increasing, esp in pillar 2. Percent positive declining due to combination of less virus circulating and more tests being done.
ONS COVID survey data update not available at time of writing.

Data to 5th July suggest around 1,700 (confidence intervals 700 to 3,700) new community cases a day, compared to and avg 417 new community cases/day through T&T. Same as last week.

ons.gov.uk/peoplepopulati…
Lack of information about time from symptom onset through to contacts being traced is getting increasingly important to know how effect T&T is.
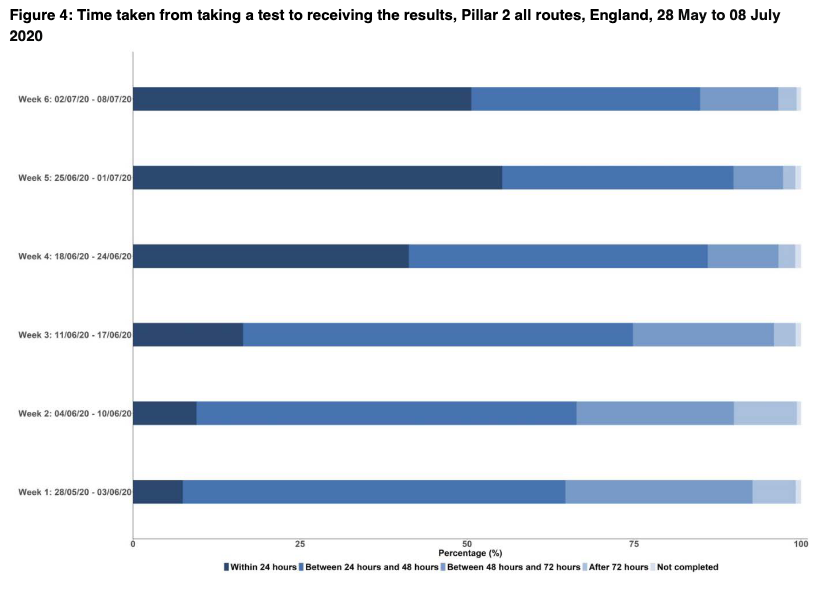
NHS T&T report timing broken down into three stages.
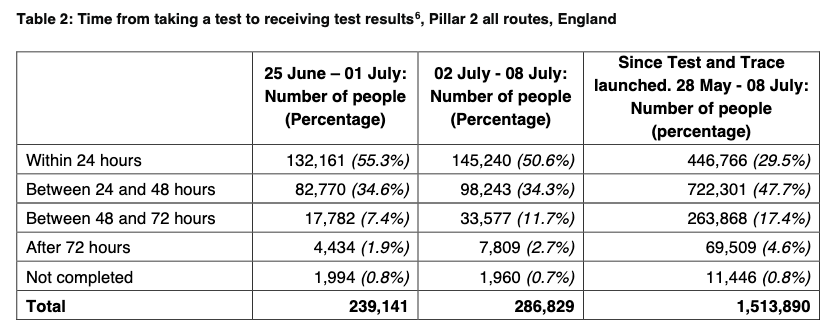
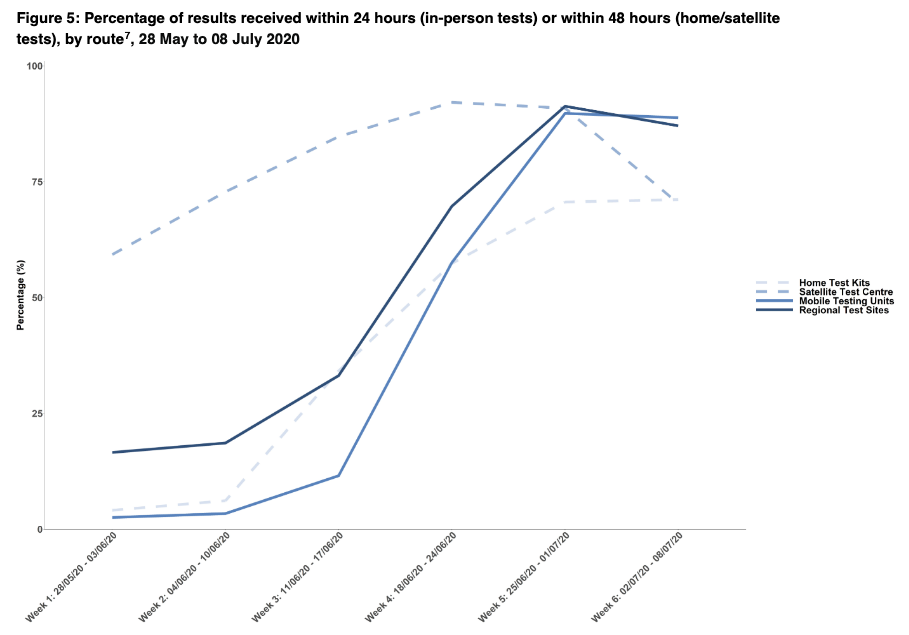
1. time from requesting test to result for regional & mobile test sites and time from receiving a test to result for home test/satellite
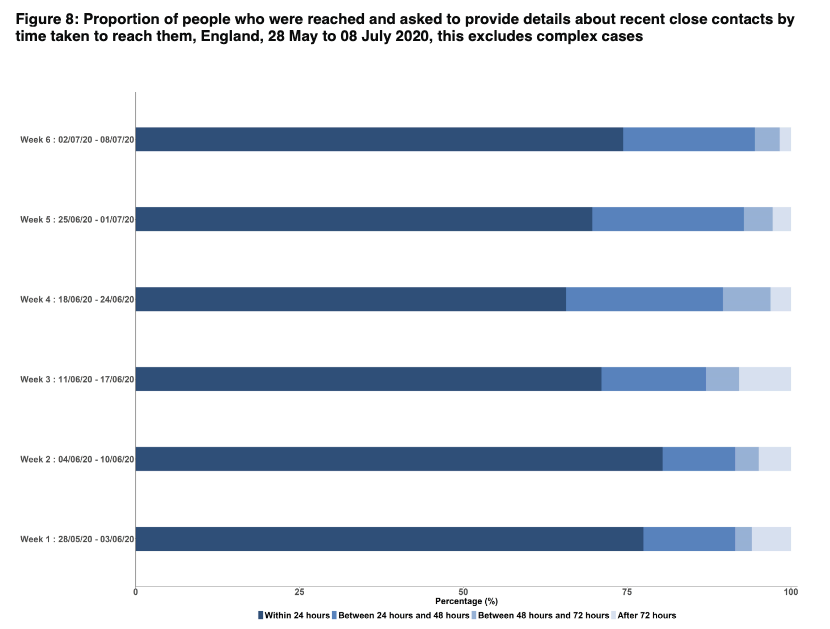
2. time from result to being contacted by T&T
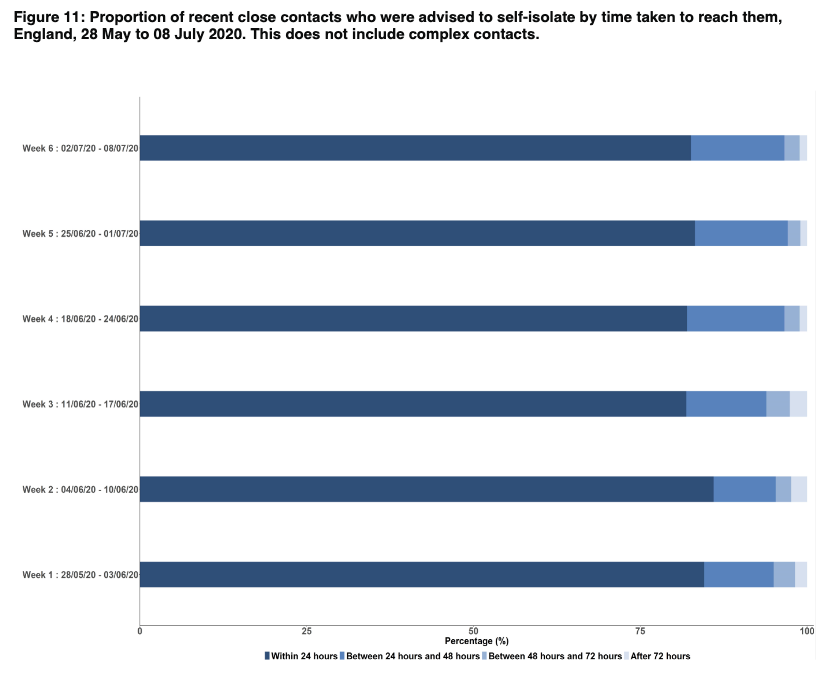
3. time from contacts being identified to being contacted
1. More tests done but %age getting results <24hrs from time of test & within 48 hrs worse this wk.
Due to drop in performance of satellite centres - when kits are sent to places like a hospital or care home with some kind of urgent need. This wouldn’t affect community testing.
2. Next bit is time from result to contact by T&T. This is getting better and 95% within 48hrs (non-complex only).
3. And then finally time from contacts being identified to being contacted. Staying approx. the same at 80% within 24hrs (non-complex only)
-Problem is that you can’t link cases to see how long from beginning to end (minimum will be 2-3 days)
-Lack of data on timing for complex cases & contacts is more frustrating. This data key to understanding effectiveness of T&T.
-timings at <24hr intervals would also be helpful.
Back to cases.

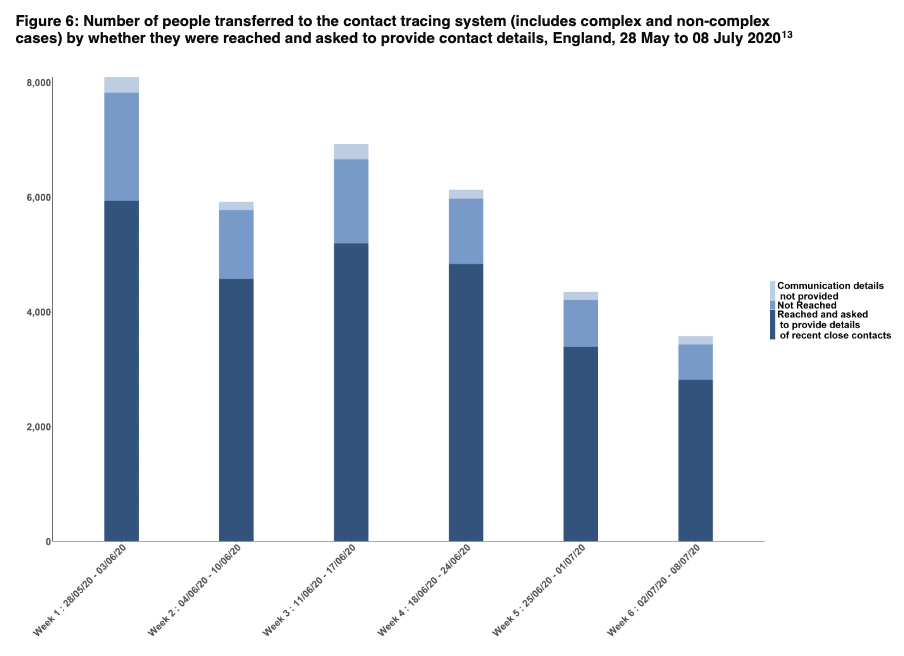
Of 3,5759 positive, 2,815 transferred to T&T.

For first time, fewer than total cases. Seem to have caught up previous weeks’ cases coming on system. Delays b/w test & getting on to T&T likely main reason why fewer transferred than +ve. Will get revised upwards.
Of those cases transferred to T&T, 2,815 were reached and asked about contacts - that's 79%.

78% the week before. See fig.
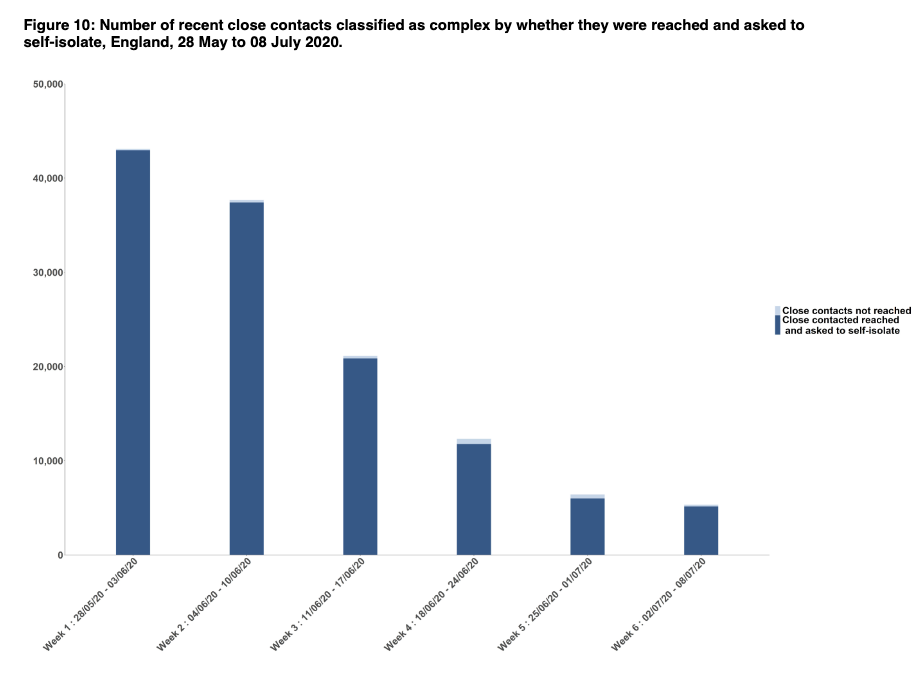
Of those reached – 260 were complex

1,682 in wk 1 -> 1,129 in wk 2 -> 886 in wk 3 -> 645 in wk 4 -.> 402 wk 5

That's 28% of cases in wk 1, 25% in wk 2, 17% in wk 3, 13% in wk 4, 12% in wk 5, 9% in wk6
(note revisions of numbers upwards from past weeks’ estimates – some will be due to cases escalated from T2 to T1 – initially managed as non-complex, then found to be complex. Implications for effectiveness/timing of tracing contacts).
Number of non-complex cases that are reached has dropped significantly as number of cases in T&T drops, but represents growing proportion of total cases.

4,251 in wk 1 -> 3,444 in wk 2 -> 4,304 in wk 3 -> 4,191 in wk 4 -> 2,983 in wk 5->2,555 wk 6
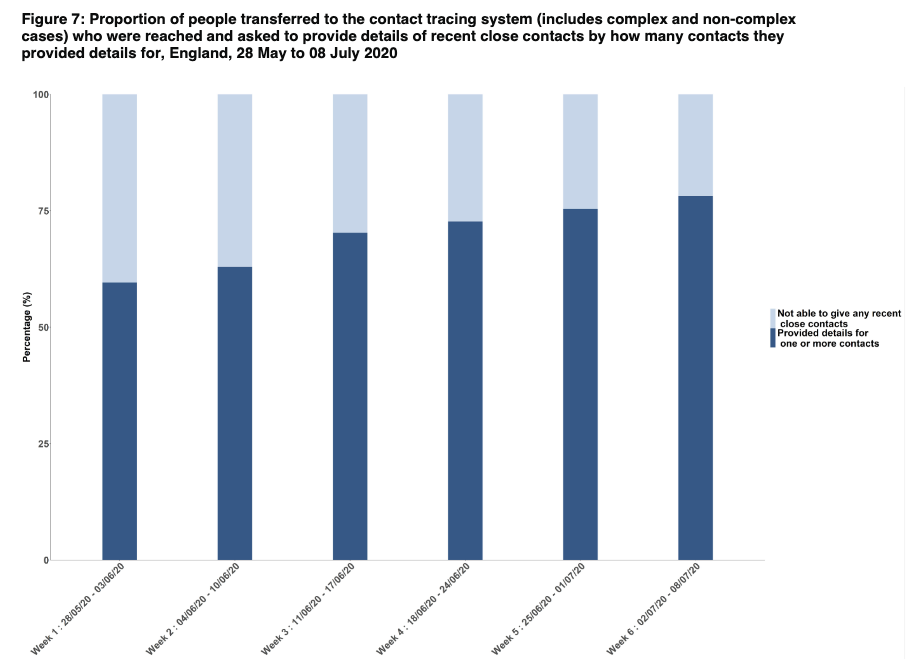
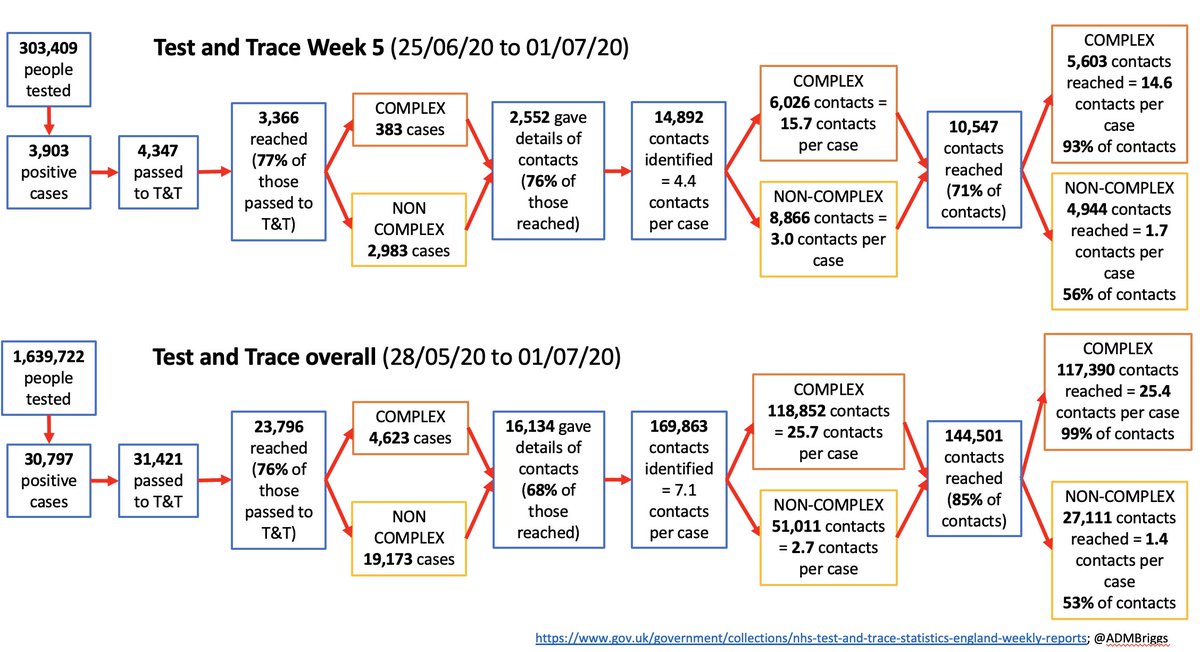
Of those 2,815 cases who were reached, 2,201 (78%) gave details of one or more contact.

This is up from 76% last week, and up from 60% in wk1
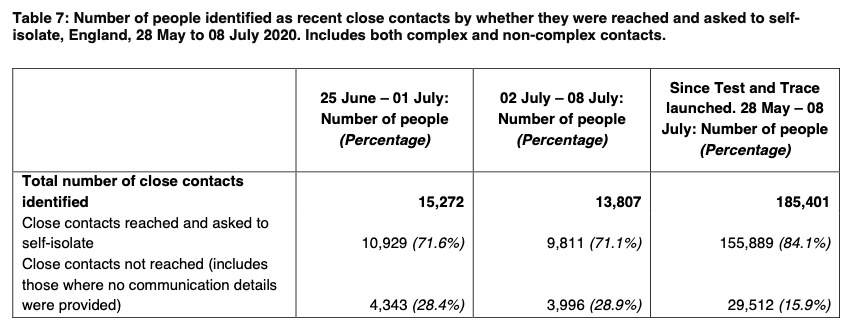
In terms contacts reached, T&T report that 13,807 contacts were identified, and 9,811 reached.

That’s 71%, down from 91% in the first two weeks, 83% in wk 3, 74% in wk 4, 72% wk 5.
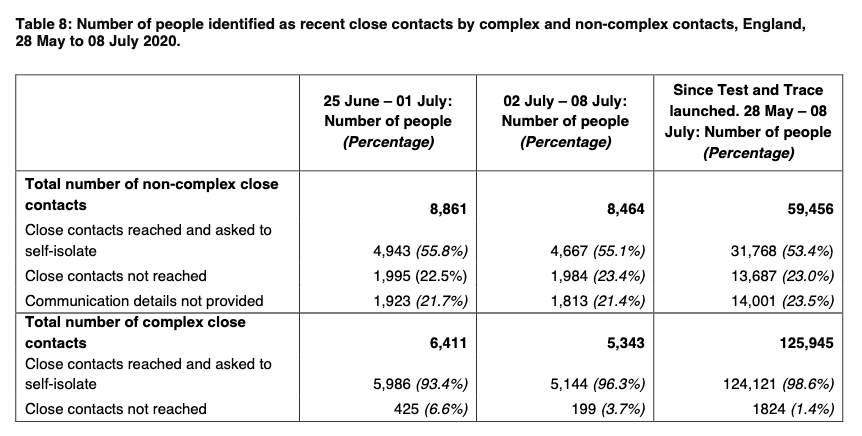
For complex: 96% of contacts reached – 5,144 out of 5,343 (93% the week before)
For non-complex: 55% of contacts reached – 4,667 out of 8,464 (56% the week before)
Small fall in overall percentage of contacts reached mainly due to increased proportion of non-complex cases, likely plus some better contact tracing/more contacts/recording of data for complex cases.
Overall contacts per case is 4.9, up from 4.5 last week (compared with 9.0 in wk 1; 10.2 in wk 2; 6.2 in wk3; 5.1 in wk4).
If complex – 5,343 contacts identified, fall from 6,411 the wk before, and from 12,311 the week before that.

Contacts per complex case is 20.6. Much higher than 15.9 wk before and similar to 19.1 in wk 4. Note not much by way of revisions in these numbers from previous weeks.
Why more contacts per case?
-better contact tracing?
-different settings included (more larger settings)?
-different ways of recording data?
-more people gathering in workplaces without social distancing/PPE?

Need data on contacts by setting to figure out where to focus efforts.
Total contacts identified per non-complex case continues to creep up, now 3.3 compared with 3.0 in wk 4.

And now the contacts reach per case also rising, now 1.8 (from 1.7 previous week)

Hopefully this represents better reporting rather than worse social distancing.
Overall,
-fewer cases going to T&T wk on wk but rate of decline slowing
-continuing sig decline in complex cases
-79% of cases reached, bit better than wk 5
-78% of these gave details of a contact. Better than wk 4
-71% of contacts reached – bit worse than wk 4
-number of contacts per case rising for both complex and non-complex.
-in complex settings hard to interpret and act without more information about settings
-data on timings is really important, but can’t get clear picture from what’s presented.
Put some key dates over the data here to see how policies might reflect in the data. Nothing obvious because:
-7-14 day lag before cases come through
-much more important to do this at local level (why LA data so so important)
-better done on daily scale (that's for another day)
Again, always, 2m where you can, wear a mask, and isolate if you're asked to.

66 deaths recorded by gov today so far.
Missing some Tweet in this thread? You can try to force a refresh.

Keep Current with Adam Briggs

Profile picture

Stay in touch and get notified when new unrolls are available from this author!

Read all threads

This Thread may be Removed Anytime!

Twitter may remove this content at anytime, convert it as a PDF, save and print for later use!

Try unrolling a thread yourself!

how to unroll video

1) Follow Thread Reader App on Twitter so you can easily mention us!

2) Go to a Twitter thread (series of Tweets by the same owner) and mention us with a keyword "unroll" @threadreaderapp unroll

You can practice here first or read more on our help page!

Follow Us on Twitter!

Did Thread Reader help you today?

Support us! We are indie developers!


This site is made by just two indie developers on a laptop doing marketing, support and development! Read more about the story.

Become a Premium Member ($3.00/month or $30.00/year) and get exclusive features!

Become Premium

Too expensive? Make a small donation by buying us coffee ($5) or help with server cost ($10)

Donate via Paypal Become our Patreon

Thank you for your support!