
NEW PAPER: Some insurance plans increase beneficiary mortality, but consumers (mostly) can’t tell which ones. Getting rid of the worst 5% of Medicare Advantage plans could save 10,000 lives/year …d1a-wp-offload-media.s3.amazonaws.com/faculty/wp-con… (w/ @autoregress, @AmandaStarc1, and @mmcaceresb 
Key point: health economists need to change the way we think about health insurance plans. Premiums, out of pocket costs, risk aversion, and adverse selection are all important. But *which plans reduce your chance of dying* is more important (given VSLs)
We show (i) there is large variation in MA causal mortality effects (ii) these effects are *uncorrelated* with existing quality ratings (iii) better plans spend more, but this accounts for little variation, and (iv) consumers massively underrespond to mortality effect differences
Finding (iv) is not surprising given findings (i)-(iii): plan mortality rates are not publicly available, so beneficiaries may have no good way of judging which plans are likely to improve their health
Two methodological contributions. We derive an IV framework for estimating the relationship between true causal effects and plan attributes like observed mortality rates or premiums. This could be applied widely (effects of hospitals/doctors/teachers/schools/managers…)
We also show how one can combine our IV framework with a discrete choice inversion (a la @steventberry) to estimate consumer willingness to pay for (unobserved) causal effects. This can be used to evaluate whether choices are well-informed given an external standard (e.g. a VSL)
Our setting is the Medicare Advantage market, with private insurance plans chosen by elderly Americans. About 1/3 of Medicare beneficiaries choose Medicare Advantage plans over "Traditional Medicare" (a public plan)
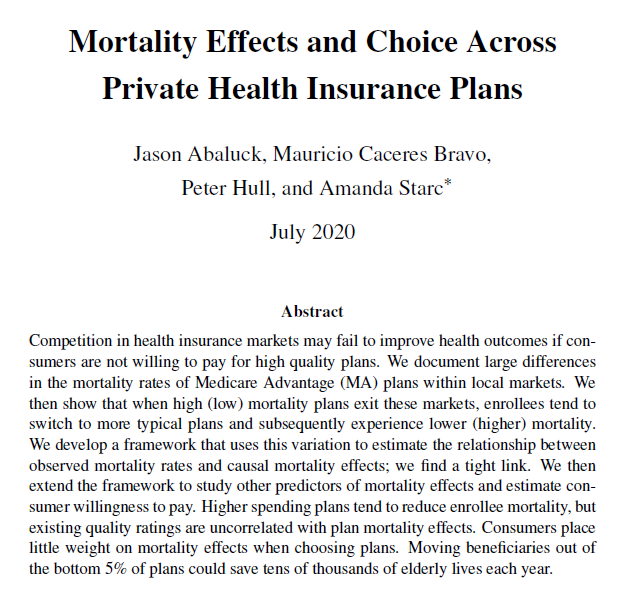
MA plans have very different one-year mortality rates, even adjusting for demographics and statistical noise. The within-county standard deviation of plan mortality rates is 0.9 percentage points, on a base of 4.7 percentage points
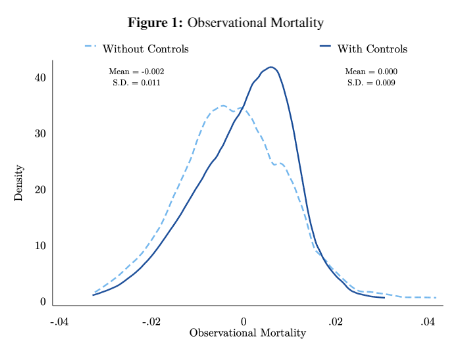
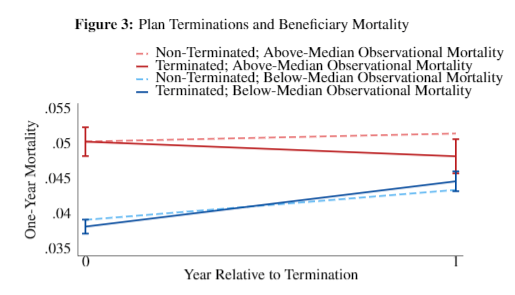
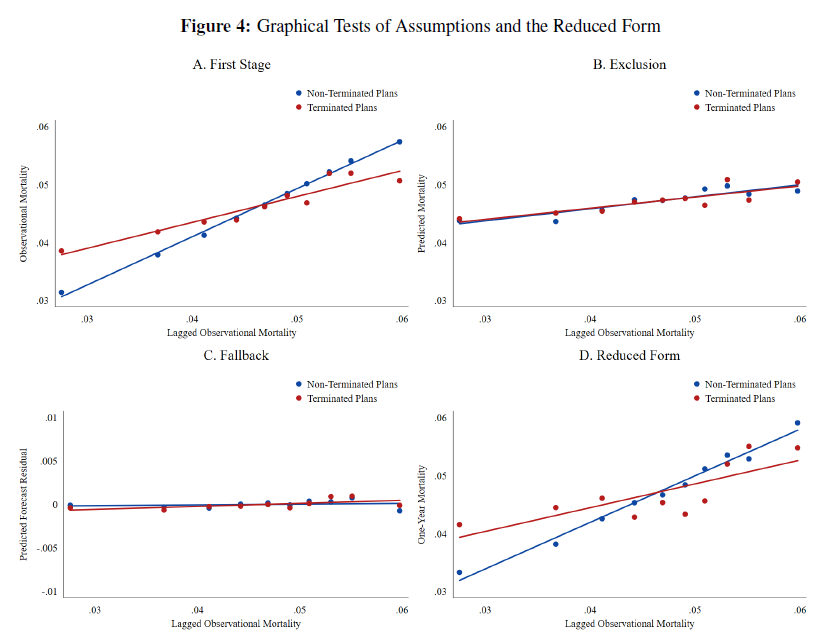
We test whether this reflects causal effects by constructing IVs from plan terminations. Terminations push people from high- or low-mortality plans to more average plans. Do we see that this changes actual beneficiary mortality by a similar amount?
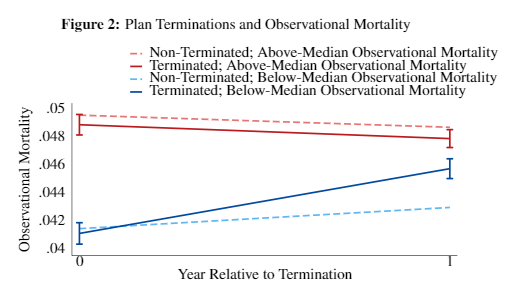
We do. If your bad plan is no longer available, you die less. If your good plan is no longer available, you die more
We give conditions for using this variation to recover a “forecast coefficient” – the regression of (unknown) causal effects on the (observed) mortality rates of plans. This regression can tell us how variable true effects are and how predictive observed rates are
You need an IV first-stage and exclusion restriction, as always. But we show you also need a new assumption, which we call the “fallback condition.” This is because even when plan terminations are randomly assigned, subsequent (“fallback”) plan choices are endogenous
This is a general issue when estimating “forecast coefficients”: when teachers are randomly assigned to schools (a la @John_N_Friedman), classroom allocation may be endogenous. When patients are randomly assigned to ambulances(a la @johngraves9), hospital choice may be endogenous
The paper gives a discrete choice microfoundation of the fallback condition in our setting, which nests most empirical IO choice models. We also derive new tests for the condition based on observable characteristics of fallback plans
We verify that our instrument is balanced on a) lagged plan mortality, b) predicted enrollee mortality, c) predicted unobservables of “fallback” plans.
We show that the pattern illustrated above isn't just about above vs. below median. Lagged (plan) mortality predicts individual mortality in the coming year when plans don't terminate. Lagged mortality is much less predictive for terminated plans.
The “forecast coefficient” is 1--mortality rate differences predict causal effects 1-1. This doesn’t mean there is no selection: some plans are chosen by sicker people and some by healthier people. But we can predict which plans are better *on average* from observed mortality.
Our method also let us recover the regression of (unobserved) causal effects on other (observed) plan characteristics, like MA star ratings and premiums (or mean utilities recovered from market shares).
We find that higher spending plans have better outcomes. We also have suggestive evidence that provider networks might account for a large share of variation, though we lack good network data (we have some ideas in progress for constructing provider networks...)
Using the same IV framework, we can also relate causal effects to consumer demand (market shares) and thus recover the willingness to pay for causal mortality effects. We get a WTP estimate of $200 for a 1 percentage point reduction in one-year mortality
That is too small by about 2 orders of magnitude relative to a usual VSL. i.e. consumers (mostly) can’t tell which plans are better for their health. The fact that it is non-zero still implies choices are better than random (a la @asacarny @amitabhchandra2 for hospitals)
Finally, we use simulations to assess the benefits of assigning people to better quality plans. If we could (somehow!) take people in the top quartile of observational mortality and move them to the bottom quartile, it might save over 100,000 lives a year
This is not really realistic due to capacity constraints. Getting rid of the worst 5% of plans is probably more realistic, and could save 10,000 lives per year. Given elderly VSLs, this could generate a value of about $10,000 per reassigned beneficiary-year
My provisional policy recommendations:
a) CMS should release risk-adjusted mortality info
b) CMS should pay for risk-adjusted mortality rather than star ratings
c) CMS should audit bad plans
d) Integrate health insurance and life insurance (@SVNieuwerburgh and @robinhanson)
a) CMS should release risk-adjusted mortality info
b) CMS should pay for risk-adjusted mortality rather than star ratings
c) CMS should audit bad plans
d) Integrate health insurance and life insurance (@SVNieuwerburgh and @robinhanson)
"My" because my co-authors don't necessarily endorse all points. "Provisional" because much more work is needed to understand how insurers might game a) and b) a la conventional risk adjustment (all policy recommendations are provisional, some more provisional than others).
Research-wise, people who study health plan choice like those rubes “Abaluck and Gruber” often do things like find settings where networks are held fixed. Or, like Ho and Lee, they use revealed preference to value networks (onlinelibrary.wiley.com/doi/abs/10.398…)
A new approach is needed: we need to estimate which types of networks help people live longer and why. We plan to do so in follow-up work, but this is a big area with room for many papers investigating why some plans help people live longer.
For more info: watch me present the paper at the NBER Health Meetings on July 23rd (Thursday!) at 12 pm ET (conference.nber.org/sched/SI20HC). Or, even better, invite one of us to come give a seminar!
Actually, this talk is at 1 pm EST! nber.org/si2020livestre… (Health)

