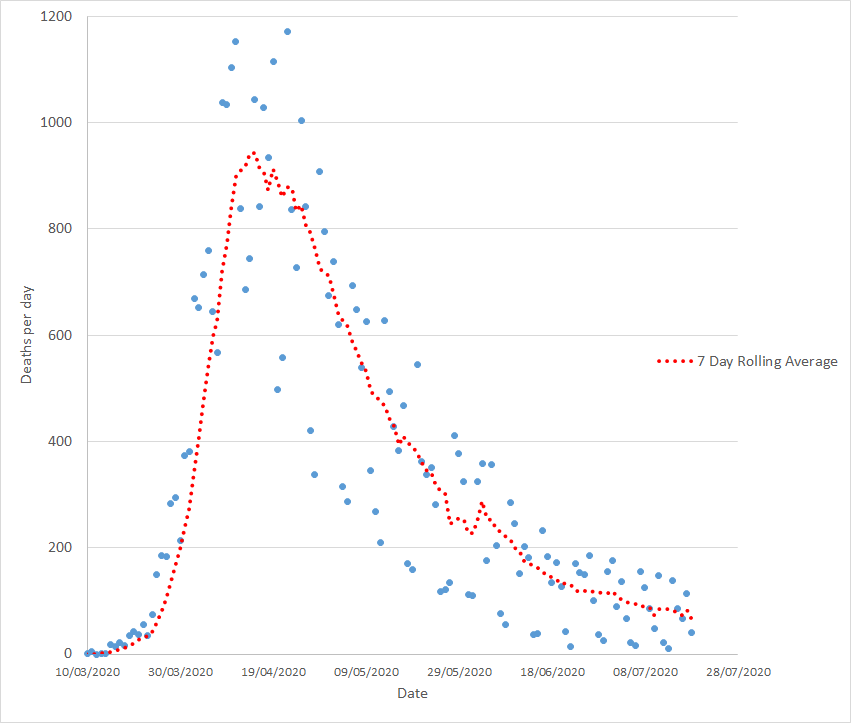
So after a couple of better looking days, Fridays data was horrible. We remain, well, in trouble. Here's the overall graph of Covid-19 deaths in the UK after 114 reported fatalities yesterday (1) 

We're static. Bluntly. Death total has been effectively static for 9 days, trending down some days and back up on others (2)

And if that isn't convincing, here's the rolling 7 day total (3)

Working out R (infection rate) 23 days back, the average day for todays poor buggers who died to have caught it, again smoothing out over 7 days, its above 1. And the trend is worryingly upwards (4)

Last Fridays figure was well under trend, as I feared. The weekly 7 day total is up A LOT due to this. (5)

The rather cruder measures are terrifying. The 23 day trend (I was using this as a proxy) for R, simply dividing a days total by 23 days previously and averaging over 7 days, has risen hugely (6)

...and we desperately need to see this going down. The brute-force 7 day total divided by the previous days still flirts with 1 (above which death rate is rising) (7)

To conclude - this is the third time that the fall in deaths from Covid-19 has fallen. On the previous two occasions (caused by VE day weekend, the opening up of lockdown leading to crowding in public spaces) it drifted down again... (8)
...whereas 23 days back from the start of this rise, shops were opening, BLM demo's (and anti BLM/statue removal demos) were happening (9)
...on each occasion we see changes in government policy or public behaviour it is reflected 20-25 days later with a decrease in the rate fatalities are falling, or just by flipping the decline to an increase (10)
...there is now very little time for this decline to revert before any impact of pubs etc. reopening on the death rate. It is difficult to see any scenario in which fatalities will not now rise (11)
The higher the death rate, the higher the level of infection in the community when people caught Covid-19. It is demonstrably true from the death rate data that there has been no step change in deaths due to improved medical care (12)
And it is very clearly true that the rate deaths are falling has stalled, -almost- stopped. The log graph of 7 day totals shows that clearly enough (13)

The higher the level of infection we take into Autumn the greater the risk of a much more severe second peak. We must be demanding, not asking, that our political leaders prioritise reducing infection over all other priorities. And we must demand it be done -now-. Not later. (14)
The space under the lines on these graphs isn't abstract, it directly represents fatalities that the UK, an island nation with control of its borders and immigration, could have avoided -entirely- but chose not to. This is a national scandal and a disgrace. (fin)