New preprint on attraction-repulsion spectrum in t-SNE => continuity-discreteness trade-off!
We also show that UMAP has higher attraction due to negative sampling, and not due to its loss. 🤯 Plus we demystify FA2.
With @jnboehm and @CellTypist.
arxiv.org/abs/2007.08902 [1/n]
We also show that UMAP has higher attraction due to negative sampling, and not due to its loss. 🤯 Plus we demystify FA2.
With @jnboehm and @CellTypist.
arxiv.org/abs/2007.08902 [1/n]
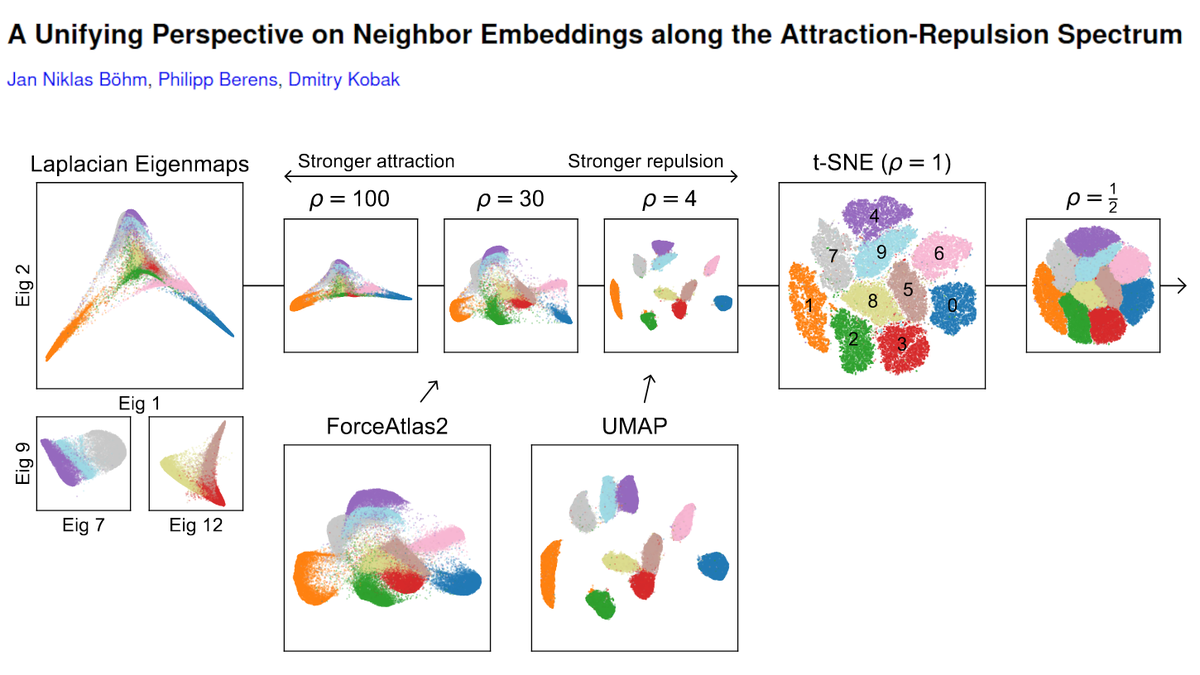
We get the spectrum by changing the "exaggeration" in t-SNE, i.e. multiplying all attractive forces by a constant factor ρ. Prior work by @GCLinderman et al. showed that ρ->inf corresponds to Laplacian eigenmaps. We argue that the entire spectrum is interesting. [2/n]
Stronger attraction preserves continuous manifold structure. Stronger repulsion brings out discrete cluster structure.
Here is a toy dataset with 20 Gaussians arranged on a line, like a necklace. With LE one sees the string. With t-SNE one sees the individual beads. [3/n]
Here is a toy dataset with 20 Gaussians arranged on a line, like a necklace. With LE one sees the string. With t-SNE one sees the individual beads. [3/n]

Across many datasets, UMAP is always similar to t-SNE with ρ≈4. Why?
It must have weaker repulsive forces. But why?
We show that it's due to the negative sampling: it lowers the repulsion. Nik implemented Barnes-Hut UMAP without sampling, and it's waaay over-repulsed. [4/n]
It must have weaker repulsive forces. But why?
We show that it's due to the negative sampling: it lowers the repulsion. Nik implemented Barnes-Hut UMAP without sampling, and it's waaay over-repulsed. [4/n]

We did a lot of ablation experiments and show that other differences between t-SNE and UMAP do not typically matter that much. The characteristic look of UMAP embeddings (compared to t-SNE) is due to the negative sampling. In t-SNE one can get a similar result with ρ≈4. [5/n]
"Our conclusion is that the more condensed clusters typically observed in UMAP compared to t-SNE are an accidental by-product of its neg. sampling strategy, and not a consequence of the cross-entropy loss function itself or the mathematical apparatus of the original paper." [6/n]
What about ForceAtlas2?
People like to use it for developmental single-cell RNA-seq data because it tends to preserve developmental trajectories better than t-SNE/UMAP. See e.g. papers by @KleinLabHMS. We show that FA2 on the kNN graph looks similar to t-SNE with ρ≈30. [7/n]
People like to use it for developmental single-cell RNA-seq data because it tends to preserve developmental trajectories better than t-SNE/UMAP. See e.g. papers by @KleinLabHMS. We show that FA2 on the kNN graph looks similar to t-SNE with ρ≈30. [7/n]
For example, here is a beautiful brain organoid dataset from @TreutleinLab. The original paper used FA2: it clearly captures the developmental axis. We get a similar result with t-SNE with ρ≈30. True for other developmental datasets we looked at. [8/n]
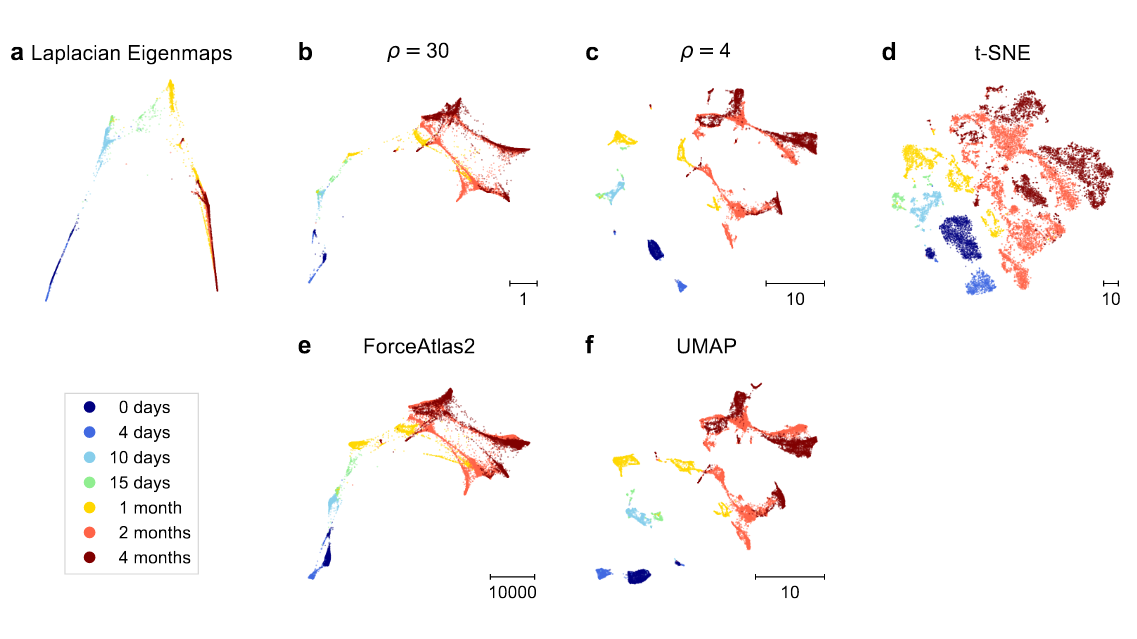
Our explanation is that FA2 has attractive force between kNN neighbors that scales linearly with the embedding distance d. In t-SNE, attraction scales as d/(1+d^2). With very strong exaggeration, distances are small and this becomes ≈d. Hence the similarity. [9/n]
See preprint for more, including many other datasets in the Appendix: arxiv.org/abs/2007.08902 [10/10]