(1) If Hospitalization-to-Infection ratios are fairly constant, then New Daily Inpatients should be proportional to Total Infections.
New Daily Inpatients are a better indicator of total Infections than New Daily Cases.
Infection-to-Case ratios drop as testing increases.
New Daily Inpatients are a better indicator of total Infections than New Daily Cases.
Infection-to-Case ratios drop as testing increases.


(2) Here's the bottom line:
Even though current Daily Cases are 3X what they were during the Northeast outbreak,
Current Daily Infections are about half of what they were during the NE outbreak.
The ratio of Infections-to-Cases has dropped by ~6X due to increased testing.
Even though current Daily Cases are 3X what they were during the Northeast outbreak,
Current Daily Infections are about half of what they were during the NE outbreak.
The ratio of Infections-to-Cases has dropped by ~6X due to increased testing.

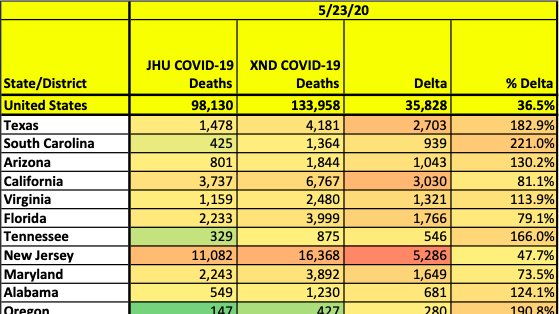
(3) The New York antibody study showed that actual Infections in NY were 7.7 to 10.1 times the confirmed infections between 4/27/20 and 5/2/20.


(4) At that time the Hospitalization-to-Confirmed Case (H/C) ratio was 20-30%.
As testing expanded dramatically the H/C ratio dropped to 10%, and then it dropped precipitously, as testing was expanded to asymptomatic cases and Cases per Test Result lined out around 1.3%.
As testing expanded dramatically the H/C ratio dropped to 10%, and then it dropped precipitously, as testing was expanded to asymptomatic cases and Cases per Test Result lined out around 1.3%.


(5) During the apex, testing uncovered 10-13% of active infections (I), but as I dropped & test volume tripled, testing uncovered 50-60%.
The I/C ratio went from 8-10:1 to 1.3-2.0:1.
"Belief in these truths is your first step on the path to enlightenment."
- Whitesmith C
The I/C ratio went from 8-10:1 to 1.3-2.0:1.
"Belief in these truths is your first step on the path to enlightenment."
- Whitesmith C
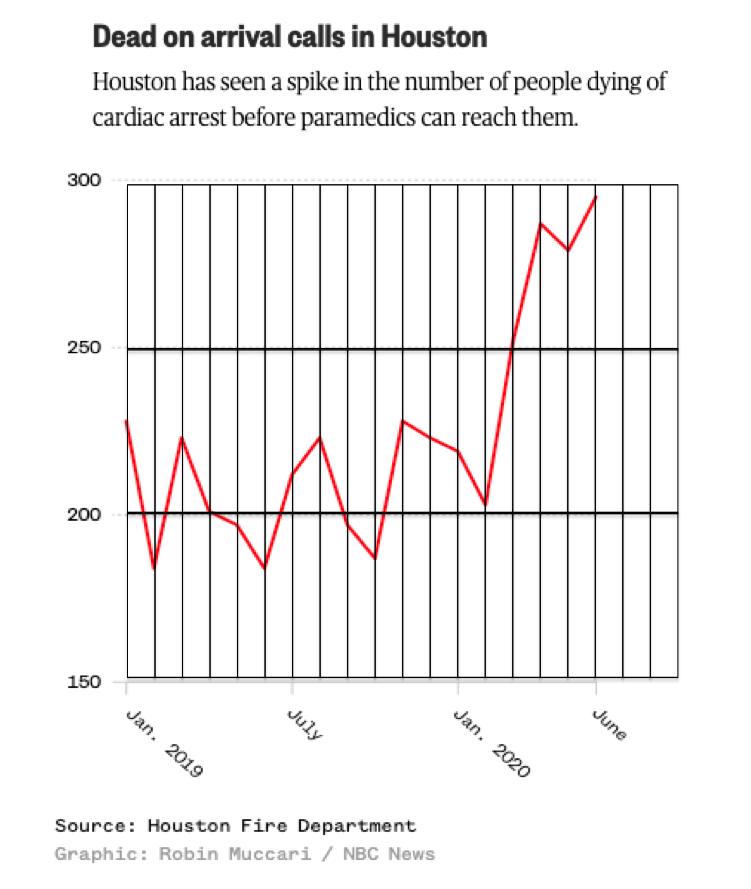
(6) Similarly, the Confirmed Cases plot does a poor job of reflecting active Infections.
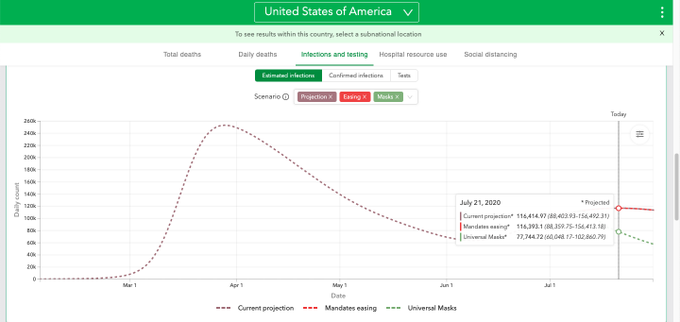
At the time of the NY apex, the active Infections were 240,000 to 300,000. Now they are 85,000 to 130,000.
The NE outbreak apex was twice as high as the current outbreak, on this date.
At the time of the NY apex, the active Infections were 240,000 to 300,000. Now they are 85,000 to 130,000.
The NE outbreak apex was twice as high as the current outbreak, on this date.

(7) The @IHME_UW model captures this fact, projecting a NE apex of 253,000 and a current value of 116,000.
So rather than being 2-3 times worse, it's actually only half as bad.
Of course, half of very, very bad is still very bad.
So rather than being 2-3 times worse, it's actually only half as bad.
Of course, half of very, very bad is still very bad.
(8) The Daily Inpatients count captures these ratios directly and provides a better picture of what the Infections trend actually is.
However, some states only report counts intermittently, causing jumps and down and confounding the trend.
However, some states only report counts intermittently, causing jumps and down and confounding the trend.

(9) I think it's important to correct this misunderstanding.
Too much attention has been paid to the New Daily Confirmed Cases plot, and its values are confounded by testing levels.
We'd be better off focusing on New Daily Inpatient counts; they provide a better answer.
Too much attention has been paid to the New Daily Confirmed Cases plot, and its values are confounded by testing levels.
We'd be better off focusing on New Daily Inpatient counts; they provide a better answer.