With @CDCgov's update to their seroprevalence results across sites in the US, it's possible to see if with increased availability in testing whether we're catching a larger fraction of infections as confirmed cases. 1/13
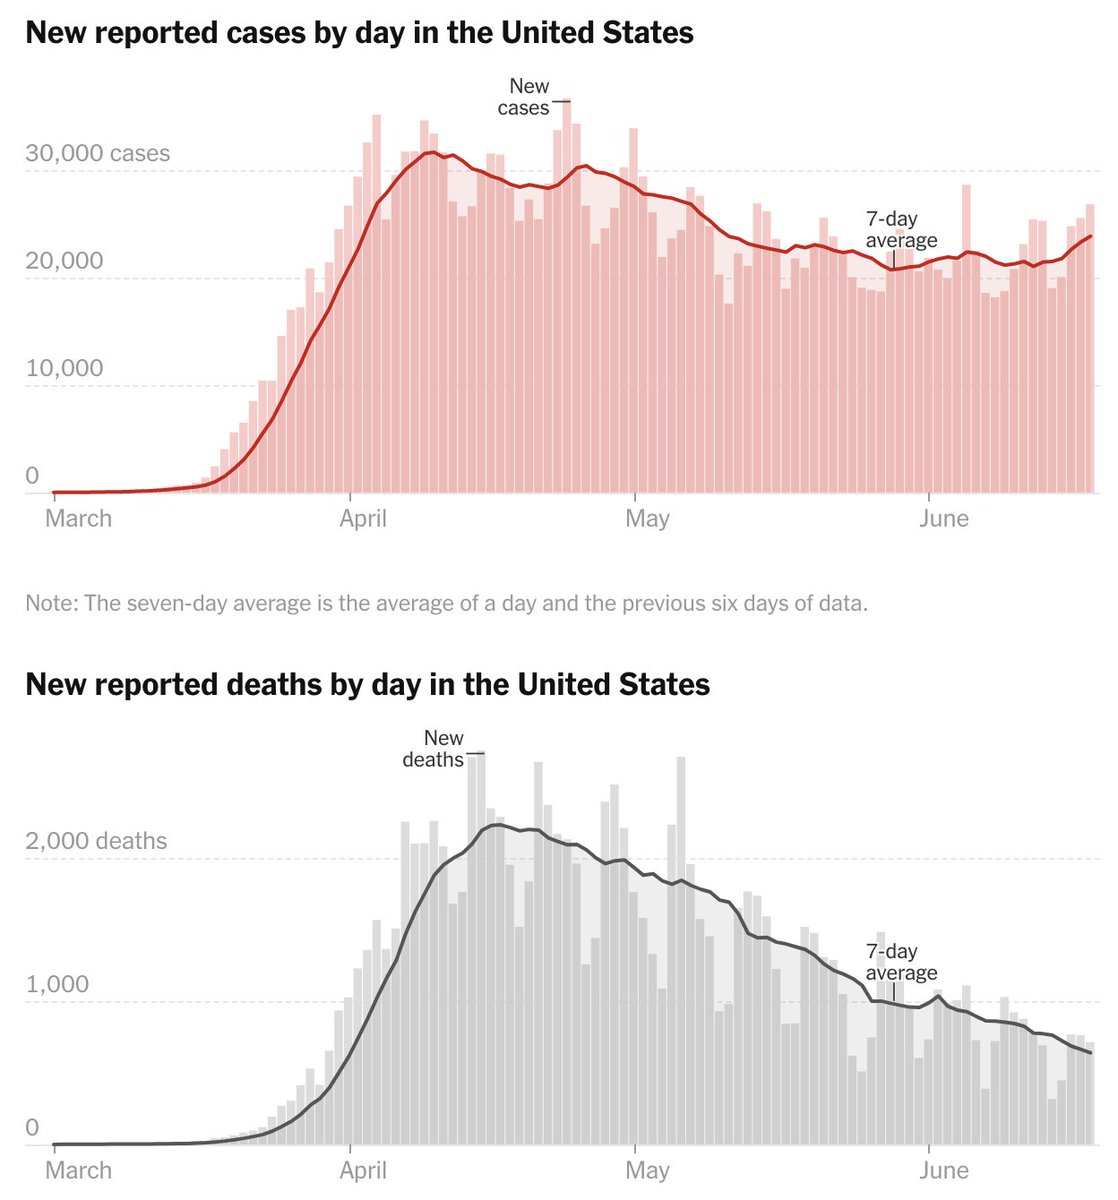
The @CDCgov seroprevalence survey (cdc.gov/coronavirus/20…) tests blood samples from different sites in the US for COVID-19 antibodies. With a serosurvey, it's possible to look at the path of the epidemic in a broader fashion than what's available from PCR assay results. 2/13
By taking multiple cross-sectional samples, it's possible to see the rate at which seropositivity increases. Here I'm replotting data from the CDC dashboard (cdc.gov/coronavirus/20…) to show seroprevalence at 6 sites across 2 different timepoints for each site. 3/13 
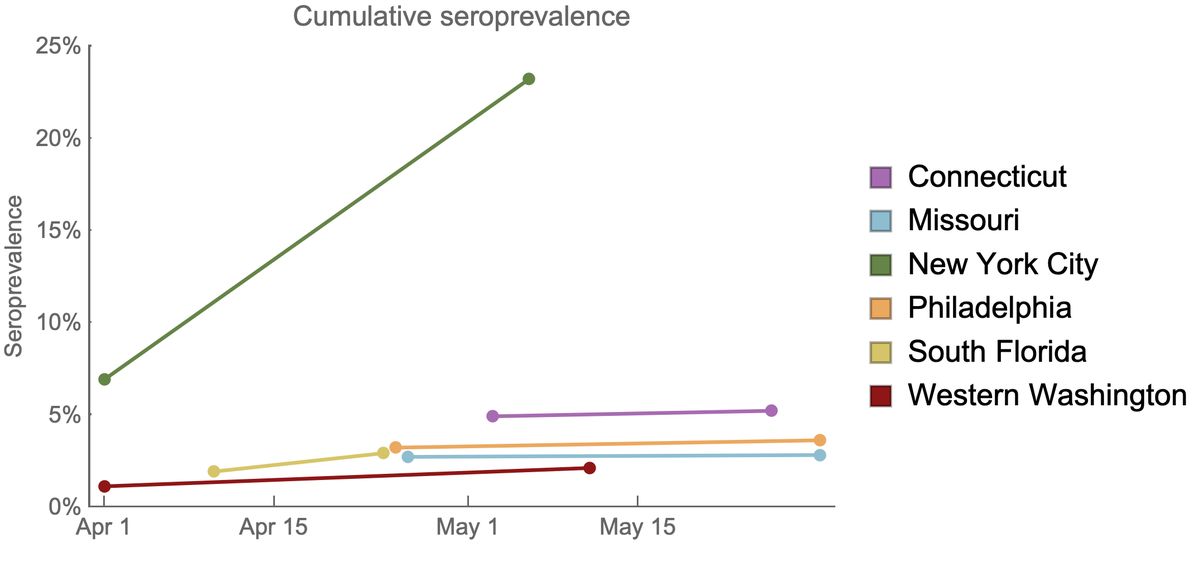
Seroprevalence generally increased during April and May as expected, although is still quite low outside of New York City. 4/13
Additionally, by comparing seroprevalence to total reported positive tests, we can estimate the level of under-reporting from PCR testing. This under-reporting will be from asymptomatic or mild infections where people don't seek testing alongside testing bottlenecks. 5/13
From the first round of serology, the CDC estimate in Havers et al that only about 1 in 10 infections were reported as a confirmed case. jamanetwork.com/journals/jamai… 6/13
Here, I'm showing reporting rate through time and drawing a line between both surveys at the same site. You can see that the infection-to-case ratio decreases through time as testing capacity has increased, indicating that it's probably better than 1 in 10 at this point. 7/13
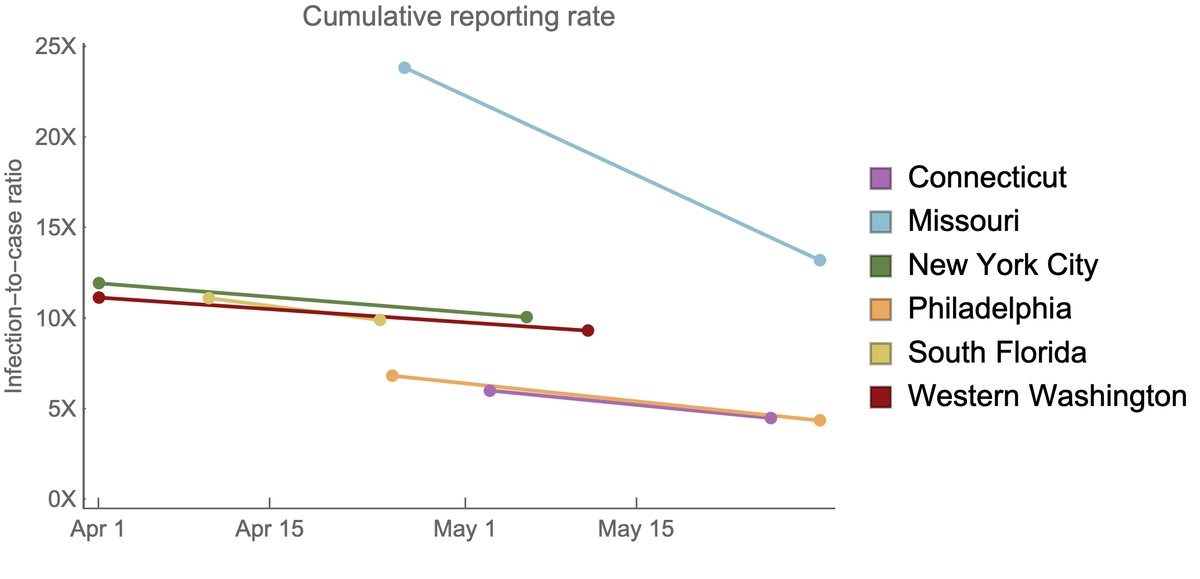
There is an important caveat on timing comparison of seroprevalence to reported PCR tests, where both have delays. But given that it often takes >10 days for reporting as a confirmed case and 10-14 days for seroconversion, I follow the CDC in comparing without a time lag. 8/13
We can also try to look at the incremental change in number of positive PCR tests against the incremental change in seroprevalence going from timepoint 1 to timepoint 2. 9/13
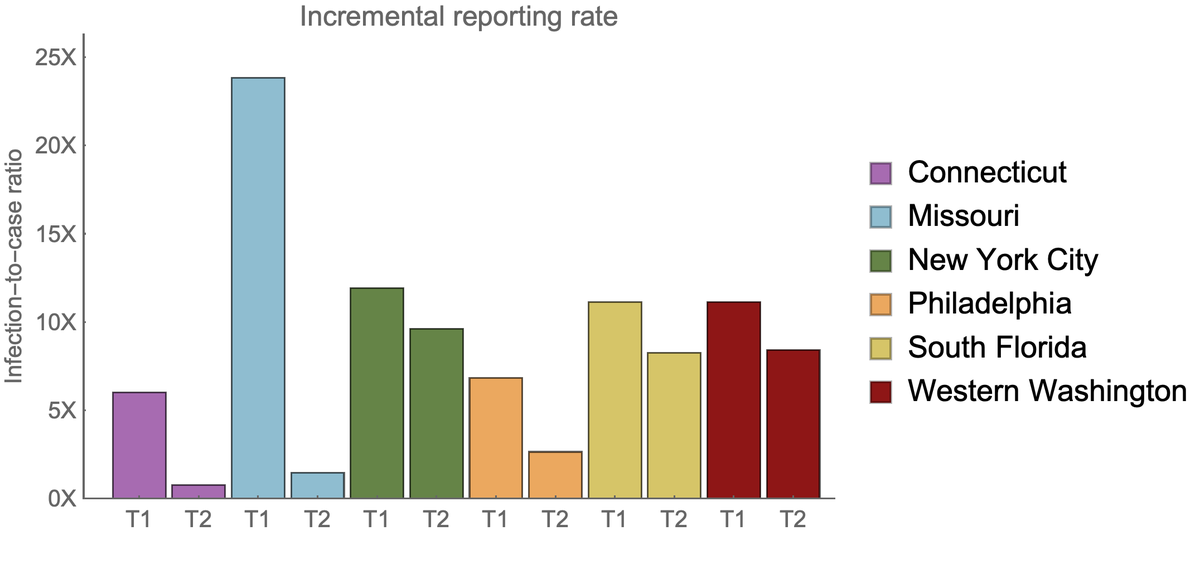
For the first timepoint (roughly representing infections from Jan through April) the infection-to-case ratio averages roughly 12X across sites, while in the second timepoint (roughly infections in April and May) the infection-to-case ratio averages roughly 5X across sites. 10/13
This is a quick analysis that doesn't take into account confidence intervals surrounding the seroprevalence estimates, but is enough to convince me that we're now catching a greater proportion of infections as cases and the infection-to-case ratio is now more like ~5-6X. 11/13
One caution however, this improvement may not exist across the board. With the surge in Arizona, Florida and Texas, testing capacity has become bottlenecked again, which may push the infection-to-case ratio back up to some degree. 12/13
This large-scale multi-site ongoing serosurvey is a fantastic resource and a welcome investment by @CDCgov. 13/13
Follow up #1: I'm less negative here about the convenience sampling basis of the serosurvey, but please see these important caveats about survey design (which I'm assuming is a big part of the reason for apparent variation across sites).