We’ve published updated analysis on #COVID19 deaths by local areas and deprivation.
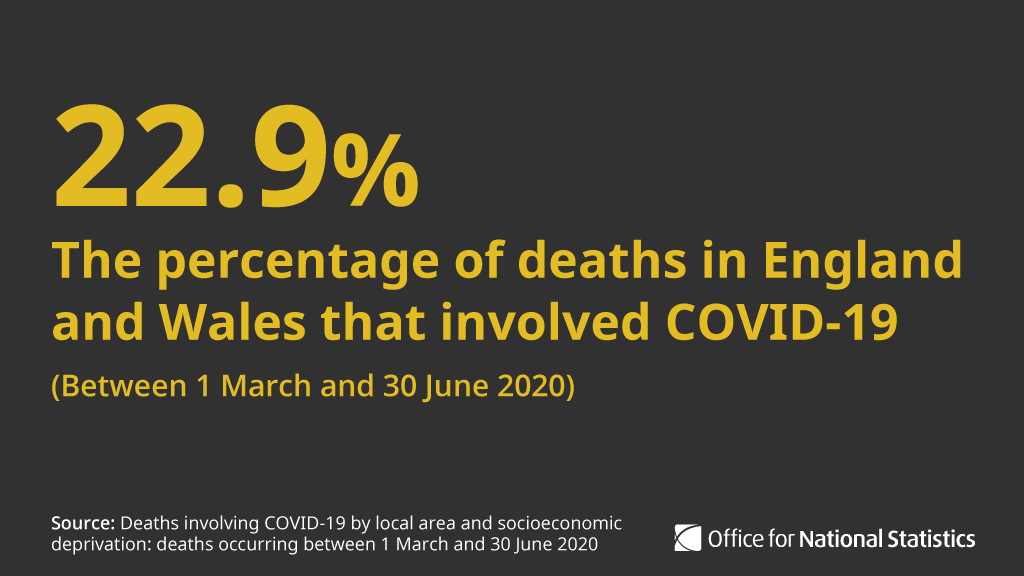
Between 1 March and 30 June 220,636 deaths occurred in England and Wales that were registered by 11 July.
Of those, 50,574 (22.9%) involved COVID-19 ow.ly/hwGA50AGVWv
Between 1 March and 30 June 220,636 deaths occurred in England and Wales that were registered by 11 July.
Of those, 50,574 (22.9%) involved COVID-19 ow.ly/hwGA50AGVWv
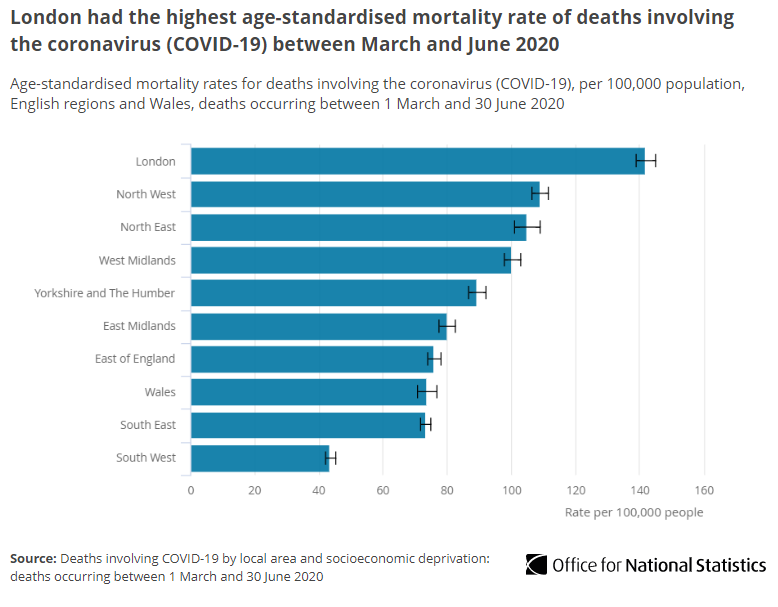
We use “age-standardised mortality rates”, which allow for differences in the age structure of populations.
These allow us to make valid comparisons between different geographic areas ow.ly/qzZ030r0mtK
These allow us to make valid comparisons between different geographic areas ow.ly/qzZ030r0mtK
Between 1 March and 30 June there were 88.0 deaths involving #COVID19 per 100,000 people in England and Wales
▪️ 88.7 per 100,000 persons in England
▪️ 73.7 per 100,000 persons in Wales
➡️ ow.ly/CpmR30r0mur
▪️ 88.7 per 100,000 persons in England
▪️ 73.7 per 100,000 persons in Wales
➡️ ow.ly/CpmR30r0mur
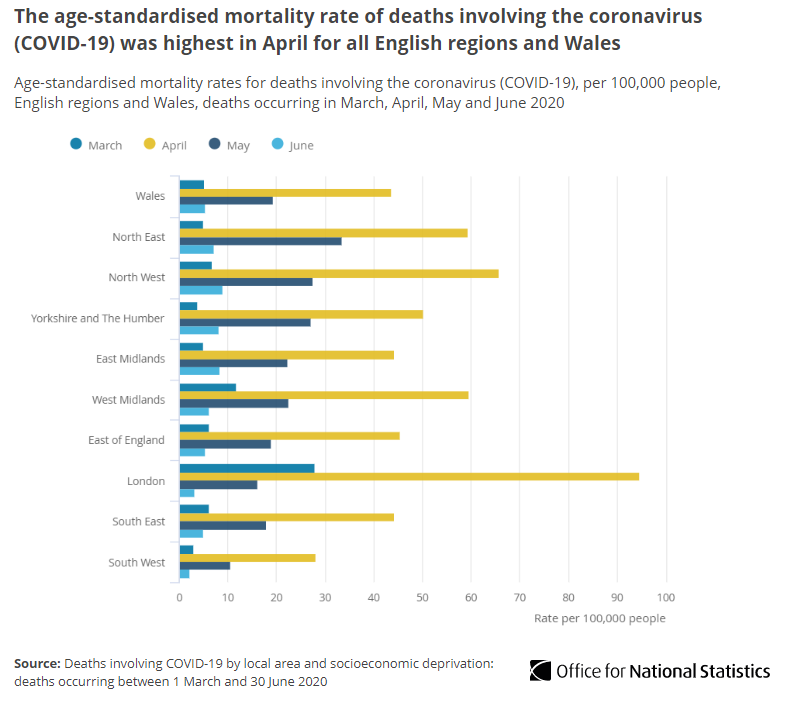
London had the highest mortality rate with 141.8 deaths per 100,000 persons involving #COVID19; statistically significantly higher than any other region and nearly a third (30.2%) higher than the region with the next highest rate (North West) ow.ly/zmmA30r0mAq
All English regions and Wales recorded an increase in #COVID19 mortality rates between March and April, followed by decreases in May and June ow.ly/Tiap30r0mBz
The nine out of 10 local authorities with the highest #COVID19 mortality rates were London boroughs.
Brent had the highest rate with 216.6 deaths per 100,000 population ow.ly/LLmA30r0mHK
Brent had the highest rate with 216.6 deaths per 100,000 population ow.ly/LLmA30r0mHK
All local authorities in England and Wales recorded an increase in mortality rates involving #COVID19 between March and April, followed by decreases in May and June for most areas.
The greatest decrease was in Barnet where the rate fell by 99.1% ow.ly/hYvq30r0mIS
The greatest decrease was in Barnet where the rate fell by 99.1% ow.ly/hYvq30r0mIS
We've also published an interactive map where you can search deaths relating to #COVID19 by postcode ow.ly/Qcck30r0mJz
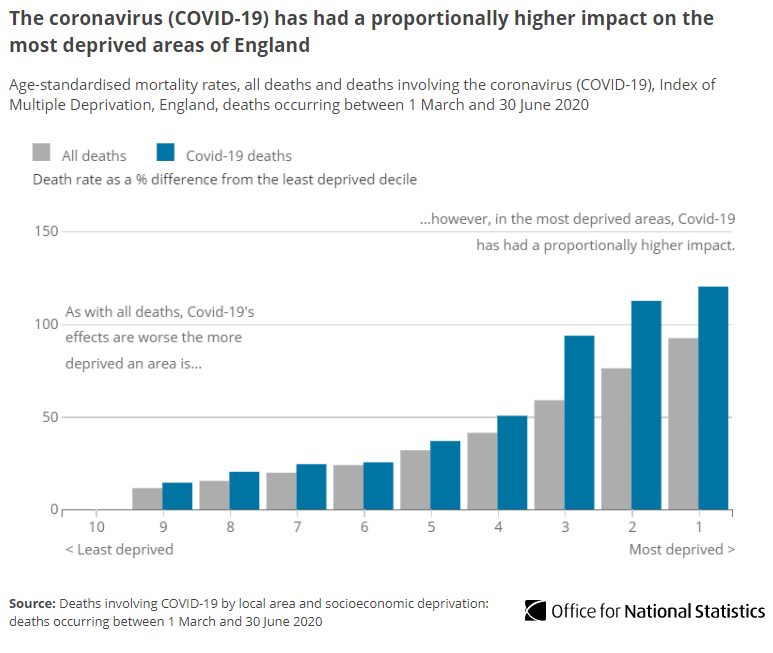
In England, the mortality rate of deaths involving #COVID19 in the most deprived areas was more than double that in the least deprived:
▪️ most deprived: 139.6 deaths per 100,000 population
▪️ least deprived: 63.4 deaths per 100,000 population
➡️ ow.ly/4CC430r0mK0
▪️ most deprived: 139.6 deaths per 100,000 population
▪️ least deprived: 63.4 deaths per 100,000 population
➡️ ow.ly/4CC430r0mK0
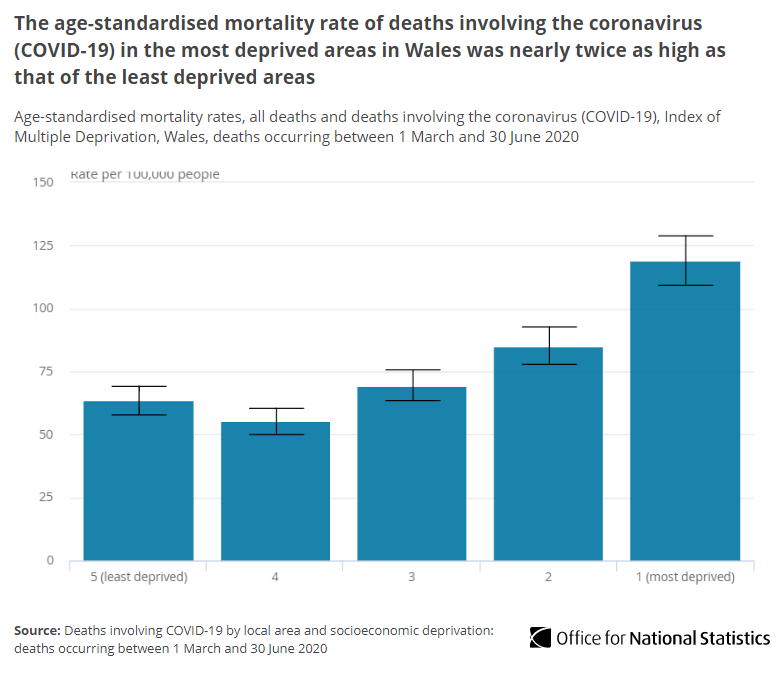
In Wales, the mortality rate for deaths involving #COVID19 in the most deprived areas was almost twice as high as in the least deprived:
▪️ most deprived: 119.1 deaths per 100,000 population
▪️ least deprived: 63.5 deaths per 100,000 population
➡️ ow.ly/lOyM30r0mKS
▪️ most deprived: 119.1 deaths per 100,000 population
▪️ least deprived: 63.5 deaths per 100,000 population
➡️ ow.ly/lOyM30r0mKS