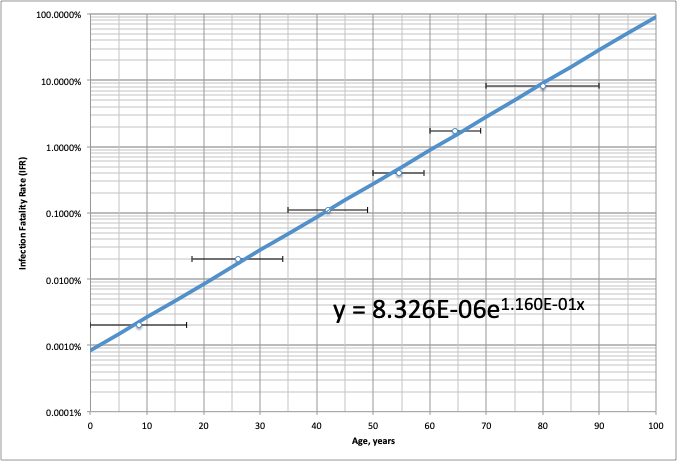
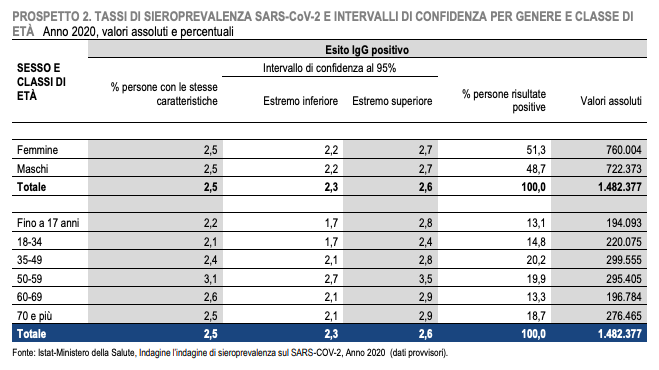
(1) Infection Fatality Rate (IFR) v. Age from recent Italian Seroprevalence Study:
0-17: 0.002%
18-34: 0.02%
35-49: 0.11%
50-59: 0.40%
60-69: 1.74%
>70: 8.30%
0-17: 0.002%
18-34: 0.02%
35-49: 0.11%
50-59: 0.40%
60-69: 1.74%
>70: 8.30%
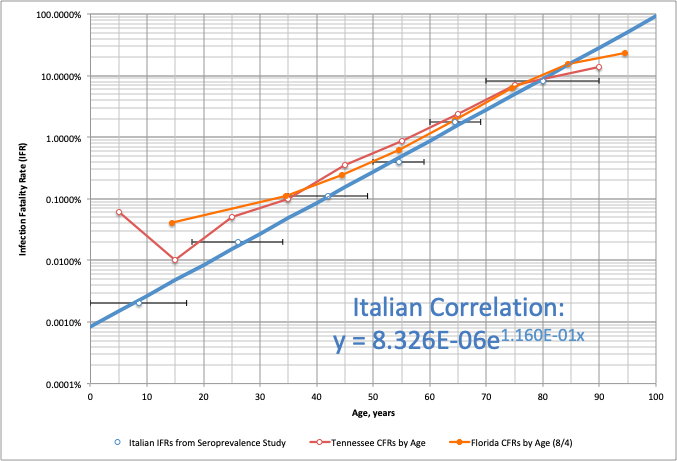
(2) @TimTravis2 reported these Case Fatality Rates for Tennessee. Here's how they compare to the Italian IFR estimates.
Note that CFR approaches IFR quicker in older age groups, implying lower I/C ratio for those age groups.
Note that CFR approaches IFR quicker in older age groups, implying lower I/C ratio for those age groups.
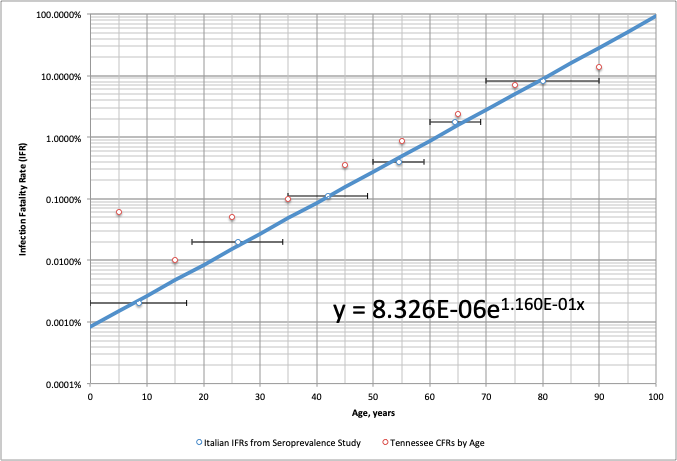
(3) Assuming constant IFR in each age group (only approximately true), as C -> I, CFR -> IFR from above.
Also higher percentage of Infections discovered in age groups with higher likelihood of hospitalizations.
Link to the Italia study:
Also higher percentage of Infections discovered in age groups with higher likelihood of hospitalizations.
Link to the Italia study:
(4) Note there is no single IFR for all regions; even with the same quality of care, IFR values will vary by age & comorbidity distributions.
The single IFR value is merely a convenient rule of thumb.
Assuming constant IFR in each age group, as C -> I, CFR -> IFR from above.
The single IFR value is merely a convenient rule of thumb.
Assuming constant IFR in each age group, as C -> I, CFR -> IFR from above.

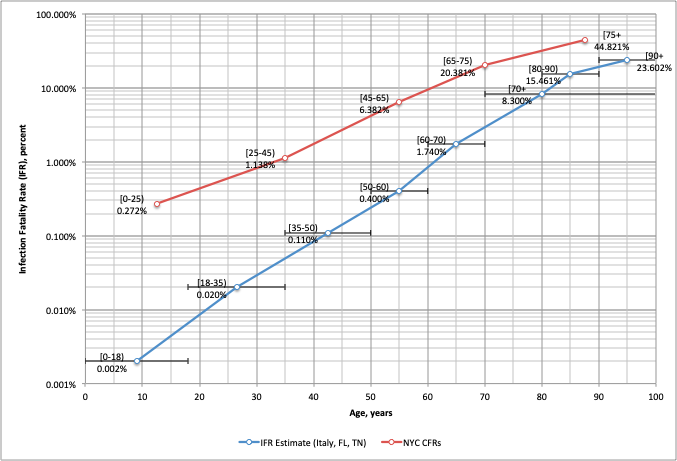
(6) @zorinaq updated his Florida CFR chart below. Let's compare these values with the ones from Italy.
(7) The Florida CFRs (orange) are in good agreement with the IFR values from Italy (blue), slightly higher in each age group, but the oldest one.
They are also in good agreement with the Tennessee CFRs.
They are also in good agreement with the Tennessee CFRs.
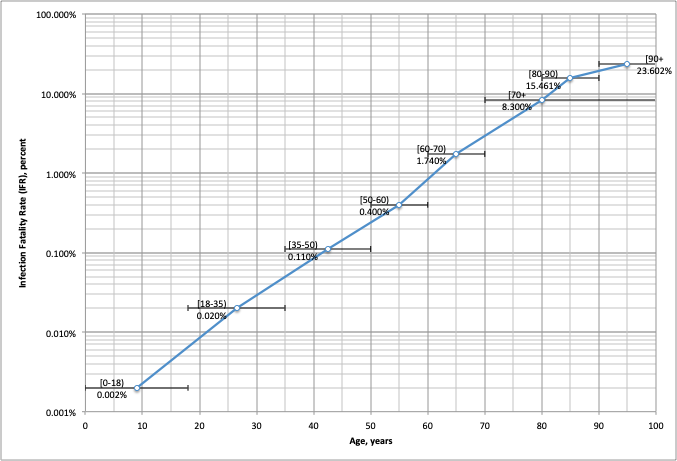
(8) Here is a combined sources estimate of the Infection Fatality Rate as a function of age. All the values up to 80 years old are from the Italian study. The values for ages above 80, are from Tennessee and Florida.
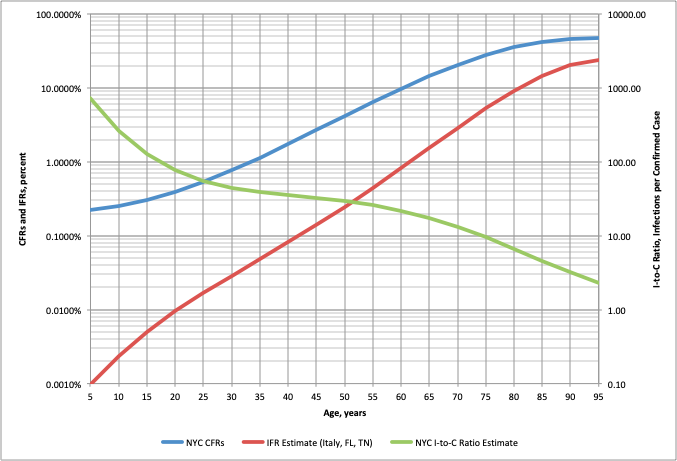
(9) New York City's CFRs v. the IFR estimate based on Italy, Florida and Tennessee.
The ratio of CFR to the IFR for the same age is the Infections-to-Confirmed Cases Ratio.
It's 3X for the oldest age group, but gets much larger for younger groups.
medrxiv.org/content/10.110…
The ratio of CFR to the IFR for the same age is the Infections-to-Confirmed Cases Ratio.
It's 3X for the oldest age group, but gets much larger for younger groups.
medrxiv.org/content/10.110…
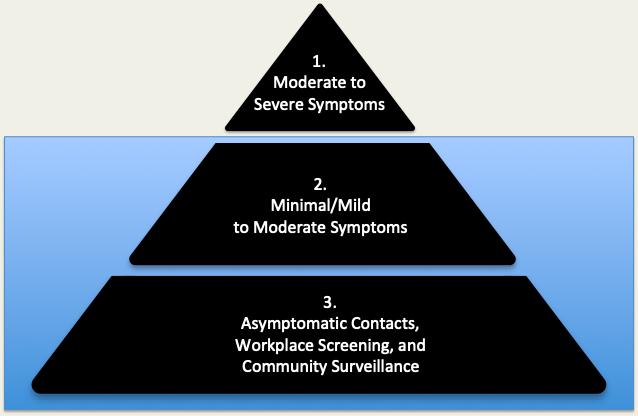
(10) The reason there is better surveillance of older age groups is due to the testing "iceberg" effect.
Tests are first performed on Moderate to Critical patients, which is biased toward older age groups. As testing expands, younger asymptomatic groups start to be tested.
Tests are first performed on Moderate to Critical patients, which is biased toward older age groups. As testing expands, younger asymptomatic groups start to be tested.
(11) Here's a plot of the estimated Infections-to-Confirmed Cases ratio as a function of age for the NYC data.
(12) Texas Cumulative CFRs vs Estimated IFRs (Italy, FL, TN)
The minimum I/C ratio is for the top age group and it is just under 10:1. Values only gets higher.
Also, it appears CFR can be greater than 100%.
Note: Texas reported no deaths for anyone less than 10 years old.
The minimum I/C ratio is for the top age group and it is just under 10:1. Values only gets higher.
Also, it appears CFR can be greater than 100%.
Note: Texas reported no deaths for anyone less than 10 years old.

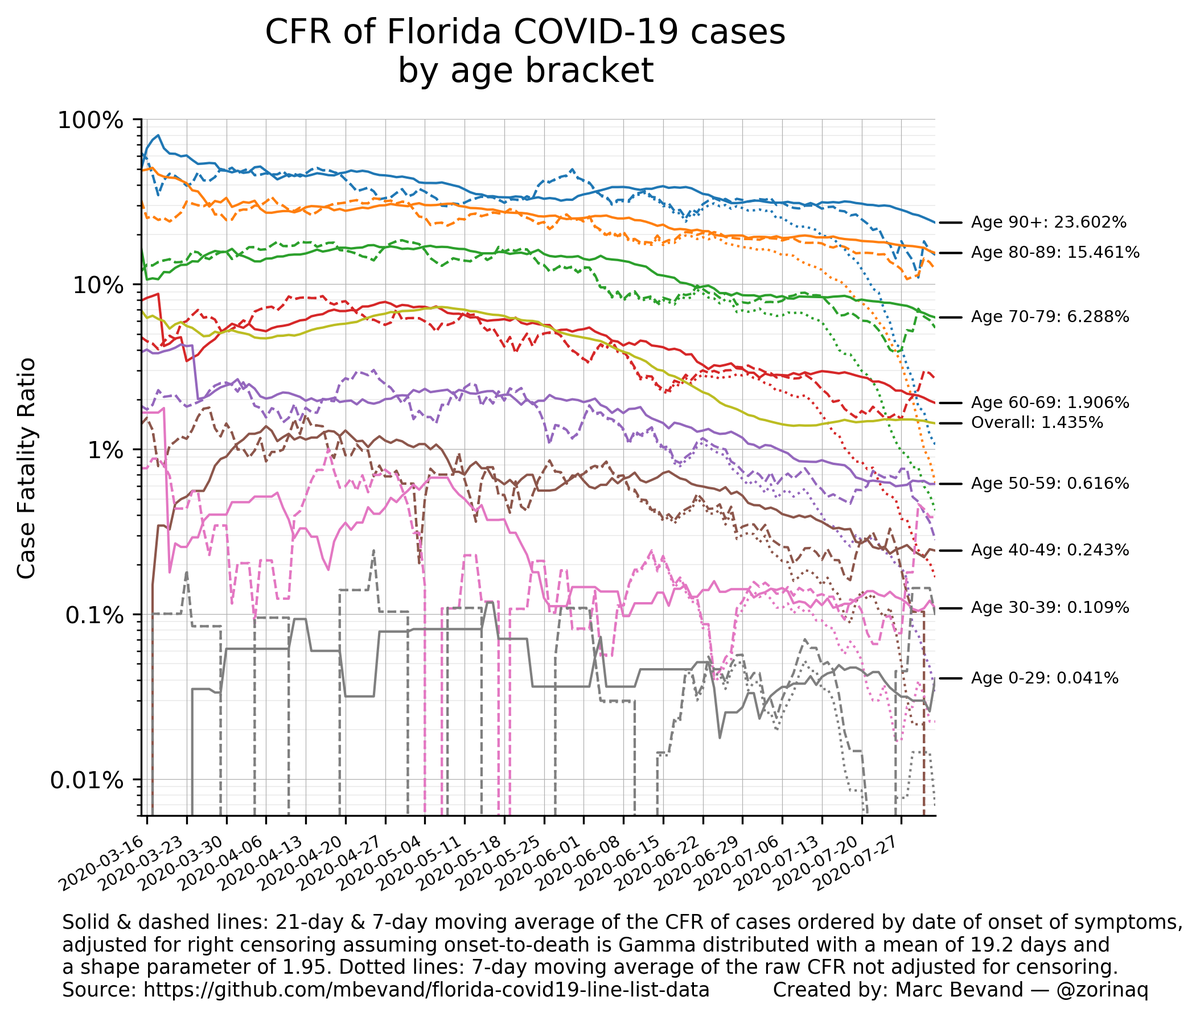
(13) Florida CFRs progression over time v. IFR model.
(14) Related Thread: