NEW: we’ve just updated our live dashboard tracking UK’s economic recovery.
We’re using fast data (lagged by as little as one day) on transactions, footfall & job ads to show which sectors are bouncing back sharply and which are stuttering.
Full piece: ft.com/uk-econ-tracker
We’re using fast data (lagged by as little as one day) on transactions, footfall & job ads to show which sectors are bouncing back sharply and which are stuttering.
Full piece: ft.com/uk-econ-tracker
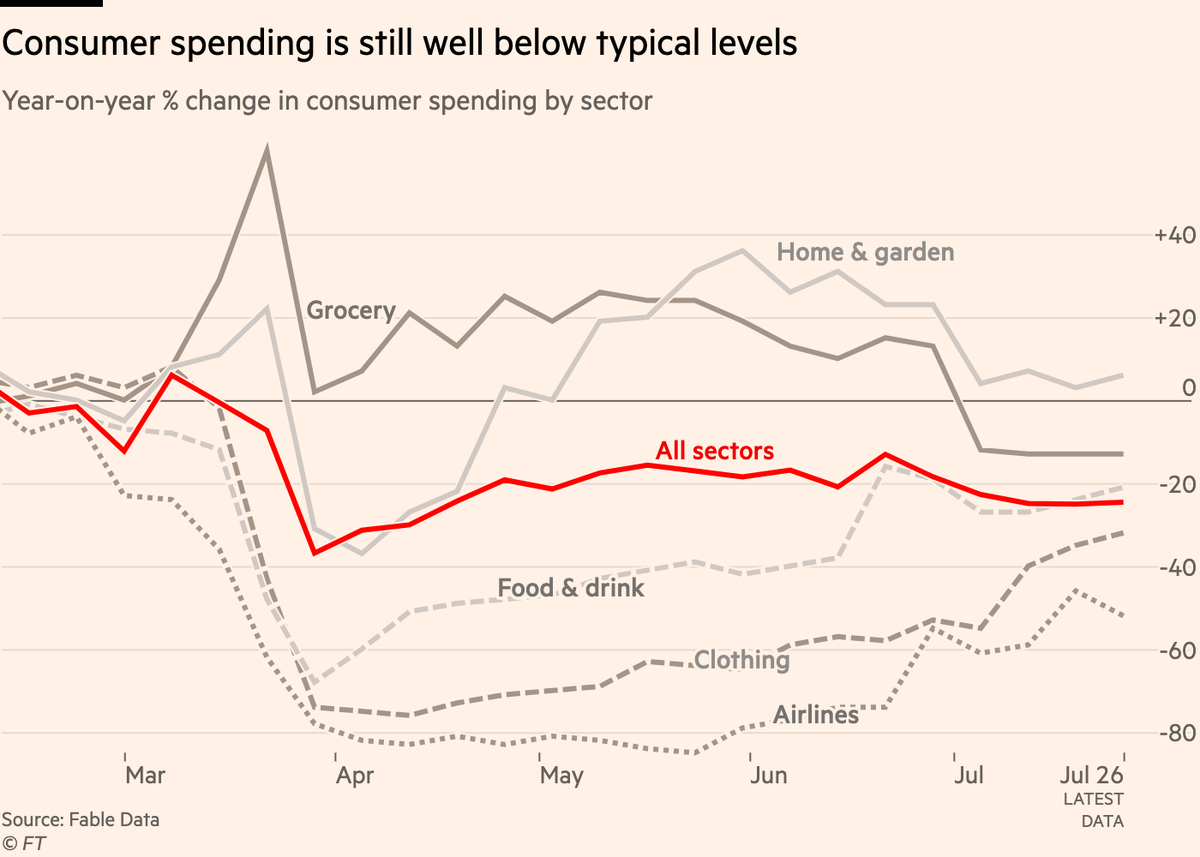
So far, overall picture is of a modest recovery, no signs of anything V-shaped.
Total consumer spending was down year-on-year by almost 40% as the lockdown bit. It’s recovered some of that loss, but has been stuck at around -20% y-o-y for months with no sign of a renewed rebound
Total consumer spending was down year-on-year by almost 40% as the lockdown bit. It’s recovered some of that loss, but has been stuck at around -20% y-o-y for months with no sign of a renewed rebound
Similar picture in retail footfall, where reopening of non-essential shops on June 15 sparked a sharp uptick, but since then progress has been slow.
Visits to shops still -35% y-o-y, below peer countries like Sweden & Italy, though US is lower still as virus continues to spread.
Visits to shops still -35% y-o-y, below peer countries like Sweden & Italy, though US is lower still as virus continues to spread.

UK’s laggard status confirmed in Google’s data on visits to entertainment locations including eating/drinking out & visiting cinemas etc.
Bad & long outbreak + lingering public uncertainty mean UK’s recovery in hospitality & entertainment has been slower & smaller than all peers
Bad & long outbreak + lingering public uncertainty mean UK’s recovery in hospitality & entertainment has been slower & smaller than all peers

But there are signs this is beginning to change as we move into summer. The reopening of pubs and restaurants on July 4 triggered immediate jumps in footfall and spending.
Footfall has thus far topped out at ~40% of usual levels, but spending is back up to 60% and still rising.
Footfall has thus far topped out at ~40% of usual levels, but spending is back up to 60% and still rising.

Those figures will give hope to UK’s arts & hospitality sectors, which have been by far hardest hit & longest suffering.
Vast majority of businesses in these sectors were still seeing reduced turnover after the July 4 reopening; almost half of arts businesses were still closed.
Vast majority of businesses in these sectors were still seeing reduced turnover after the July 4 reopening; almost half of arts businesses were still closed.

This chart also tracks furloughed workers.
As govt support for furlough scheme is phased out, question is whether we’ll see some of the furloughed made redundant
Again, sectors most likely to be affected are arts & hospitality. We’ll add redundancies to the chart as they appear
As govt support for furlough scheme is phased out, question is whether we’ll see some of the furloughed made redundant
Again, sectors most likely to be affected are arts & hospitality. We’ll add redundancies to the chart as they appear

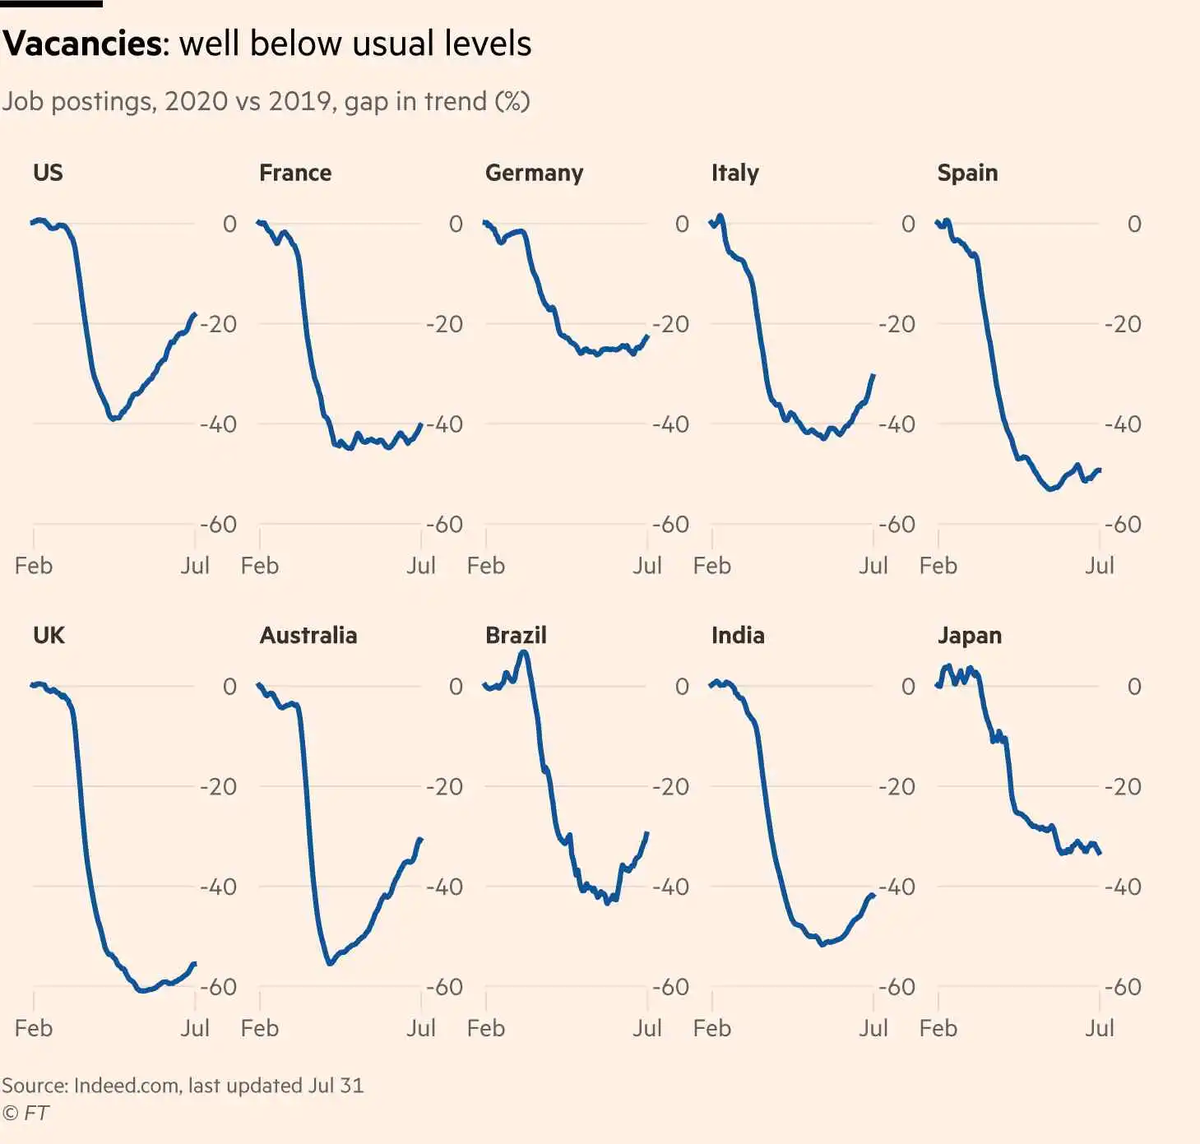
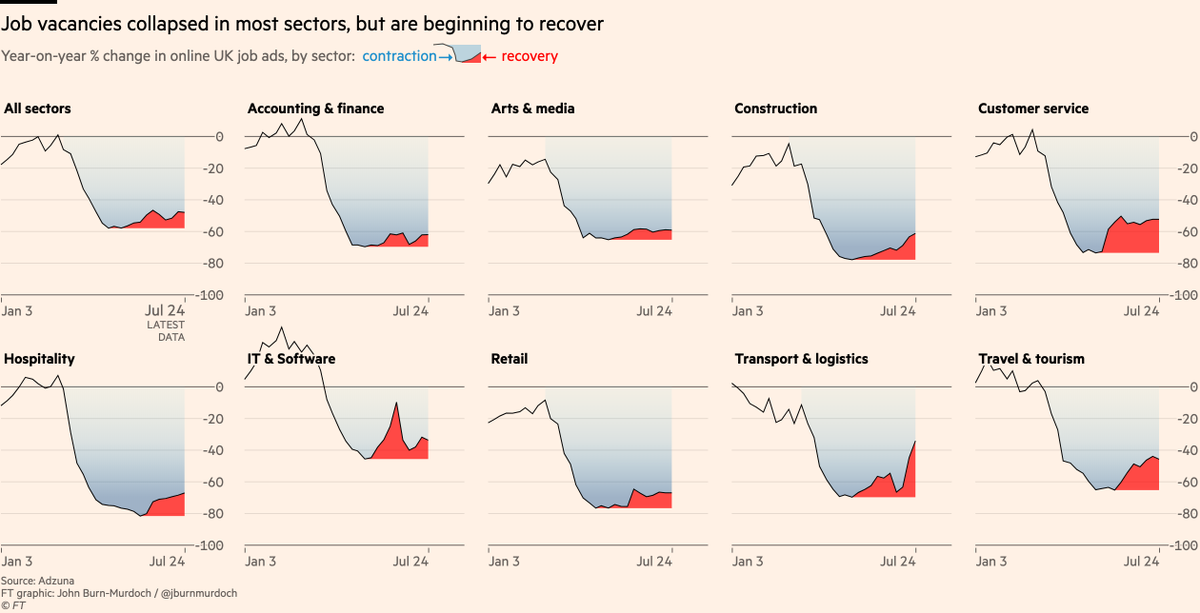
And here are job ads numbers via @adzuna:
Hospitality saw 80% drop in vacancies, recovering slightly to -70% by late July.
Still far to go for normal vacancy levels in all sectors. For the new cohort of graduates, and people who’ve lost their jobs, this is a brutal environment.
Hospitality saw 80% drop in vacancies, recovering slightly to -70% by late July.
Still far to go for normal vacancy levels in all sectors. For the new cohort of graduates, and people who’ve lost their jobs, this is a brutal environment.
We’ll continue updating this page regularly as new data comes in on the various metrics, and will also be adding new indicators as additional data sources become relevant.
Bookmark it at ft.com/uk-econ-tracker
Bookmark it at ft.com/uk-econ-tracker
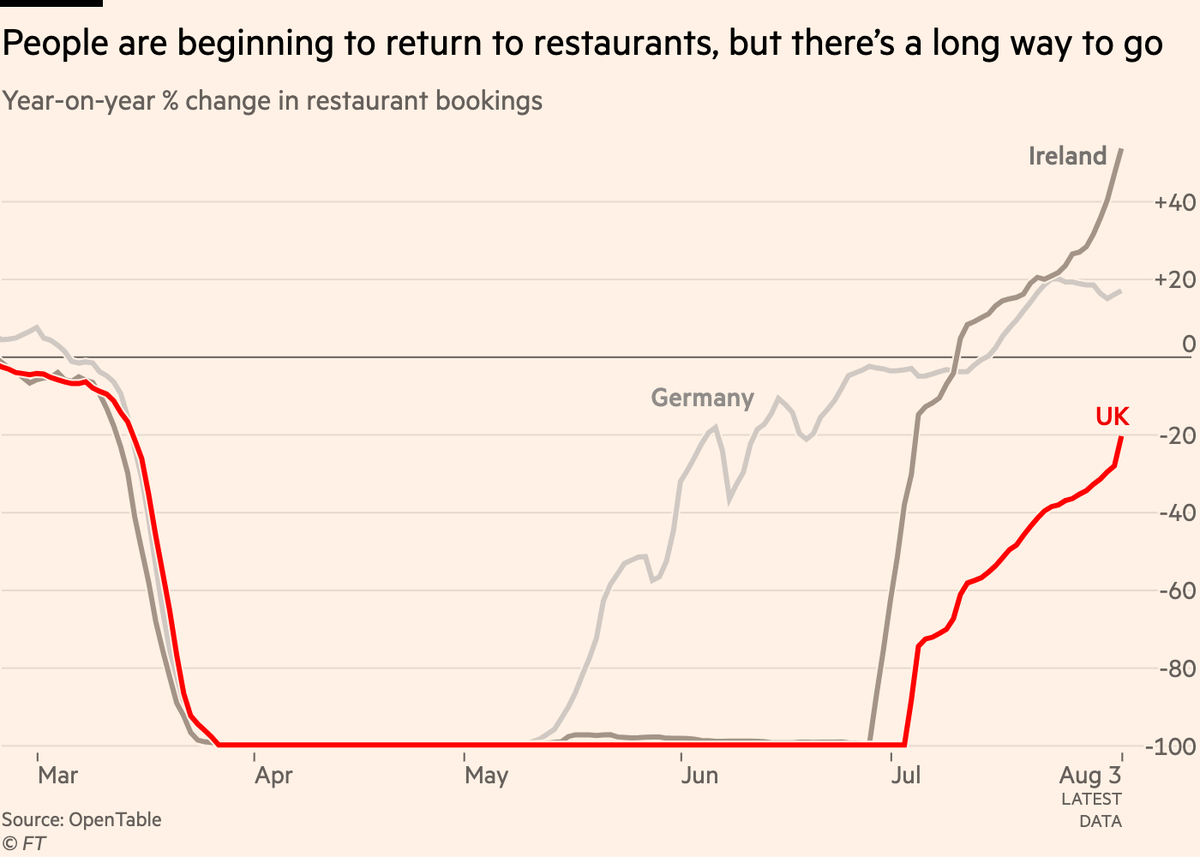
PS: one chart that’s disappeared is this one on restaurant bookings, which we’ve replaced with the data on footfall & spending in pubs & restaurants.
We believe this data is being skewed upwards as many restaurants now require bookings when previously they didn’t.
We believe this data is being skewed upwards as many restaurants now require bookings when previously they didn’t.