#priceVoume
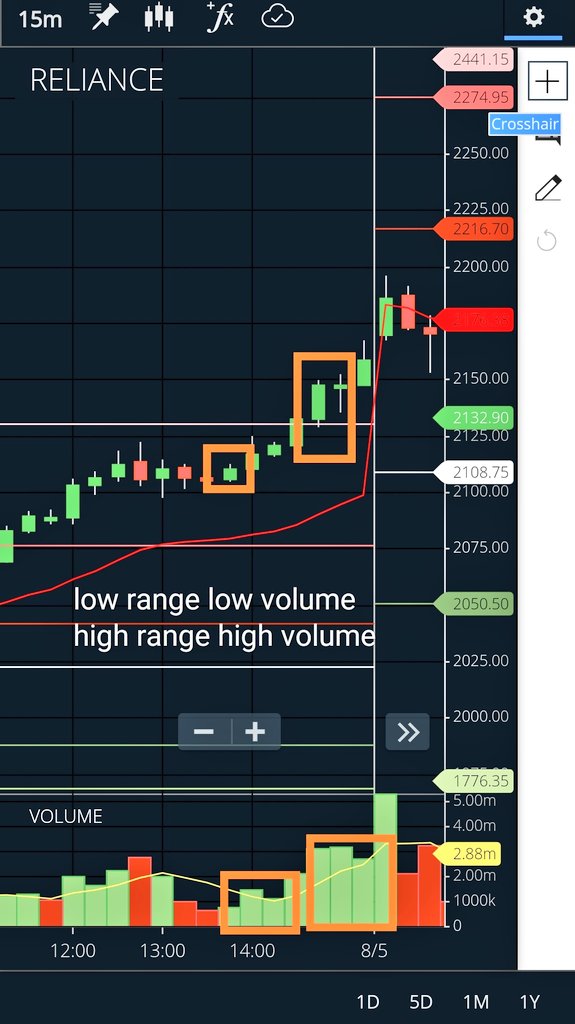
Always compare full body range with volume.
If range of candle is big , should resembles volume..
Big range --->high volume
Small range--> low volume
If it is not that happening, then it is alert. It is against price and action law..
Always compare full body range with volume.
If range of candle is big , should resembles volume..
Big range --->high volume
Small range--> low volume
If it is not that happening, then it is alert. It is against price and action law..
#PriceVolume #Price #volume
Topic:- Stopping Volume or Topping out volume
Very important phenomena observed today during trading.
Stopping volume:-
Vol- Inc
Price- dec
Range of candle -dec
Last cand would be hammer.
Topic:- Stopping Volume or Topping out volume
Very important phenomena observed today during trading.
Stopping volume:-
Vol- Inc
Price- dec
Range of candle -dec
Last cand would be hammer.
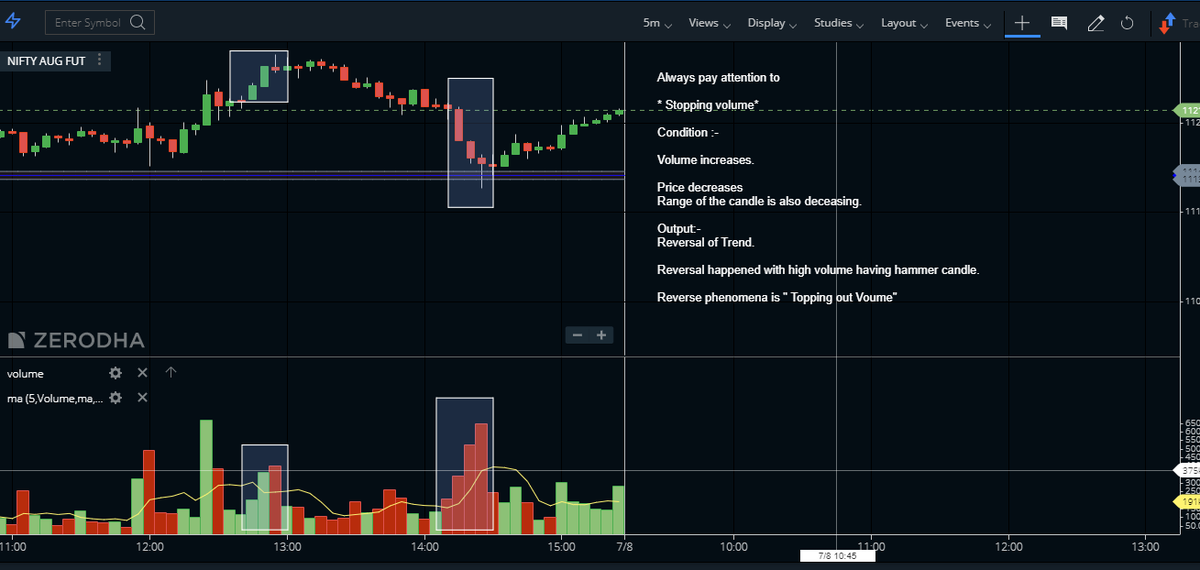
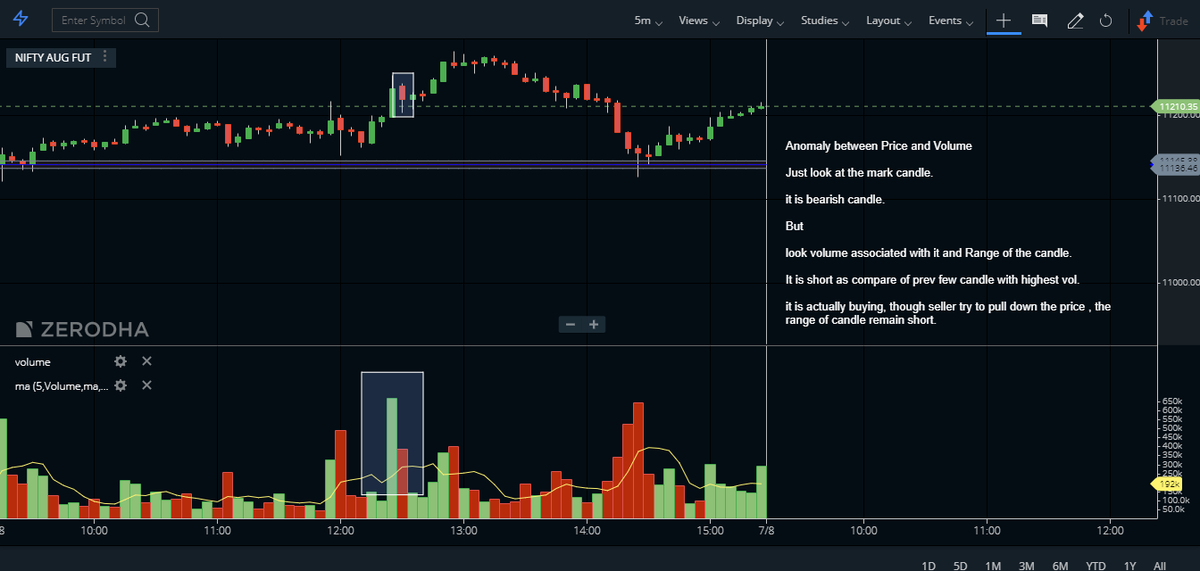
it is actually buying, though seller try to pull down the price, the
range of candle remains short.
range of candle remains short.
#inverted_hammer #hammer candle
Always train your eyes to see these kind of candle with HIGH volume..
it is the best thing you can see on chart.
Always train your eyes to see these kind of candle with HIGH volume..
it is the best thing you can see on chart.
Price and volume should compliment each other.
if not then there is an anomaly.
if not then there is an anomaly.


Relationship hammer candle with trend and volume
It is very important to identify the real meaning of candle in line with volume
Downward trend + hammer + should have high volume.
Upward trend +hammer+ should have low volume.
It is very important to identify the real meaning of candle in line with volume
Downward trend + hammer + should have high volume.
Upward trend +hammer+ should have low volume.

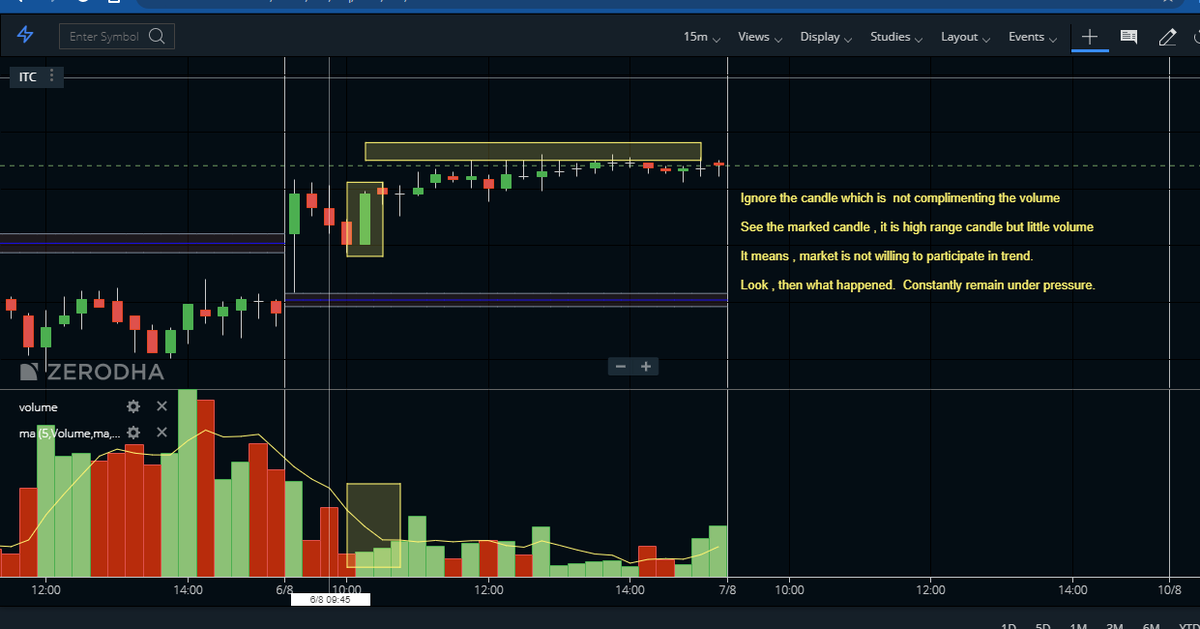
Ignore the candle which is not complimenting the volume
#itc look what happened today in it.
wide range bullish candle, but little volume. it means market is not willing to participate in the trend.
#itc look what happened today in it.
wide range bullish candle, but little volume. it means market is not willing to participate in the trend.
Pay ultra attention to the candle which is narrow range but very high volume..
It is early sign of reversals.
It is early sign of reversals.
When price increase and volume decease then it is reversal sign..
But wait, also pay attention to range of each candle..it should be deceasing
See example.
But wait, also pay attention to range of each candle..it should be deceasing
See example.
Price should compliment with volume..
If not then it is warning sign..
See in this example..
Volume is less and price range is so high..it is fake buying..don't participate in this kind of rally.
If not then it is warning sign..
See in this example..
Volume is less and price range is so high..it is fake buying..don't participate in this kind of rally.
Keep observing wick and tail in the candle.
They are very powerful.
It is the candle which tell you upcoming future trend.
If you are getting more wick near VWAP then it is selling.
If u r getting more tail candle near a certain zone, then it is buying.
They are very powerful.
It is the candle which tell you upcoming future trend.
If you are getting more wick near VWAP then it is selling.
If u r getting more tail candle near a certain zone, then it is buying.
Here is the example of double top in thr market with good volume.
Hammer candle with good Volume give confidence to enter in the market.
Remember, u need to see follow up buying after that..
See this wonderful example.
Remember, u need to see follow up buying after that..
See this wonderful example.
U can find early sign of breakout.
Look in this example, when the stock faced the resistance at that time volume and now..when it is facing..volume is high ...so there is. Something happening..
And then breakout..
Look in this example, when the stock faced the resistance at that time volume and now..when it is facing..volume is high ...so there is. Something happening..
And then breakout..
On the journey of trend , if you find many Wide Range Candle with volume..then trend is very bullish..
Always anchor ur analysis with respect to high volume & low volume....
If earlier buying happened with 100 vol & this time the same range candle is formed with 50 vol..
Then don't buy it..
Same is applied for sell.
"Comparative volume" is very good tool to avoid fake trade.
If earlier buying happened with 100 vol & this time the same range candle is formed with 50 vol..
Then don't buy it..
Same is applied for sell.
"Comparative volume" is very good tool to avoid fake trade.
Clear trend identification by using price volume analysis..
These are good examples.
These are good examples.
Not always seems buying is buying..
many bullish candles and heavy volume..
tempted to buy ...but wait...
let's see in deep.
many bullish candles and heavy volume..
tempted to buy ...but wait...
let's see in deep.

When to take a trade and when to avoid?
Always take trade which is compliment price and volume.
1. Range -high, volume - high and wick candle -- Sell signal.
2. Two candle reversal. but volume is low.
No trade though it is a reversal.
Always take trade which is compliment price and volume.
1. Range -high, volume - high and wick candle -- Sell signal.
2. Two candle reversal. but volume is low.
No trade though it is a reversal.

" A candle" is very high range with both side arrows. Volatile candle.
don't take any trade.
3. Here high range candle, with two candles are having wick ..selling is visible. but again not compliment with volume.
No trade.
4. Buy signal with good volume and hammer candle.
don't take any trade.
3. Here high range candle, with two candles are having wick ..selling is visible. but again not compliment with volume.
No trade.
4. Buy signal with good volume and hammer candle.
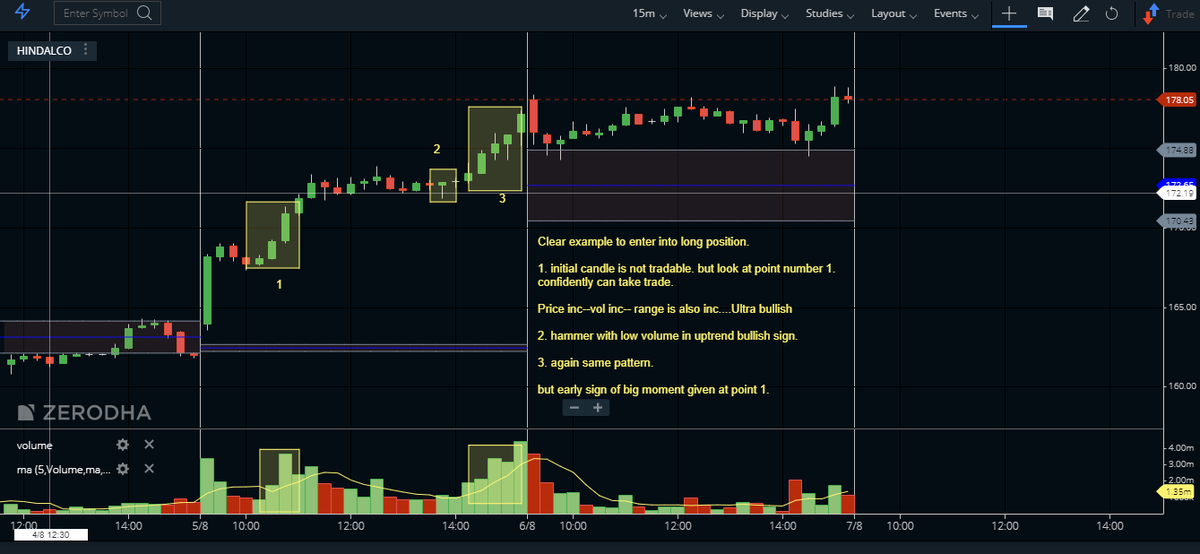
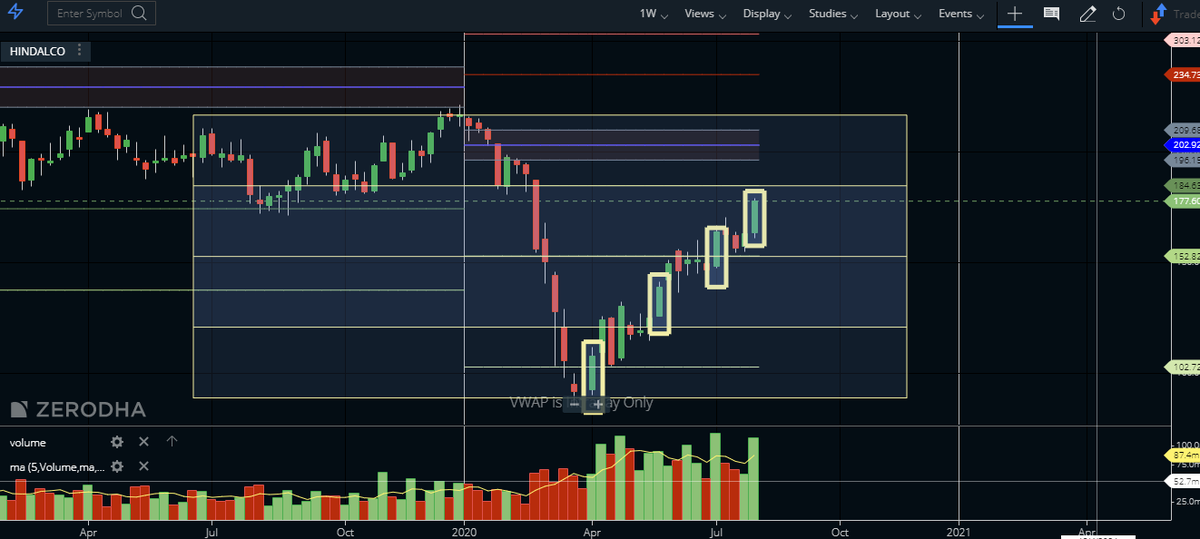
Early sign of big movement #hindalco
1. initial candle is not tradable. but look at No. 1.
confidently can take trade.
Price inc--vol inc-- range is also inc....Ultra bullish
2. hammer with low volume in uptrend bullish sign.
3. again same pattern.
No. 1 is important here.
1. initial candle is not tradable. but look at No. 1.
confidently can take trade.
Price inc--vol inc-- range is also inc....Ultra bullish
2. hammer with low volume in uptrend bullish sign.
3. again same pattern.
No. 1 is important here.
Comparative volume at double top / bottom
Not all double top/ bottom is tradable.
But look No.1 .. tripple top and point 1 is high vol
comparative to earlier. Bearish sign.
Point 2 and 3 - double bottom..
point 3 's volume is greater than 2..
clear buy call.
Not all double top/ bottom is tradable.
But look No.1 .. tripple top and point 1 is high vol
comparative to earlier. Bearish sign.
Point 2 and 3 - double bottom..
point 3 's volume is greater than 2..
clear buy call.

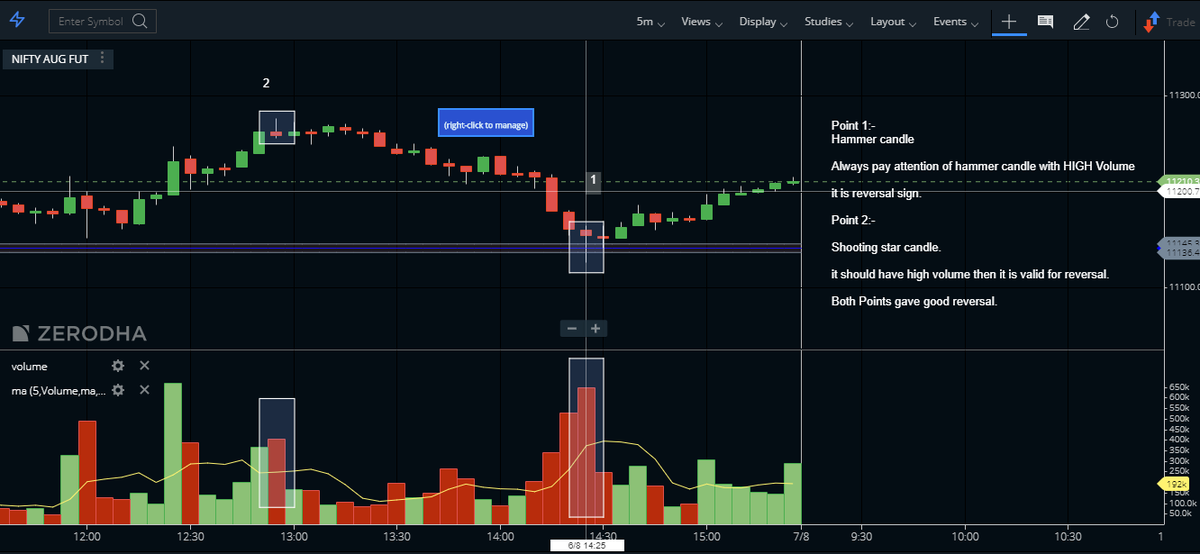
Crux of my learning about #PriceVolume analysis.
Hammer and Inverted hammer.
Uptrend:-
Inv Ham-good volume -Sell (No.1)
Inv Ham-low volume- Ignore
Uptrend :-
Ham-low volume-supporting buying
Ham- high volume - Sell call
Hammer and Inverted hammer.
Uptrend:-
Inv Ham-good volume -Sell (No.1)
Inv Ham-low volume- Ignore
Uptrend :-
Ham-low volume-supporting buying
Ham- high volume - Sell call
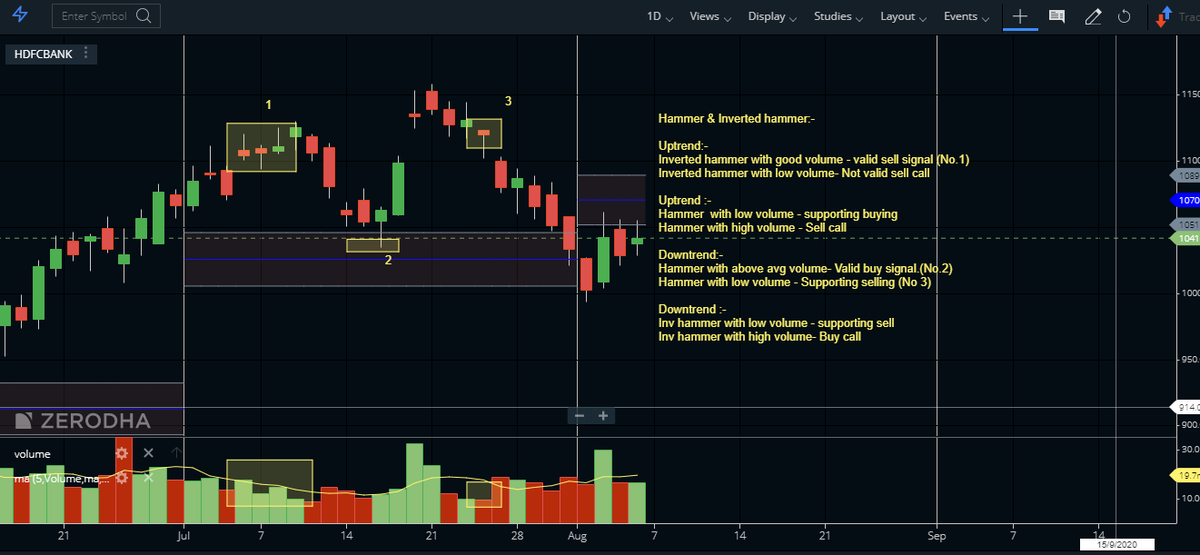
Downtrend:-
Ham-high volume-buy signal.(No.2)
Hammer -low volume - Supporting sell (No 3)
Downtrend :-
Inv hammer with low volume - supporting sell
Inv hammer with high volume- Buy call
Ham-high volume-buy signal.(No.2)
Hammer -low volume - Supporting sell (No 3)
Downtrend :-
Inv hammer with low volume - supporting sell
Inv hammer with high volume- Buy call
If you are thinking that +ve candle is bullish sign then think again.
Compare point 1 with Point 2.
Volume is almost same but point 2 range is low..
Actually it is selling .. and see then after .. Price waterfall.
Compare point 1 with Point 2.
Volume is almost same but point 2 range is low..
Actually it is selling .. and see then after .. Price waterfall.

Till now in market 7th Aug 10.14 am
Taking support ( Double bottom with the same volume) - a good sign at 11150-11000
hammer in an uptrend with low volume- bullishness
facing resistance:- 11200
If break then big momentum.
Wait for it.
Taking support ( Double bottom with the same volume) - a good sign at 11150-11000
hammer in an uptrend with low volume- bullishness
facing resistance:- 11200
If break then big momentum.
Wait for it.

7th Aug 12.30 pm
look how "Stopping Volume" and " Topping out volume "
gives opportunities.
The recent candle is having big range but volume is not supporting comparatively, so it is bouncing back.
look how "Stopping Volume" and " Topping out volume "
gives opportunities.
The recent candle is having big range but volume is not supporting comparatively, so it is bouncing back.

7th Aug 3.30 pm
Total range-bound..
not giving any opportunity to enter.
But the interesting part is a daily chart.
Range decreasing, volume decreasing, and positive trend.
Is it losing its steam?
Will correct on Monday?
Total range-bound..
not giving any opportunity to enter.
But the interesting part is a daily chart.
Range decreasing, volume decreasing, and positive trend.
Is it losing its steam?
Will correct on Monday?


today's some chart study .
All indicators are calculated base on price.
Price is always complimented by volume.
Cut in short, Price and Volume are the prime supreme.
They are the breath of the market.
Price is always complimented by volume.
Cut in short, Price and Volume are the prime supreme.
They are the breath of the market.
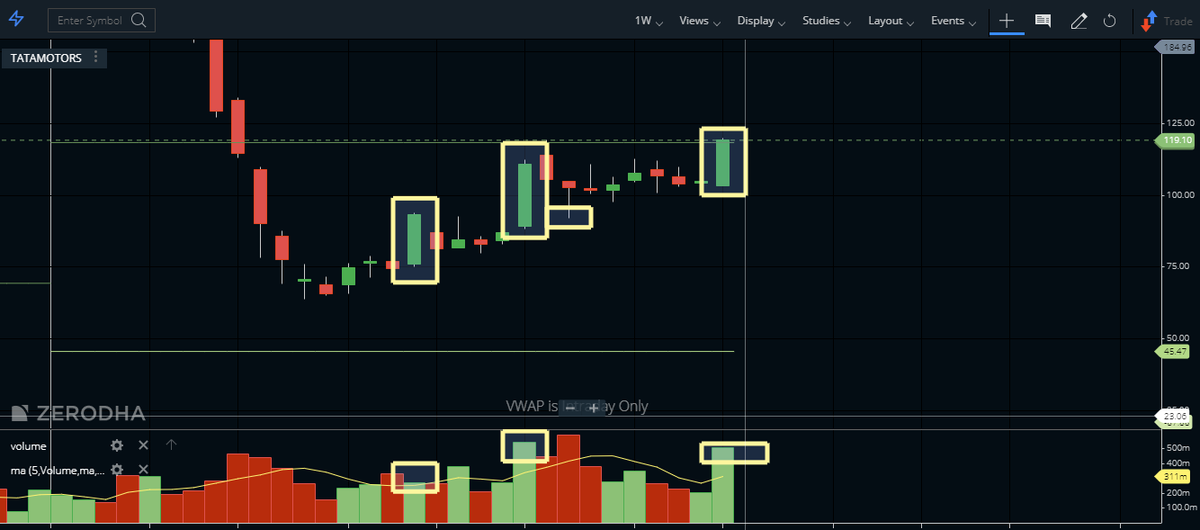
How systematic investment plant is also done by #institution #bigHand #marketmaker
Take the example of #tatamotors and #hindalco.
you will fin WRC with volume during its pathway.
Take the example of #tatamotors and #hindalco.
you will fin WRC with volume during its pathway.
Gap up/ down opening is always very tricky and induce to trap.
Gap up/down opening should have high volume associated, if it not, then there is a trap.
Gap down buying/ Gap up selling ( Engulfing pattern) is also the same phenomenon.
Market should participate in price action.
Gap up/down opening should have high volume associated, if it not, then there is a trap.
Gap down buying/ Gap up selling ( Engulfing pattern) is also the same phenomenon.
Market should participate in price action.

Shaky Candles are always made us worry.
Shaky candles are the candle that is not tuned with volume.
May it have a high range but very little volume.
Pls see the pic and understand to avoid unnecessary trade.
This is the most impt things to learn.
Shaky candles are the candle that is not tuned with volume.
May it have a high range but very little volume.
Pls see the pic and understand to avoid unnecessary trade.
This is the most impt things to learn.

Gap up/ down is not always breakout...it may be "fake out"


Another deep analysis of after market
Keep learning.
Understand that price and volume are the basic data for any indicator.
Pay attention to it first..
Price and volume must compliment eachother, if not then no meanings of any signal of indicator.
Keep learning.
Understand that price and volume are the basic data for any indicator.
Pay attention to it first..
Price and volume must compliment eachother, if not then no meanings of any signal of indicator.
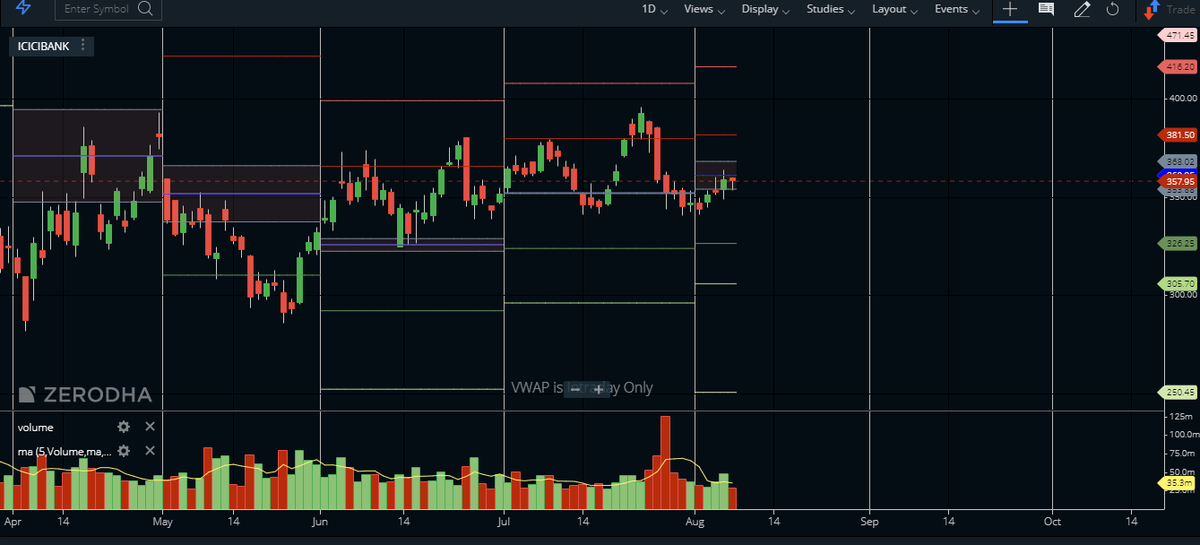
#sundayLearn #icicibank
Don't just see the chart.
Participate in discussion.
Be Vocal.😋
#institution #bigbrother do their work silently and smartly.
We need to find their footprint.
I have attached #chart.
Apply our knowledge in #PriceVolume
#comment
#RT if useful.
Don't just see the chart.
Participate in discussion.
Be Vocal.😋
#institution #bigbrother do their work silently and smartly.
We need to find their footprint.
I have attached #chart.
Apply our knowledge in #PriceVolume
#comment
#RT if useful.