Here's a thread that contains my findings regarding the relationship between true infections, reported cases, test positivity rate, and infection fatality rate for COVID-19.
Full write-up: covid19-projections.com/estimating-tru…
I hope to get some review/feedback/discussion from #epitwitter.
Full write-up: covid19-projections.com/estimating-tru…
I hope to get some review/feedback/discussion from #epitwitter.
These are the main conclusions I drew:
1) The virus is more prevalent now than in March/April
2) Current infection fatality rate is lower (~0.25%) mostly due to lower median age of infection
3) Herd immunity threshold is lower (~10-35%) due to lower rate of transmission (Rt)
1) The virus is more prevalent now than in March/April
2) Current infection fatality rate is lower (~0.25%) mostly due to lower median age of infection
3) Herd immunity threshold is lower (~10-35%) due to lower rate of transmission (Rt)
1) Higher prevalence
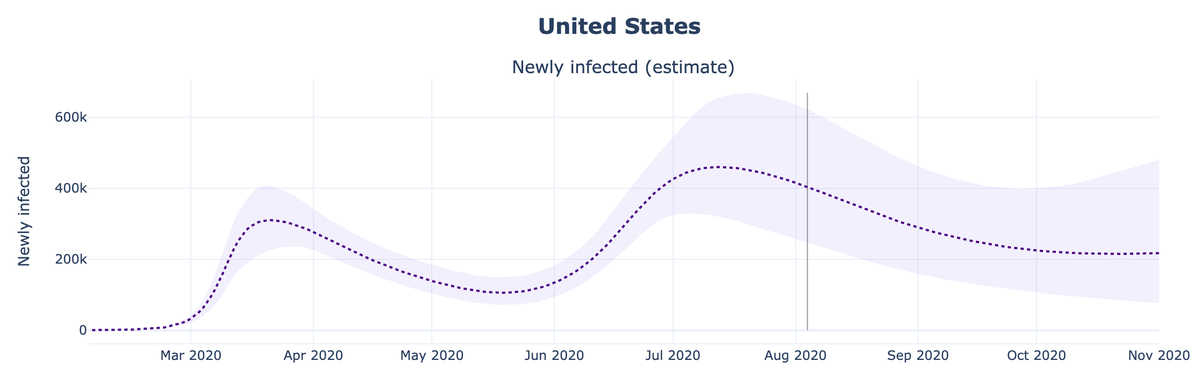
I computed the true daily new infections using 3 separate methods, and they all point towards a higher prevalence in July.
The estimated peak is ~450k new infections per day in July compared to ~300k/day in March.
I computed the true daily new infections using 3 separate methods, and they all point towards a higher prevalence in July.
The estimated peak is ~450k new infections per day in July compared to ~300k/day in March.

One way I estimate prevalence is by looking at the test positivity rate. Higher positivity -> higher ratio of undetected cases.
I use a square root function to map test positivity rate to true prevalence ratio:
true-prevalence-ratio = 16 * (test-positivity-rate)^(0.5) + 2.5
I use a square root function to map test positivity rate to true prevalence ratio:
true-prevalence-ratio = 16 * (test-positivity-rate)^(0.5) + 2.5

The intuition is that back in March/April, US test positivity rate is ~20%, which corresponds to roughly 10x true prevalence ratio. (NY/NJ was 40-50% -> 12-15x ratio)
Since then, US national test positivity is around 4-9%, which corresponds to a prevalence ratio of 5-8x.
Since then, US national test positivity is around 4-9%, which corresponds to a prevalence ratio of 5-8x.

We then multiply the true prevalence ratio by the reported cases to obtain an estimate of the true daily new infections.
We add a 14-day lag to account for the delay between exposure and positive test confirmation.
We add a 14-day lag to account for the delay between exposure and positive test confirmation.

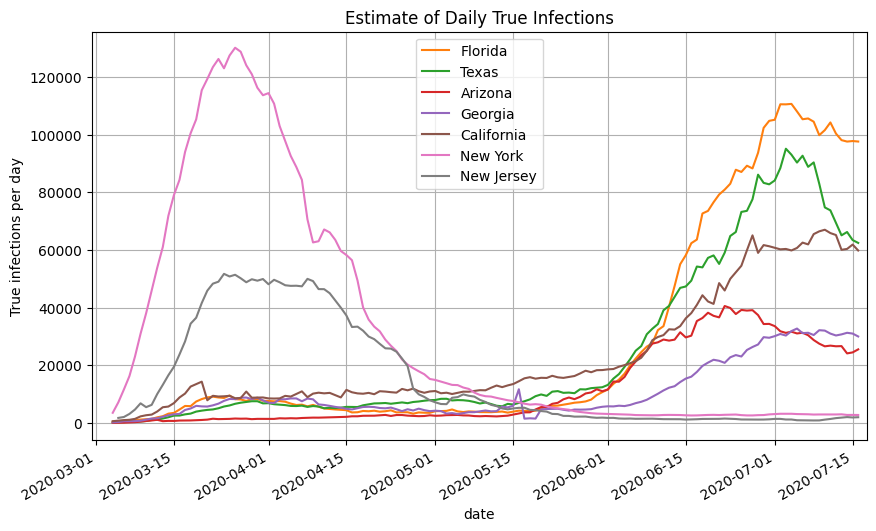
We can use this formula to estimate the new daily infections on the US nationally.
Or we can use the test positivity rates to back out the true infections on a state-by-state basis, and then add them up to get the US national estimate. The results are similar.
Or we can use the test positivity rates to back out the true infections on a state-by-state basis, and then add them up to get the US national estimate. The results are similar.


While I derived the above relationship independently, I have since become aware of similar work by @ellis2013nz, @_stah, and @FLCovid.
Of course, this relationship isn't perfect. Recent positivity rates may skew high because some states do not report repeated negative results.
Of course, this relationship isn't perfect. Recent positivity rates may skew high because some states do not report repeated negative results.
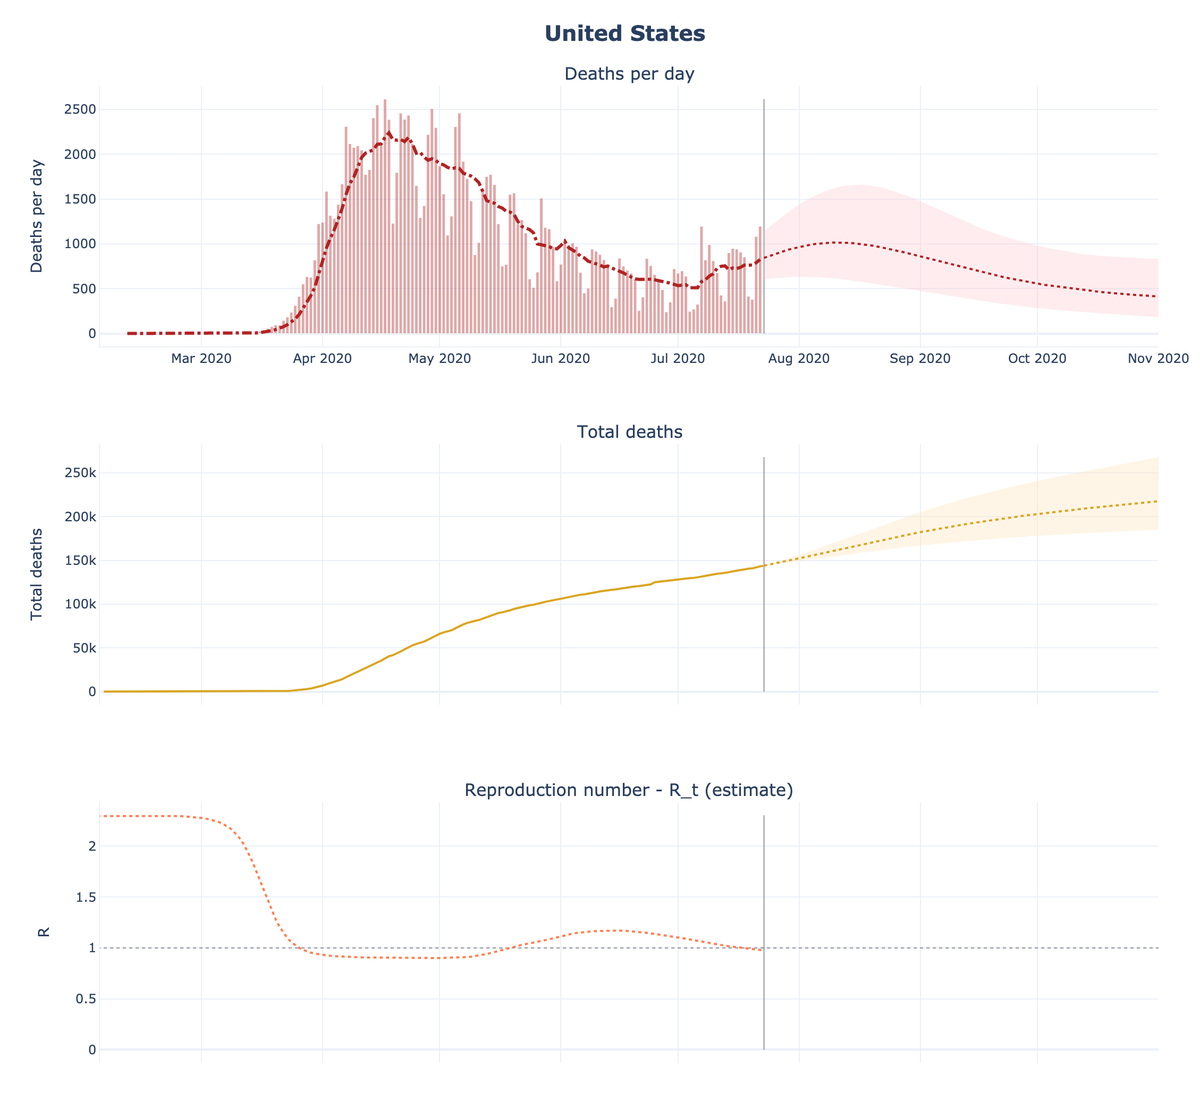
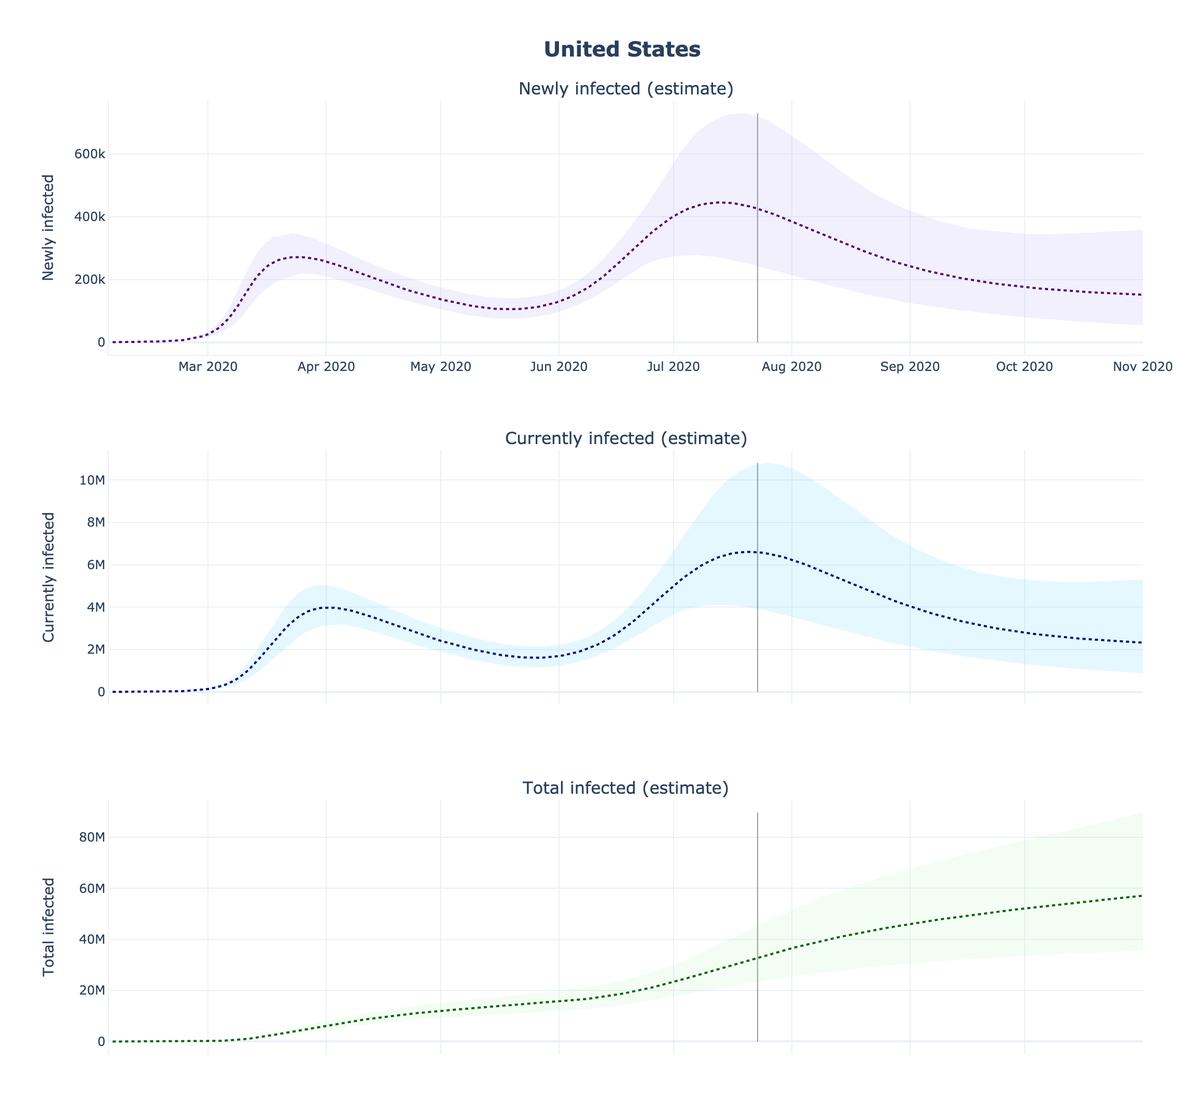
The other way I estimate true prevalence is by using the covid19-projections.com model, which only uses reported deaths.
Even though the data source is exclusive, the resulting shape of new infections is similar and shows a higher peak of ~450k infections/day in July.
Even though the data source is exclusive, the resulting shape of new infections is similar and shows a higher peak of ~450k infections/day in July.
There are 13 states with >10% test positivity.
10-15% - UT, KS, AR, GA, MO, TX, SC
15-20% - ID, AZ, FL, NV, AL
26% - MS
It's very unfortunate that we are still seeing >10% positivity 5 months into the pandemic. As many have iterated, we need a coordinated national testing plan.
10-15% - UT, KS, AR, GA, MO, TX, SC
15-20% - ID, AZ, FL, NV, AL
26% - MS
It's very unfortunate that we are still seeing >10% positivity 5 months into the pandemic. As many have iterated, we need a coordinated national testing plan.

2) Lower infection fatality rate (IFR)
After we have an estimate of the true infections, we can compute the implied infection fatality rate by factoring in deaths from approximately 4 weeks later.
We can do this for the US nationally, or on a state-by-state basis.
After we have an estimate of the true infections, we can compute the implied infection fatality rate by factoring in deaths from approximately 4 weeks later.
We can do this for the US nationally, or on a state-by-state basis.
The case fatality rate and implied infection fatality rate have all decreased significantly over the past few months (US is currently at ~0.25% IIFR).
I believe the largest contributor is lower median age of infection. There's also some elements of improved treatments.
I believe the largest contributor is lower median age of infection. There's also some elements of improved treatments.

Using CDC's COVIDView data, one can see that the proportion of confirmed cases for individuals above age 65 dropped significantly from April to June.
Once we factor in test positivity rate to get true prevalence, the difference is even more pronounced.
cdc.gov/coronavirus/20…
Once we factor in test positivity rate to get true prevalence, the difference is even more pronounced.
cdc.gov/coronavirus/20…
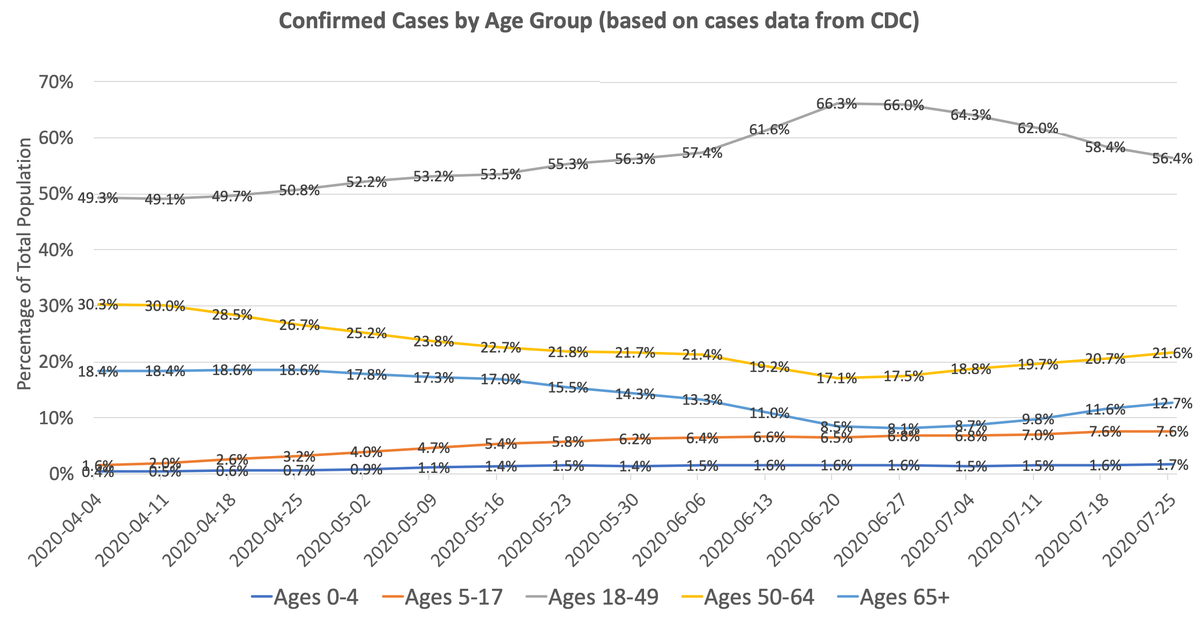
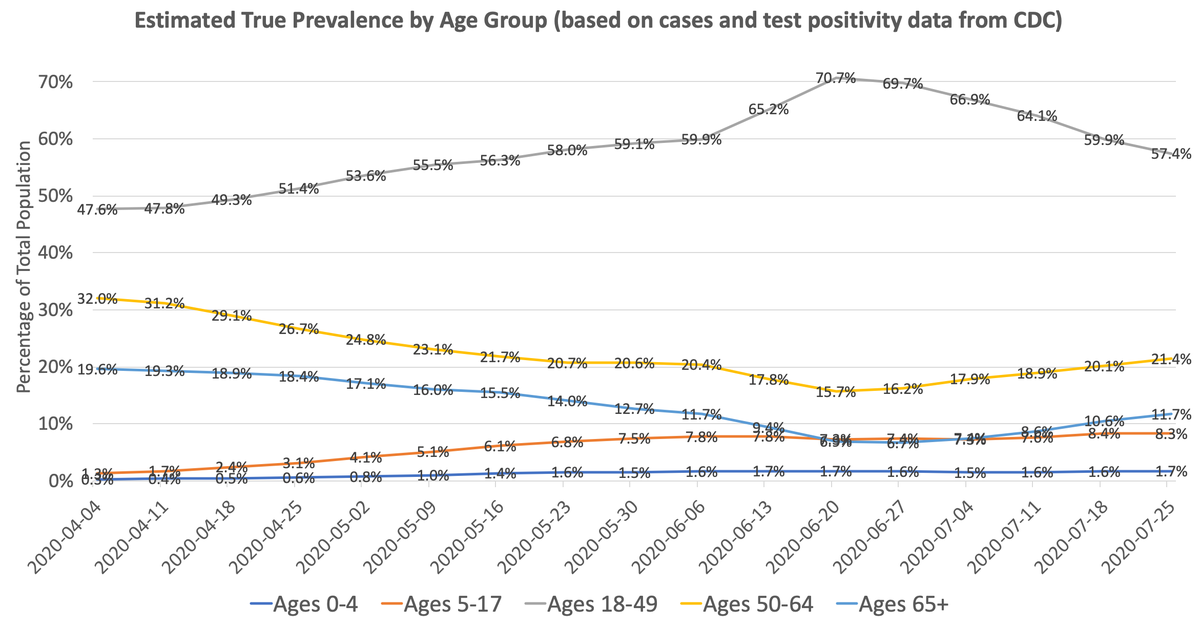
Since the IFR of those age 65+ is 20-50x higher than those under age 50, it's no surprise that we've seen a steep reduction in the overall IFR across the US. This is further helped by improved treatments and earlier detection.
One caution is that this trend is slowly reversing.
One caution is that this trend is slowly reversing.
3) Lower herd immunity threshold (HIT)
Infections are now declining in almost all heavily-impacted states, despite no clear policy interventions.
Estimating the HIT based on the current effective reproduction numbers results in a ~10-35% effective HIT. (Formula: HIT = 1-1/Rt)
Infections are now declining in almost all heavily-impacted states, despite no clear policy interventions.
Estimating the HIT based on the current effective reproduction numbers results in a ~10-35% effective HIT. (Formula: HIT = 1-1/Rt)
From my understanding, the herd immunity threshold of SARS-CoV-19 is still 60-80% given an R0 of 2.5-3. So early reports are not "wrong".
It's just that the Rt is much lower now after reopening (1-1.5) due to changes in behavior/policy, and that results in a lower effective HIT.
It's just that the Rt is much lower now after reopening (1-1.5) due to changes in behavior/policy, and that results in a lower effective HIT.
These are the best conclusions I have come up with after working with this data on a daily basis for the past 4 months.
Full disclaimer: I am not an epidemiologist, so if anything I said is inaccurate, let me know and I will be happy to correct them.
Full disclaimer: I am not an epidemiologist, so if anything I said is inaccurate, let me know and I will be happy to correct them.
I tried to write the report in a way such that an average layperson who has been following COVID-19 can understand it.
Before commenting, I encourage everyone to read the report first, particularly the "Disclaimers" section.
Before commenting, I encourage everyone to read the report first, particularly the "Disclaimers" section.
As usual, the data and results of everything I presented are open-source:
github.com/youyanggu/covi…
You can find estimates of the true daily new infections, implied IFR, implied CFR, etc for every state and nationally. I aim to update this data daily.
github.com/youyanggu/covi…
You can find estimates of the true daily new infections, implied IFR, implied CFR, etc for every state and nationally. I aim to update this data daily.
Summary:
Good news: We are likely past the peak.
Bad news: ~1,000 people are still dying every day and may remain at a high level for some time, esp with school reopenings & flu season coming up.
Thanks for reading. I'll be going through the comments for feedback/suggestions.
Good news: We are likely past the peak.
Bad news: ~1,000 people are still dying every day and may remain at a high level for some time, esp with school reopenings & flu season coming up.
Thanks for reading. I'll be going through the comments for feedback/suggestions.
Addenum #1: I should clarify that the lower effective herd immunity threshold is due to the *current interventions & social distancing in place*. If those interventions are relaxed, we would go back to a higher HIT.
Better insights on HIT by @mgmgomes1:
Better insights on HIT by @mgmgomes1:
Addenum #2: We only use reported deaths in our implied IFR calculations. But if states are underreporting deaths, then the implied IFR would be a lower bound on the true IFR.
@WeinbergerDan and his lab have been taking a deep dive into excess deaths:
@WeinbergerDan and his lab have been taking a deep dive into excess deaths: