Memphis/Shelby County Covid Report, Aug8
tl;dr
- hard to know what's actually happening
- testing is WAY down, lowest in 6wks
- that means we're missing cases
- but cases are WAY down, %pos too
- very cautious optimism
- trip wires are finally out, but they are useless
1/
tl;dr
- hard to know what's actually happening
- testing is WAY down, lowest in 6wks
- that means we're missing cases
- but cases are WAY down, %pos too
- very cautious optimism
- trip wires are finally out, but they are useless
1/

The headliner this wk is that the health dept quietly dropped its long-awaited "trip wires" doc last night.
I'm going to spend a minute on this - I'm so pissed off right now at how worthless this is - so if you want to just see this wk's data, feel free to skip down.
2/
I'm going to spend a minute on this - I'm so pissed off right now at how worthless this is - so if you want to just see this wk's data, feel free to skip down.
2/
Okay, so first I want to call attention to the fact that the trip wires weren't announced at a briefing, or even via a press release, but rather showed up quietly on the Health Dept socials at 10:22pm on a Friday night.
This is inexcusable.
3/
This is inexcusable.
3/
They had a briefing the day before, but purposely waited to Friday night so that they wouldn't have to answer any questions.
This avoidance of accountability is cowardice. And it's deeply un-democratic.
As a result, they will lose public trust...in the middle of a pandemic.
4/
This avoidance of accountability is cowardice. And it's deeply un-democratic.
As a result, they will lose public trust...in the middle of a pandemic.
4/
Now let's look at the actual trip wires.
I don't even have words for how bad this is.
I've actively supported @MayorLeeHarris for about 10 yrs & can't believe he would attach his name to this doc.
And it raises red flags about @ShelbyTNHealth.
5/
I don't even have words for how bad this is.
I've actively supported @MayorLeeHarris for about 10 yrs & can't believe he would attach his name to this doc.
And it raises red flags about @ShelbyTNHealth.
5/
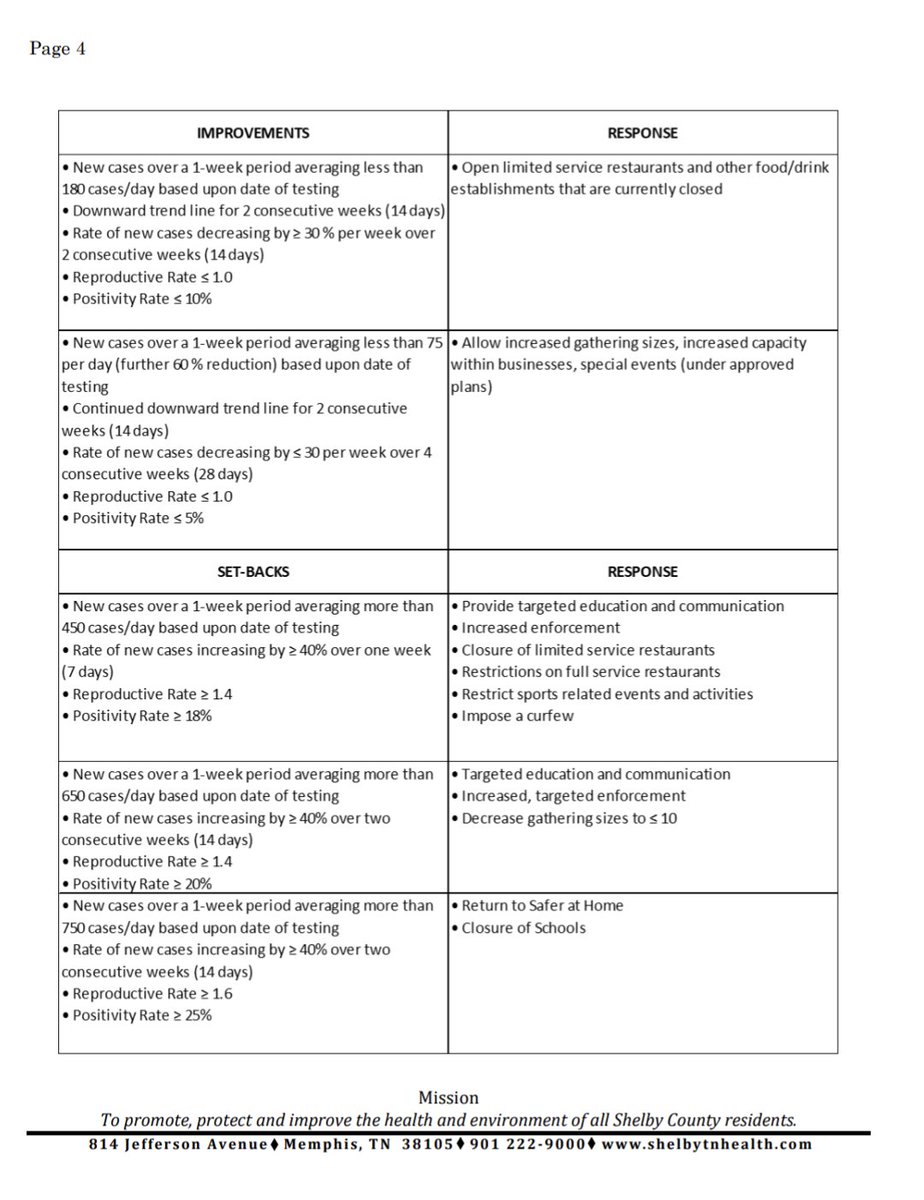
First, let's look at how this is written.
It's a list of bullet points, with no explanation. Does it mean any of these metrics, or does it mean all of them?
We don't know, bc this is a poorly written document. And we can't get answers bc they dropped it quietly to avoid Qs.
6/
It's a list of bullet points, with no explanation. Does it mean any of these metrics, or does it mean all of them?
We don't know, bc this is a poorly written document. And we can't get answers bc they dropped it quietly to avoid Qs.
6/
Let's look at the first trip wire.
It honestly looks like they dragged their feet - remember, the White House team rec'd trip wires during their visit back over the July 4 wknd - to see how high cases would go...just so they could set the trips higher than that.
7/
It honestly looks like they dragged their feet - remember, the White House team rec'd trip wires during their visit back over the July 4 wknd - to see how high cases would go...just so they could set the trips higher than that.
7/
Evidence:
The first trip was set at 450 daily cases & 18%pos.
Last wk, we were at 425 & 17%.
And then they grinded testing to a halt - the lowest in 6wks - to artificially reduce case identification.
Then they finally set the trips we've been waiting on for 5wks just above.
8/
The first trip was set at 450 daily cases & 18%pos.
Last wk, we were at 425 & 17%.
And then they grinded testing to a halt - the lowest in 6wks - to artificially reduce case identification.
Then they finally set the trips we've been waiting on for 5wks just above.
8/
Back to that first trip.
I don't track the reproductive rate bc that's really complex. And notice that, even though it's incredibly important, no one ever talks about it.
But notice that they set the trip at 1.4, which is again just higher than we've ever reached.
9/
I don't track the reproductive rate bc that's really complex. And notice that, even though it's incredibly important, no one ever talks about it.
But notice that they set the trip at 1.4, which is again just higher than we've ever reached.
9/
Last thing on that first trip: that 40% increase.
Let's say we jump from a 6wk low in testing to a high. We do 20k tests, or 2857/day, a 49% increase.
Cases probably spike too, say to 2500, or 357/day. Not even a record, but +44%.
Why should that trip a wire?
No sense.
10/
Let's say we jump from a 6wk low in testing to a high. We do 20k tests, or 2857/day, a 49% increase.
Cases probably spike too, say to 2500, or 357/day. Not even a record, but +44%.
Why should that trip a wire?
No sense.
10/
Okay, now look at the "response" to the trip wire.
Targeted education & communication? Increased enforcement? They ain't doing that already?
Closing bars & restrictions on restaurants? How is this new?
Restrict sports? What restrictions?
Impose a curfew? Wtf is this?
11/
Targeted education & communication? Increased enforcement? They ain't doing that already?
Closing bars & restrictions on restaurants? How is this new?
Restrict sports? What restrictions?
Impose a curfew? Wtf is this?
11/
I'm gong to skip that second trip bc it seems pretty pointless.
More education, communication, & enforcement.
The only thing new here is decreasing gatherings to 10.
12/
More education, communication, & enforcement.
The only thing new here is decreasing gatherings to 10.
12/
Let's look at the third trip, which would trigger stay-home orders and close schools.
What would trigger this?
The apocalyptic scenario in which we have 750 covid cases per day over a full wk...but even then only w/a 14-day increase of 40%, an R0 of 1.6, & a 25% pos rate.
13/
What would trigger this?
The apocalyptic scenario in which we have 750 covid cases per day over a full wk...but even then only w/a 14-day increase of 40%, an R0 of 1.6, & a 25% pos rate.
13/
Context: The only way they will close schools & shut down biz is if we have a wk w/75% more cases than the highest wk to date...
& then only if that's up 40% over 2wks...
& then only if R0 is +25% over the record.
& then only if the pos rate is 47% higher than the record.
14/
& then only if that's up 40% over 2wks...
& then only if R0 is +25% over the record.
& then only if the pos rate is 47% higher than the record.
14/
Essentially, they created the trip wires doc just to satisfy the demand for trip wires. They have no intent of ever actually using this doc.
If this is their best effort, they obviously have no interest in public safety & containing the spread of covid.
15/
If this is their best effort, they obviously have no interest in public safety & containing the spread of covid.
15/
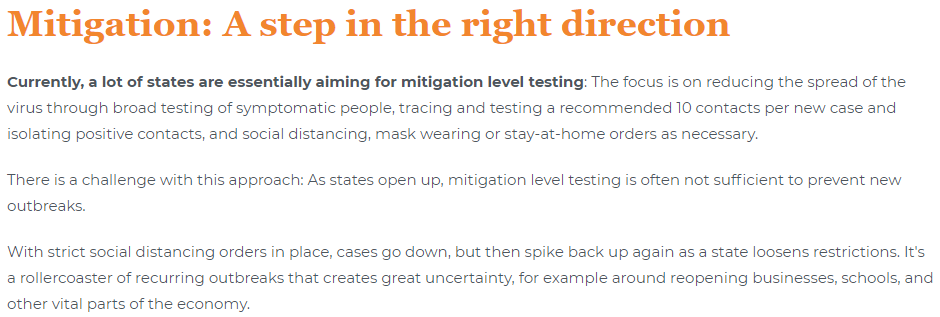
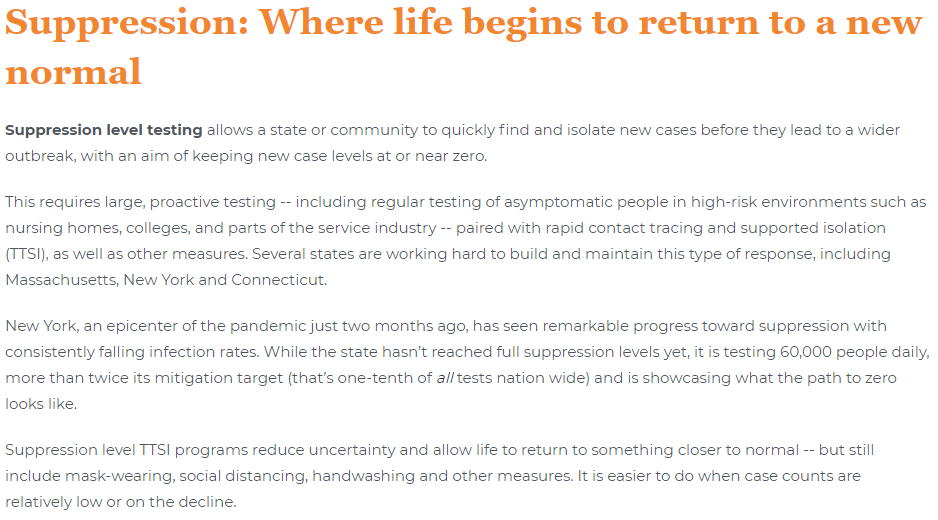
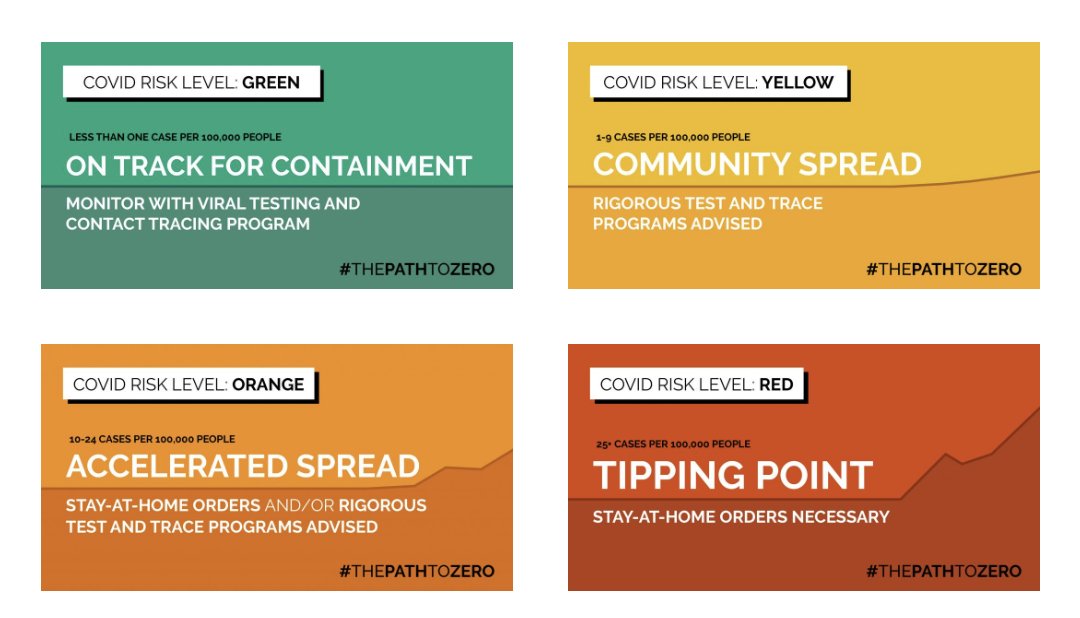
Now let's look at real covid metrics.
This is from Harvard's Global Health Institute and Center for Ethics. They look at case rates (per 100k) and positivity rates.
The key is moving from mitigation to suppression.
You can read more here: globalepidemics.org/key-metrics-fo…
16/
This is from Harvard's Global Health Institute and Center for Ethics. They look at case rates (per 100k) and positivity rates.
The key is moving from mitigation to suppression.
You can read more here: globalepidemics.org/key-metrics-fo…
16/
I wrote about this in the @dailymemphian last week.
dailymemphian.com/section/opinio…
The gap b/t Harvard & our health dept is enormous.
Harvard says you have to shut down at 25 daily cases per 100k, or 234 cases locally.
Our health dept says 750 cases, or 80 per 100k. 3x higher!
17/
dailymemphian.com/section/opinio…
The gap b/t Harvard & our health dept is enormous.
Harvard says you have to shut down at 25 daily cases per 100k, or 234 cases locally.
Our health dept says 750 cases, or 80 per 100k. 3x higher!
17/
To reiterate...
Our health dept set the bar for stay-home orders 3x higher than Harvard. (And won't close schools unless we reach that bar.)
Who do you trust more, the Shelby County Health Dept, or Harvard's Global Health Institute and Center for Ethics?
18/
Our health dept set the bar for stay-home orders 3x higher than Harvard. (And won't close schools unless we reach that bar.)
Who do you trust more, the Shelby County Health Dept, or Harvard's Global Health Institute and Center for Ethics?
18/
Alright, I'm done with the trip wires.
They're garbage.
And you (we) need to all raise hell with all of your local representatives. Flood the mayors, the city councilors, the county commissioners, the school board, etc.
Let our leaders know that this is not good enough.
19/
They're garbage.
And you (we) need to all raise hell with all of your local representatives. Flood the mayors, the city councilors, the county commissioners, the school board, etc.
Let our leaders know that this is not good enough.
19/
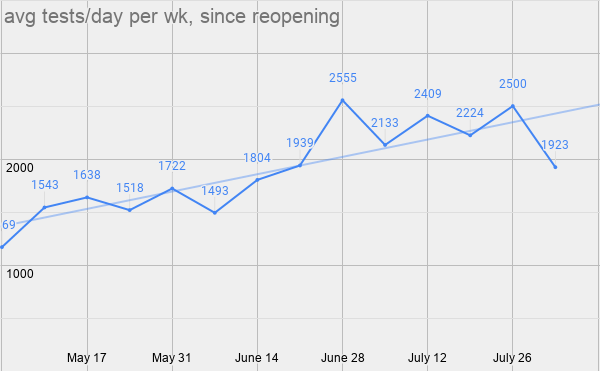
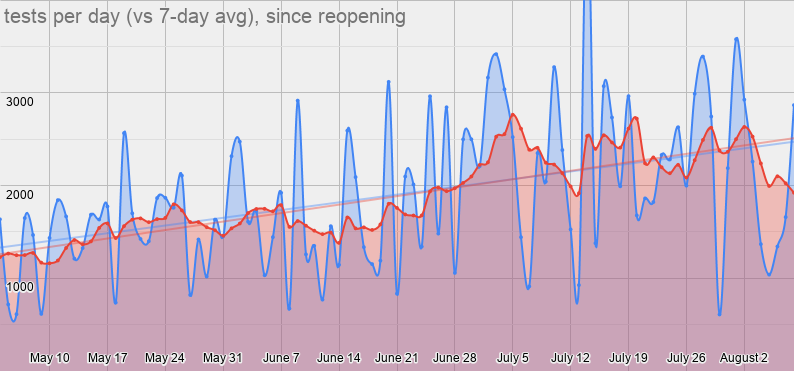
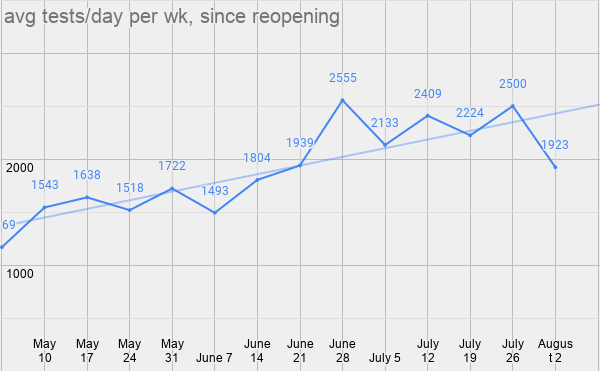
Okay, let's look at the data, starting with testing.
As you can see, testing is down.
Way down.
Down 23% from last wk, down 25% from our high 5wks ago.
This is a huge problem bc there are only 3 ways to contain the virus: vaccine, test/trace/isolate, lockdown.
20/
As you can see, testing is down.
Way down.
Down 23% from last wk, down 25% from our high 5wks ago.
This is a huge problem bc there are only 3 ways to contain the virus: vaccine, test/trace/isolate, lockdown.
20/


The lack of testing means we don't have "eyes" on the spread of the virus.
And we know this anyway bc we are restricting access to testing. Ppl w/no symptoms can't get tested (unless they have a known exposure).
As a result, spread is happening.
21/
And we know this anyway bc we are restricting access to testing. Ppl w/no symptoms can't get tested (unless they have a known exposure).
As a result, spread is happening.
21/
Here's the other thing: Trump is right, in that identified cases will go down when you stop testing. But, that's different from actual cases.
When you stop testing, your data are inaccurate, you have no idea what's actually happening, and you could crash at any time.
22/
When you stop testing, your data are inaccurate, you have no idea what's actually happening, and you could crash at any time.
22/
I should also note that the health dept added a chart with cases by specimen collection date, but I can't show it bc it's currently offline.
But yesterday, although most cases were from Aug1 (still 6days old!), some were still trickling in from as far back as July 4.
23/
But yesterday, although most cases were from Aug1 (still 6days old!), some were still trickling in from as far back as July 4.
23/
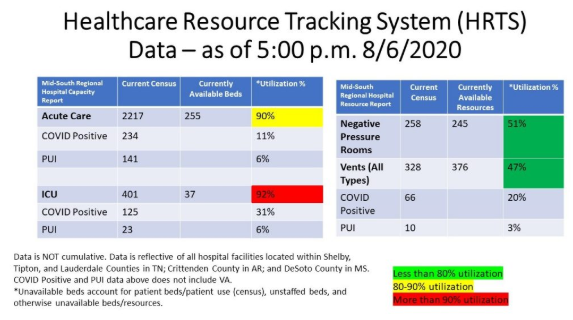
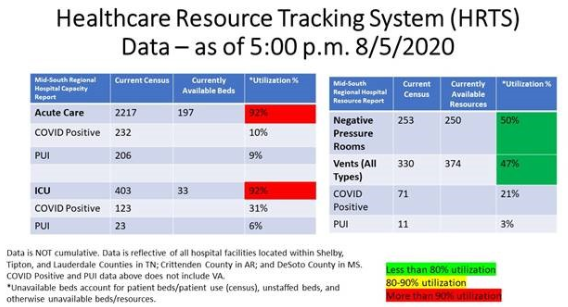
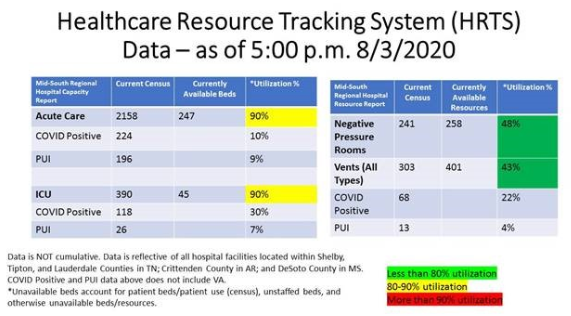
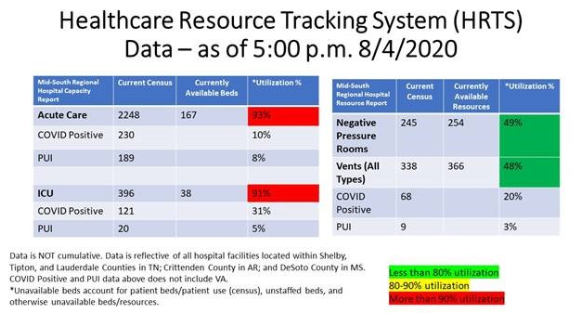
With our case data suspect bc of testing, this is where hospitalization data become more important.
I don't usually talk about this bc I think the bar should be to contain the virus, period.
But we keep pushing into the RED for acute care and ICU beds.
24/
I don't usually talk about this bc I think the bar should be to contain the virus, period.
But we keep pushing into the RED for acute care and ICU beds.
24/
Almost done.
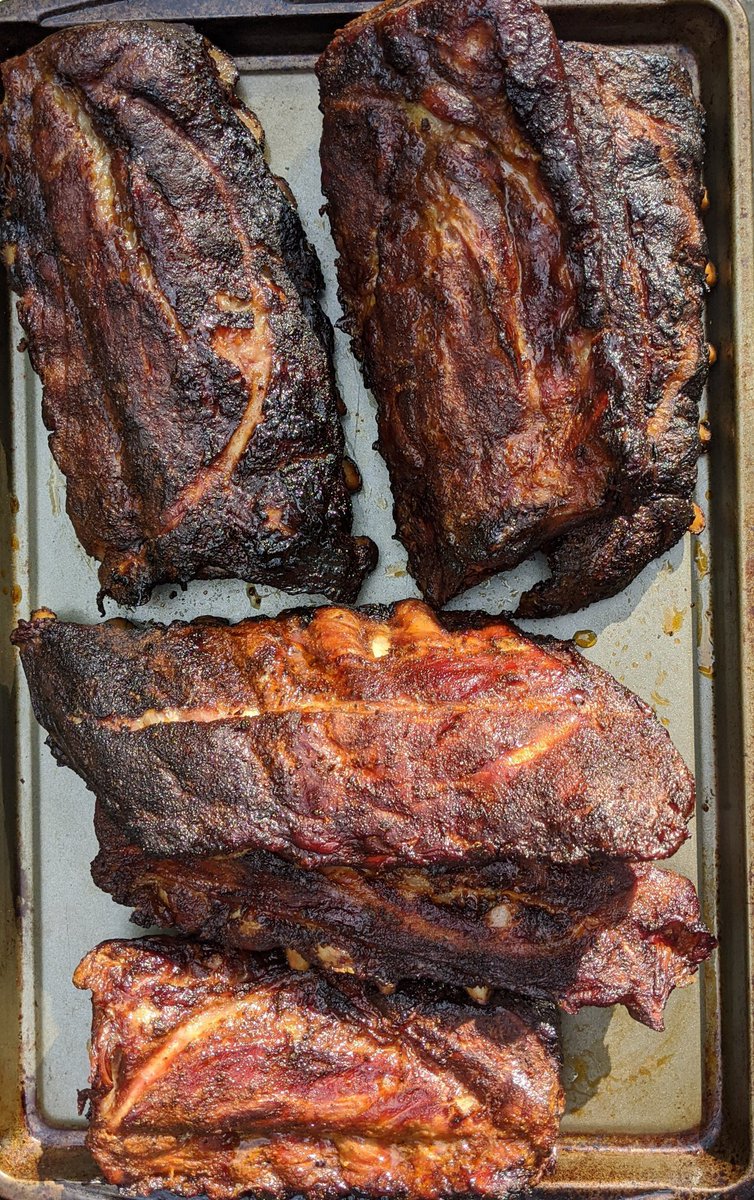
But I'm going to pause here for a sec, while I go tend to the ribs I'm smoking.
I'll be right back to talk about case numbers and positivity rates.
25/
But I'm going to pause here for a sec, while I go tend to the ribs I'm smoking.
I'll be right back to talk about case numbers and positivity rates.
25/
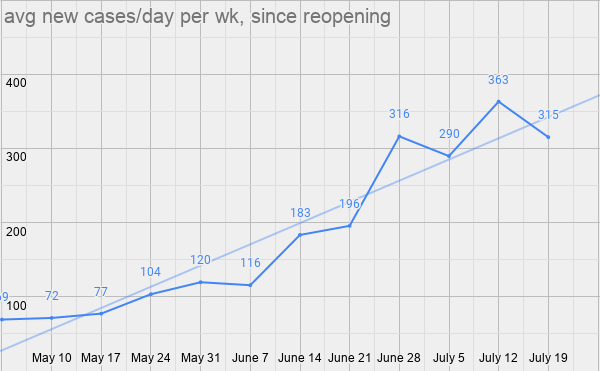
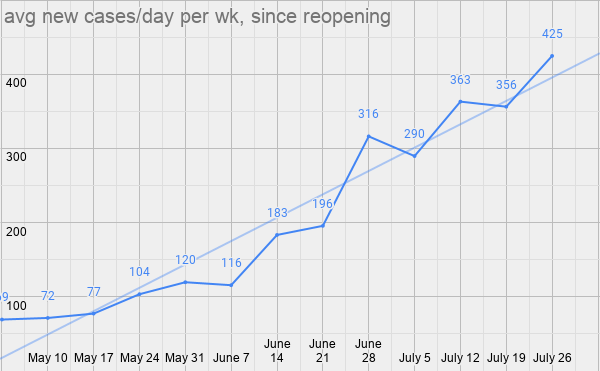
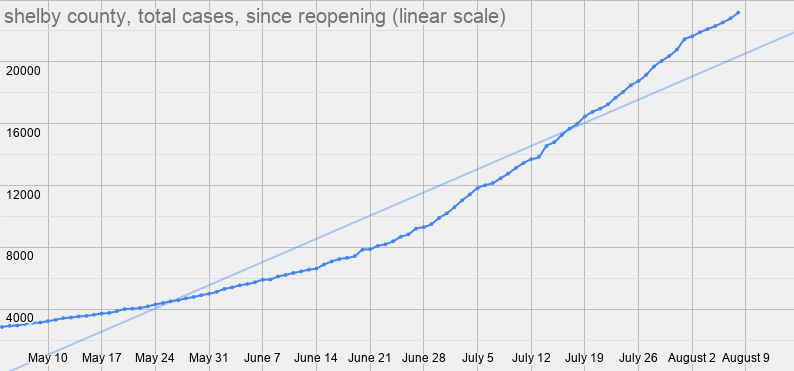
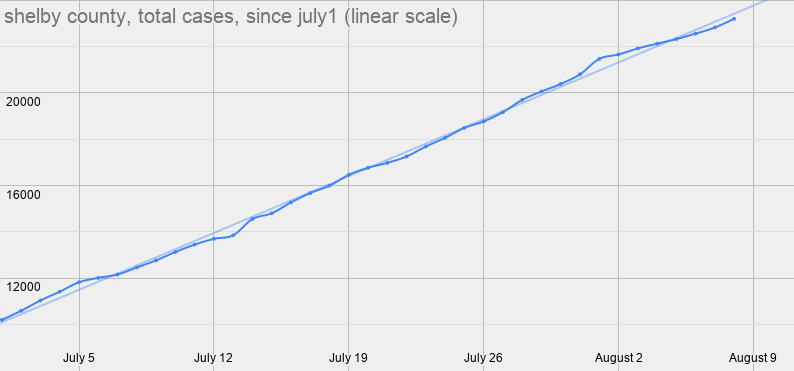
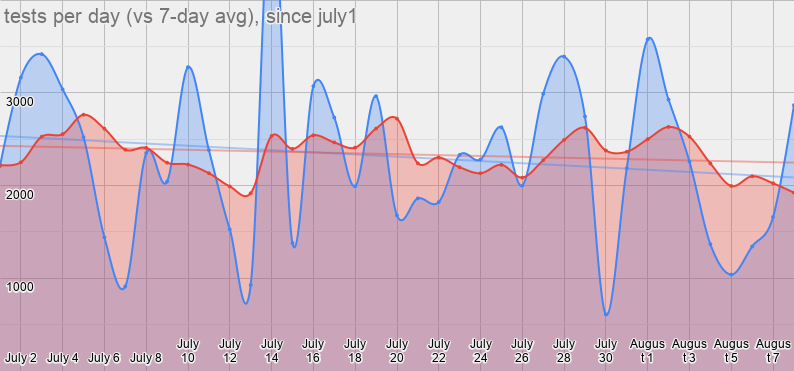
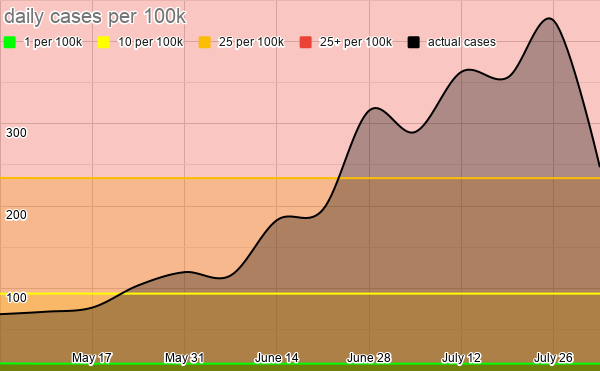
Here are total cases.
Notice that when you zoom in and just look at the data since July1, for the first time in a long time, the graph falls below the trendline.
But notice, too, that's it's pretty close to the trendline. This will be important to keep in mind.
26/
Notice that when you zoom in and just look at the data since July1, for the first time in a long time, the graph falls below the trendline.
But notice, too, that's it's pretty close to the trendline. This will be important to keep in mind.
26/
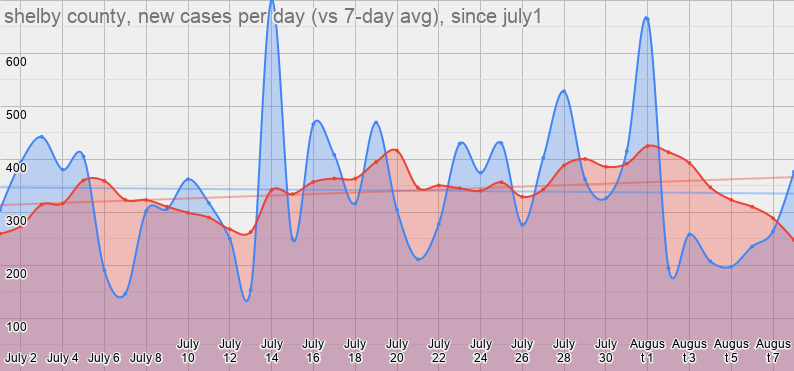
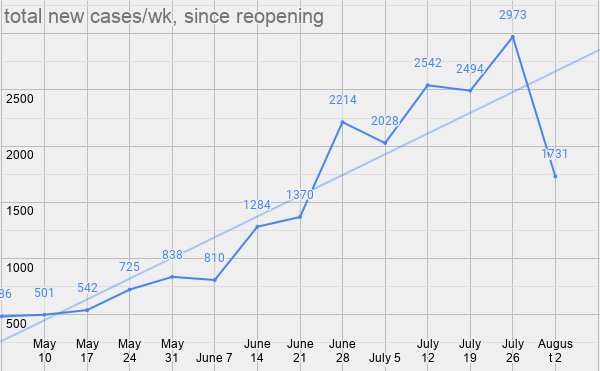
Here's daily & wkly cases.
You'll note that daily cases kind of fall off a cliff to start this wk. But note, too, that they pick up again at the end of the wk.
And you can't help but notice the way the wkly graph falls off a cliff. There's something super fishy there.
27/
You'll note that daily cases kind of fall off a cliff to start this wk. But note, too, that they pick up again at the end of the wk.
And you can't help but notice the way the wkly graph falls off a cliff. There's something super fishy there.
27/
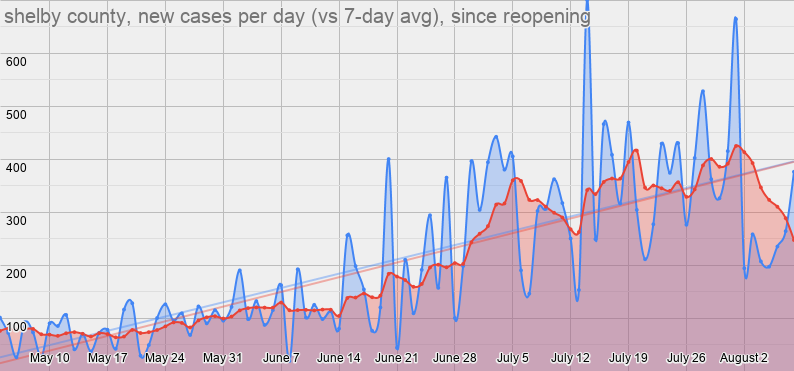
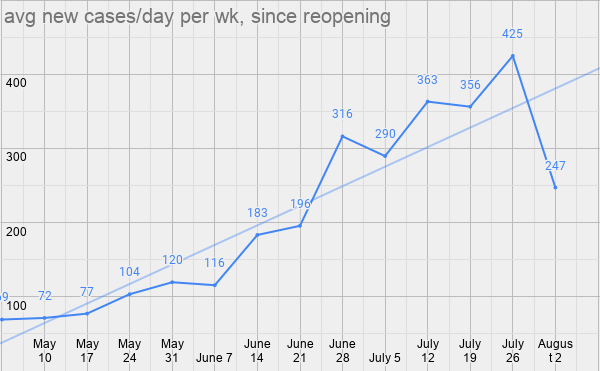
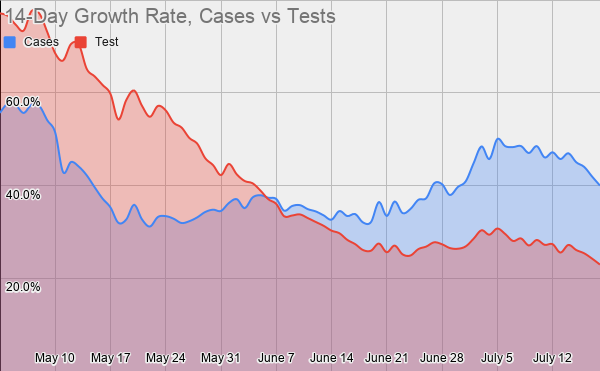
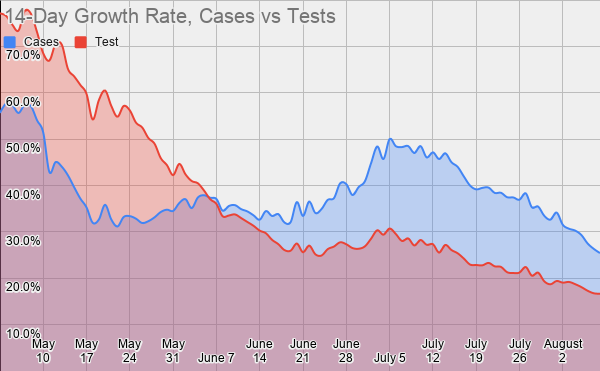
Notice that the shape of the case graphs largely mirrors the shape of the testing graphs.
This is bc we less testing means we find fewer cases.
28/
This is bc we less testing means we find fewer cases.
28/
Here's the part that gives me hope.
Very cautious hope, but still hope.
The 14-day growth rate for cases is now "only" 53% more than the growth rate for tests. (I say "only" bc a wk ago it was 76%.)
In other words, both are down, but cases are down more.
That's good.
29/
Very cautious hope, but still hope.
The 14-day growth rate for cases is now "only" 53% more than the growth rate for tests. (I say "only" bc a wk ago it was 76%.)
In other words, both are down, but cases are down more.
That's good.
29/
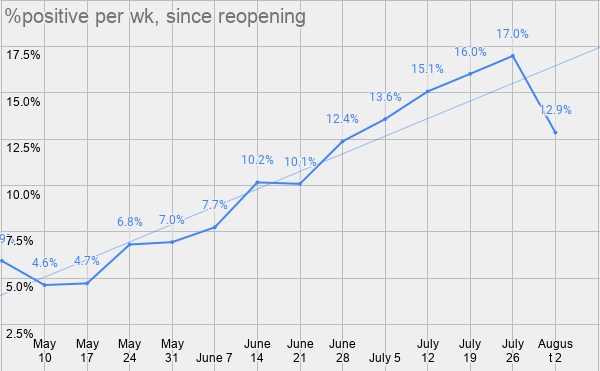
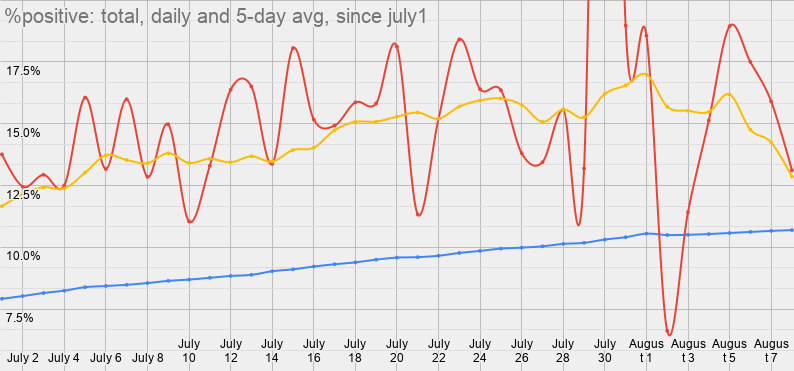
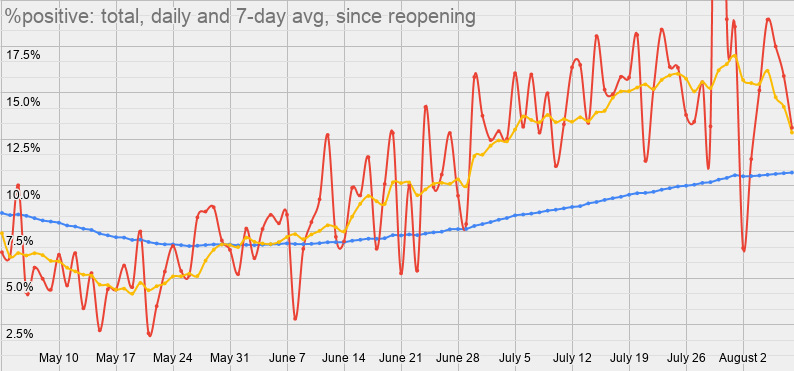
As a result, the positivity rate is down.
Again, very cautious optimism.
But look at the daily rate, when zoomed in since July1. This is what concerns me. You've got one super low day that really impacts the 7-day avg.
The 14-day avg, though, is still over 15%.
30/
Again, very cautious optimism.
But look at the daily rate, when zoomed in since July1. This is what concerns me. You've got one super low day that really impacts the 7-day avg.
The 14-day avg, though, is still over 15%.
30/
So how are we doing on those Harvard metrics?
Well, even with our case rate artificially down to our lowest levels in 6wks, we are STILL at 26 daily cases per 100k.
In other words, STILL in the range where Harvard says stay-at-home orders are necessary!
31/
Well, even with our case rate artificially down to our lowest levels in 6wks, we are STILL at 26 daily cases per 100k.
In other words, STILL in the range where Harvard says stay-at-home orders are necessary!
31/
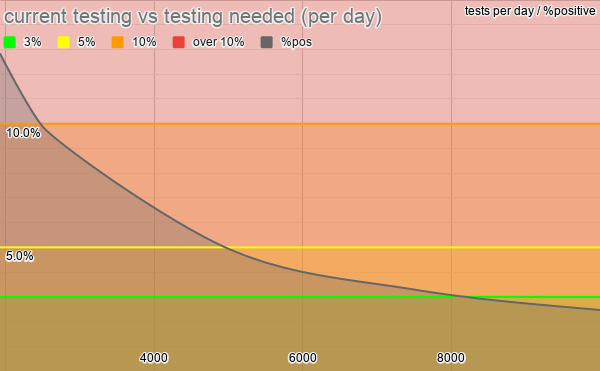
And our positivity rate this wk was at 12.9% this wk, with only 1923 daily tests.
With 247 daily cases, we would need 2500 tests (+30%) to get under 10%.
We'd need 5000 (+160%) to get under 5%.
And we'd need 8500 (+342%) to get under 3%.
We must do more testing, period.
32/
With 247 daily cases, we would need 2500 tests (+30%) to get under 10%.
We'd need 5000 (+160%) to get under 5%.
And we'd need 8500 (+342%) to get under 3%.
We must do more testing, period.
32/
In Thursday's briefing, Dr. Randolph was specifically asked about our testing capacity and how much of that capacity we were currently using.
His response was damning: "I cannot answer that."
That's absolutely inexcusable!
How do you not know how many tests we can run?
33/
His response was damning: "I cannot answer that."
That's absolutely inexcusable!
How do you not know how many tests we can run?
33/
He went on to say that our goal is 2400 tests per day.
Look: 2400 tests doesn't even get us below 10% with a 6wk low in cases! (It gets you to 10.3%.)
How is that the goal?
This is simply inexcusable.
34/
Look: 2400 tests doesn't even get us below 10% with a 6wk low in cases! (It gets you to 10.3%.)
How is that the goal?
This is simply inexcusable.
34/
There was also a question about whether the drop in testing meant that we were missing cases.
Again, the response is just damning: "Our hope is that we're not missing people."
WE KNOW WE ARE MISSING CASES!
WE'RE LIMITING TESTING!
35/
Again, the response is just damning: "Our hope is that we're not missing people."
WE KNOW WE ARE MISSING CASES!
WE'RE LIMITING TESTING!
35/
When asked about why testing is down, he said that some may not have symptoms and others may be tired of the delays. Either way, he said, maybe they don't see the point.
This seems right.
But this didn't alarm him.
36/
This seems right.
But this didn't alarm him.
36/
It really alarms me, though.
People have lost faith in our public health system. The lack of testing and the delays in testing have undermined the credibility of our covid response.
And that's dangerous.
We need the health dept to regain some trust and goodwill.
37/
People have lost faith in our public health system. The lack of testing and the delays in testing have undermined the credibility of our covid response.
And that's dangerous.
We need the health dept to regain some trust and goodwill.
37/
But that won't happen unless they start being straight and honest about the situation.
Gov Cuomo screwed up the initial covid response in NY. But then he shifted gears and gained trust by telling the hard truths.
That's what we're missing: Hard truths.
38/
Gov Cuomo screwed up the initial covid response in NY. But then he shifted gears and gained trust by telling the hard truths.
That's what we're missing: Hard truths.
38/
And the hard truth is that we're not even close to where we need to be.
We need to get below 5% positive, and that means over 2.5x more testing.
We need to get below 10 daily cases per 100k, and that means 2.5x fewer cases.
39/
We need to get below 5% positive, and that means over 2.5x more testing.
We need to get below 10 daily cases per 100k, and that means 2.5x fewer cases.
39/
The hard truth is that, if we would have shut down six wks ago, when we first crossed the threshold set by Harvard, we'd be safely reopening schools in-person on Aug31.
And we would be back to about 90% capacity w/our businesses.
But we didn't. Now we're paying the price.
40/
And we would be back to about 90% capacity w/our businesses.
But we didn't. Now we're paying the price.
40/
The hard truth is that reopening has been a disaster.
But the good news, as @ASlavitt reminds us, is that we're always just 4-6wks away from containment.
And: "virtually every death from here is preventable."
41/
But the good news, as @ASlavitt reminds us, is that we're always just 4-6wks away from containment.
And: "virtually every death from here is preventable."
41/
Okay, that's all.
Sorry that was super long today. But those trip wires got me trippin'.
Anyway, who am I, and why should you care about my analysis?
Read here. (Also, I updated the archives, so you can see my analysis going back to April.)
firstresponses.blogspot.com/2020/06/covid-…
42/42
Sorry that was super long today. But those trip wires got me trippin'.
Anyway, who am I, and why should you care about my analysis?
Read here. (Also, I updated the archives, so you can see my analysis going back to April.)
firstresponses.blogspot.com/2020/06/covid-…
42/42
In case you wanted to know how the ribs turned out...