
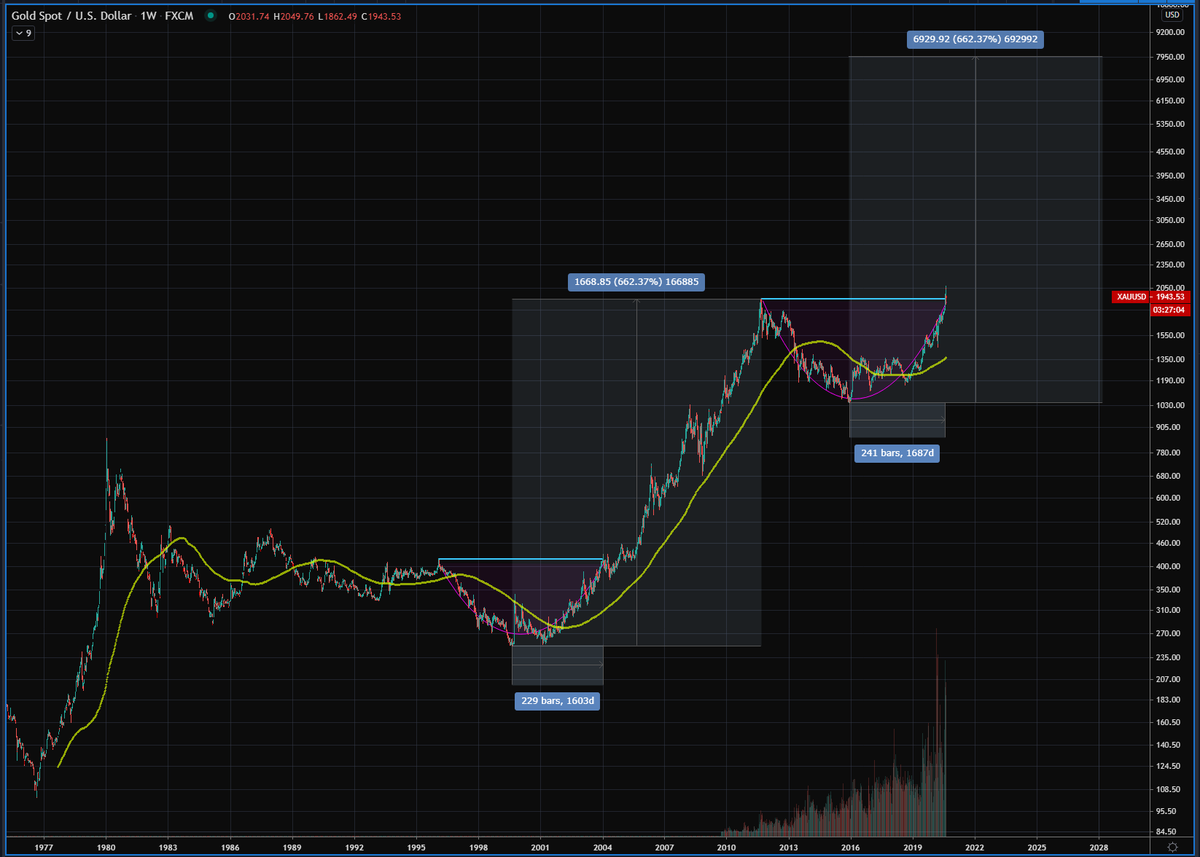
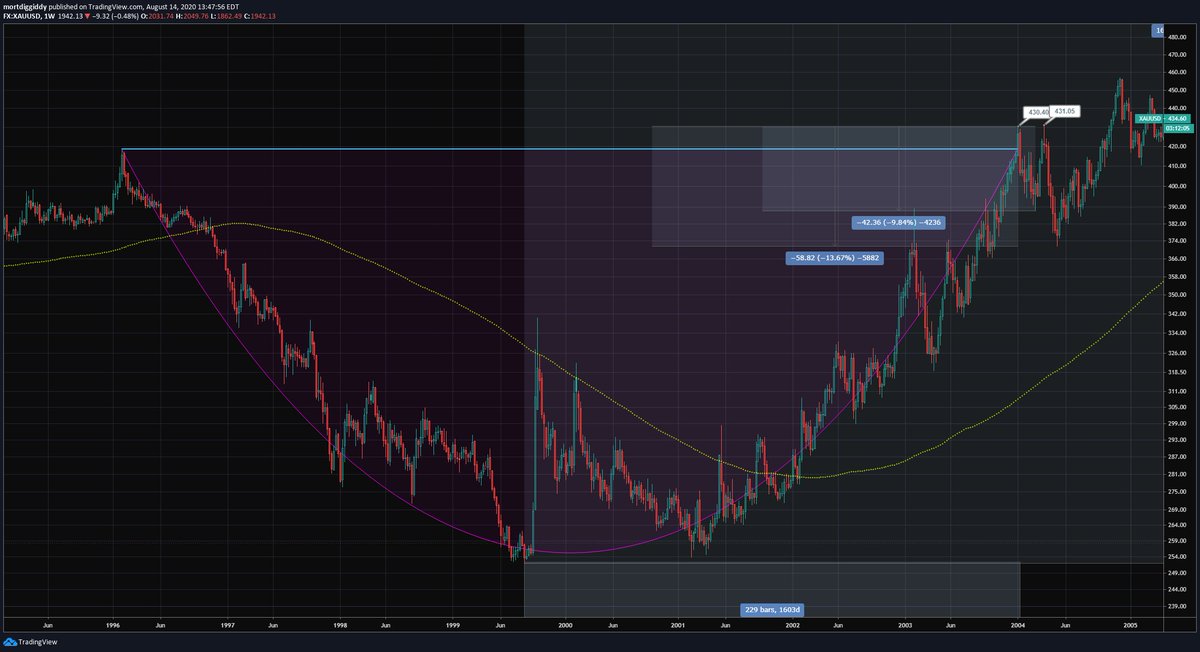
I like to drink bourbon and make crazy charts. I find it interesting that the year 1996 – 2004 rounded bottom is about the same length in total days as the 2011 – 2020 rounded bottom. From that bottom in 1999 we had a 662% increase that took 6 years once the breakout started $GLD 
The correction in 2004 right after the breakout dropped gold a little less than 10%. The high was retested, and then it made another low to make a 13% correction.
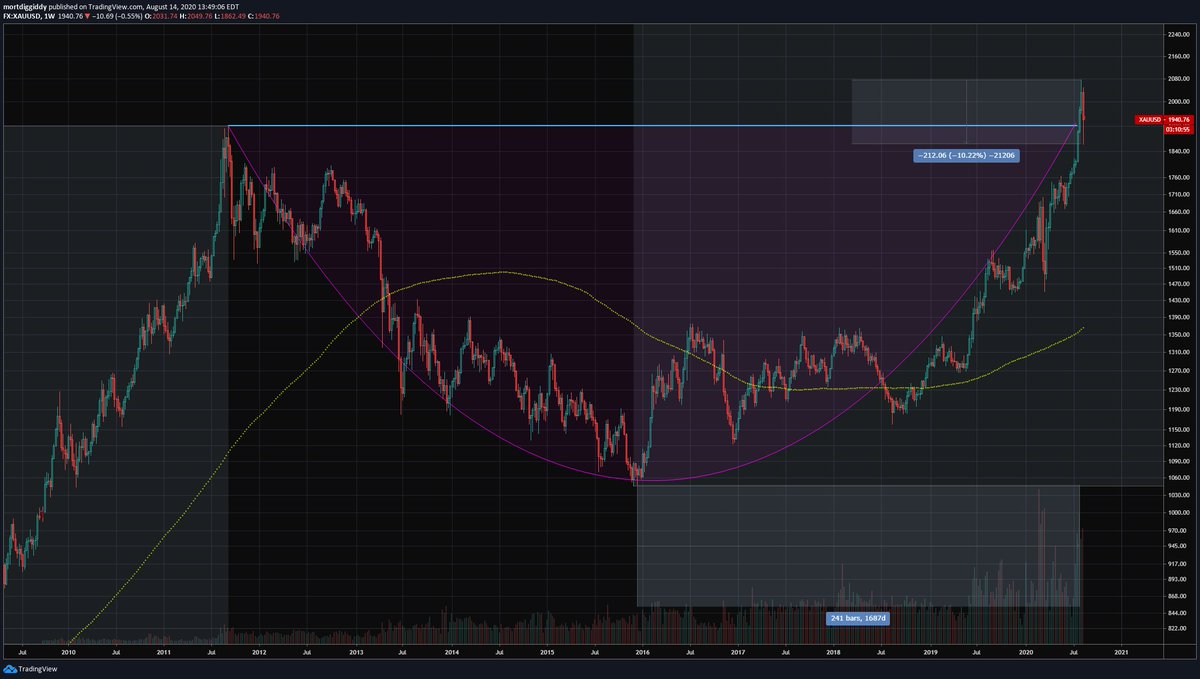
When gold broke the 2011 high, we had about a 10% correction again.
$GLD $SLV
When gold broke the 2011 high, we had about a 10% correction again.
$GLD $SLV
Gold seasonality ends on SEP 2 on avg for the last 10 years. This “little” correction we have had is actually right on schedule. It is big yes, but that is a testament to the overbought level it reached. $GLD had a daily RSI reading of 90.5, a value only surpassed in 1999 of 92.1
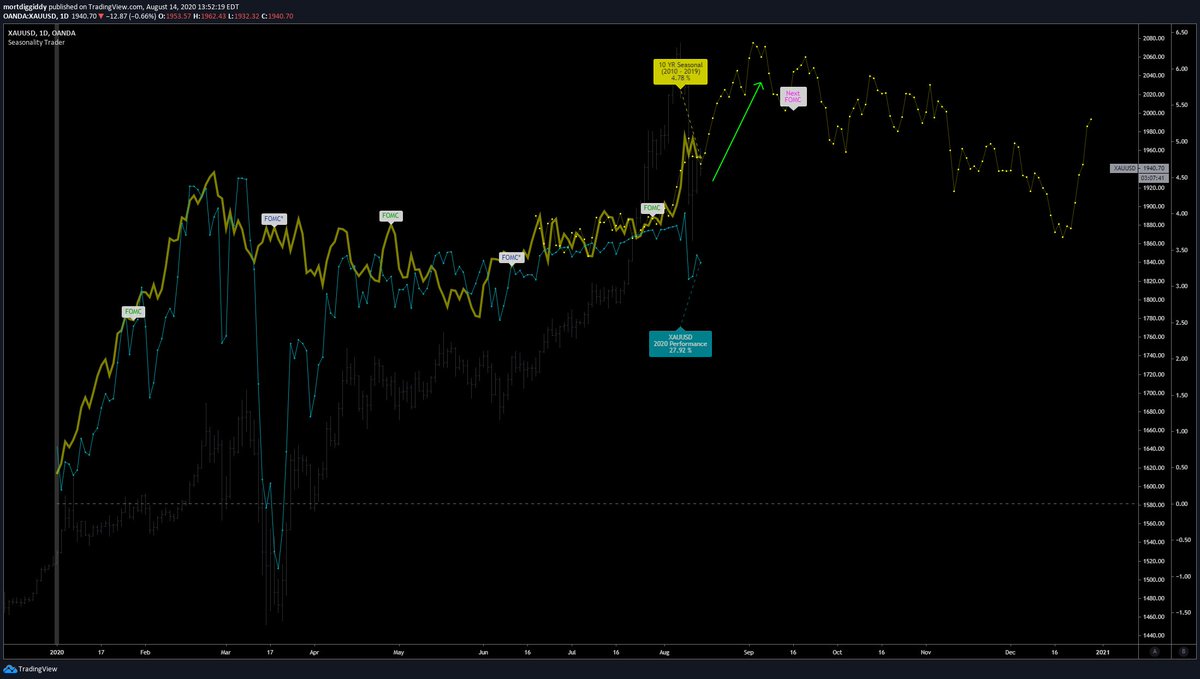
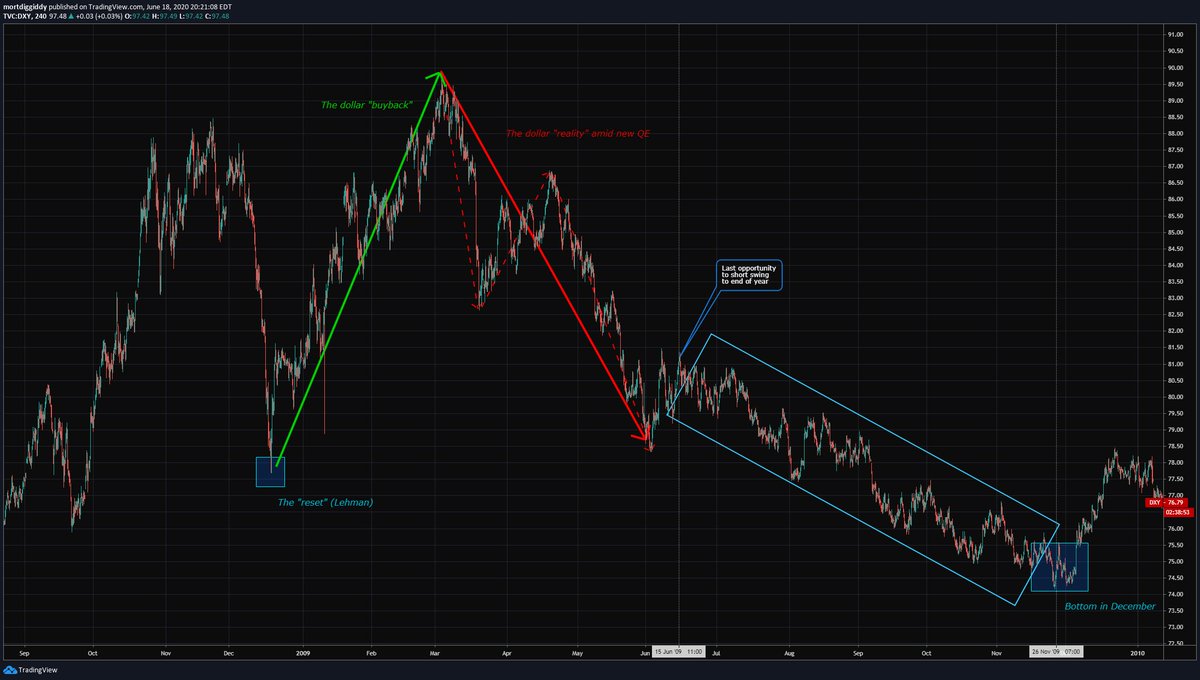
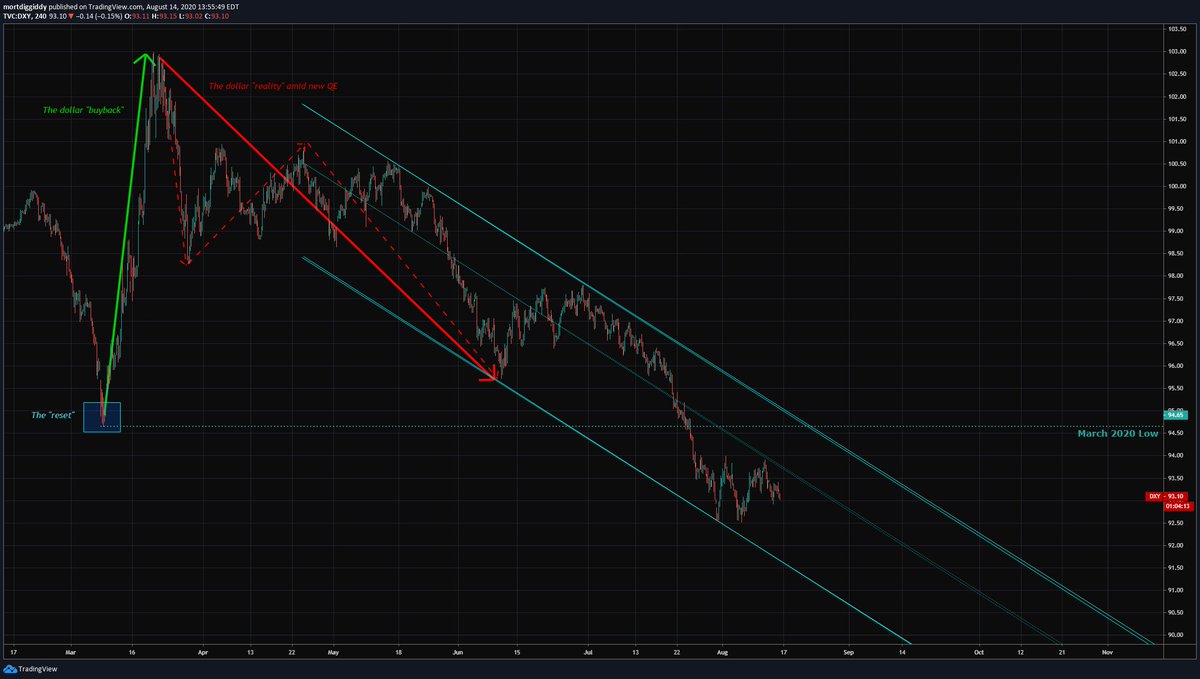
I think it is entirely possible that we revisit the high in the next two weeks to kill off the 10YR seasonality. However, if 2009 is a $DXY lesson, we could actually increase gold to the end of the year in December.
DXY in 2008 – 2009, end then 2020
DXY in 2008 – 2009, end then 2020
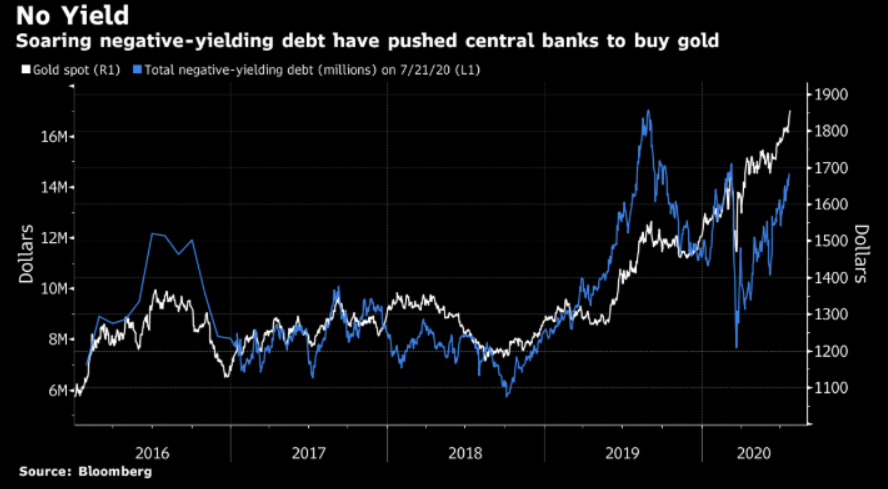
Negative yield debt breaking out again. The last time this happened was August 2019, which ended the gold 7 year lean years.
So the question is, can gold repeat the 2000s and move to $8000? Is it crazy? You decide.
Stay classy.
$GLD $SLV $GDX $GDXJ $JNUG $NUGT $DXY $TLT
So the question is, can gold repeat the 2000s and move to $8000? Is it crazy? You decide.
Stay classy.
$GLD $SLV $GDX $GDXJ $JNUG $NUGT $DXY $TLT
• • •
Missing some Tweet in this thread? You can try to
force a refresh


