Cameron Osborne Profile picture
Proprietary short and long term statistical strategies | Macro trading ideas | Find the edge
Roger Serrabassa Profile picture 1 subscribed
Aug 22, 2021 7 tweets 4 min read
What happens when the #GOLD / #SILVER ratio (GSR) hits weekly RSI overbought (happened Friday)?

Well the results may surprise you. In PM bull markets it is extremely likely that silver rises WITH gold to close the disparity.

🧵 1/

$GDX $GDXJ $DXY $SIL $SILJ $GOLD Here is a report on what has happened since 2002 when the weekly RSI reading of the gold/silver ratio reaches overbought. The RSI merely has to touch inside overbought, above 70, at the high of the weekly candle of this ratio. It does not have to close above overbought.

2/
Aug 2, 2021 6 tweets 2 min read
Took me a sec to understand this one. Inverted yields calling for a top in ISM manufacturing numbers. When those yields are shifted forward 18 months.

Decent correlation.

1/ 2/
Jul 16, 2021 9 tweets 5 min read
Odds are, most will capitulate in the next 4 weeks if $SILVER decides to do the standard final flush before the big summer rally. It's happened before, it can happen again.

Look at 2005, 2006, 2010.

🧵

$GOLD #GOLD #SILVER $GLD $SLV $DXY $SPY $VIX $GDX $GDXJ $SILJ $DXY $USD Typically gold and silver begin their summer rallies in June/July and last until late August to early September. 2020 was a good example of this.

Aug 14, 2020 5 tweets 3 min read
I like to drink bourbon and make crazy charts. I find it interesting that the year 1996 – 2004 rounded bottom is about the same length in total days as the 2011 – 2020 rounded bottom. From that bottom in 1999 we had a 662% increase that took 6 years once the breakout started $GLD Image 
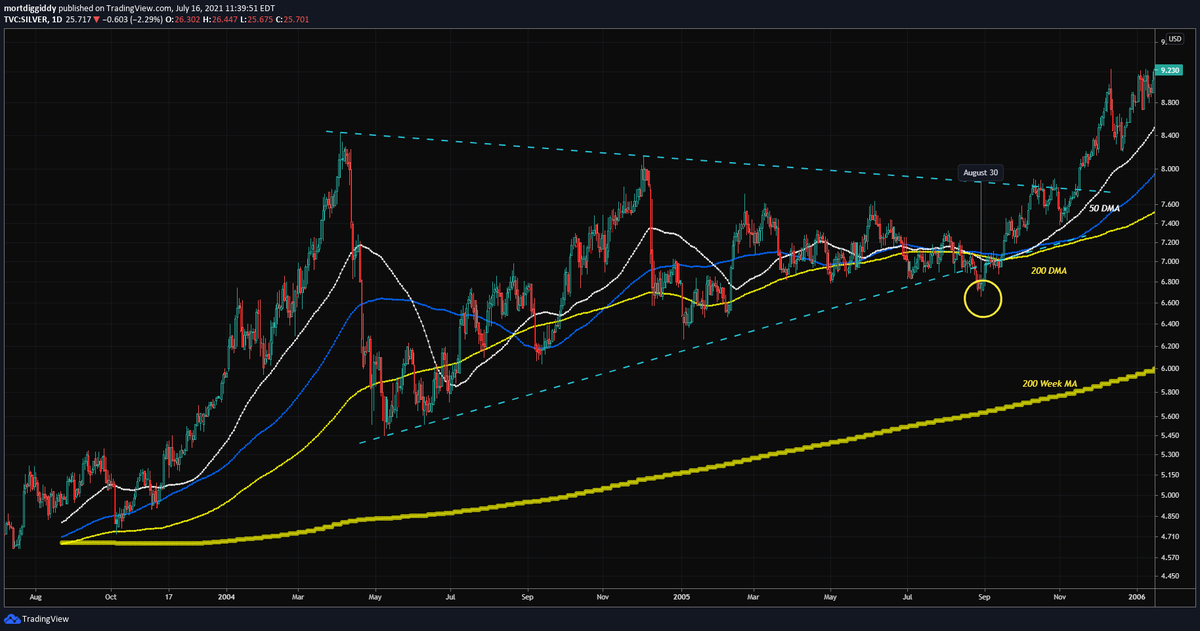
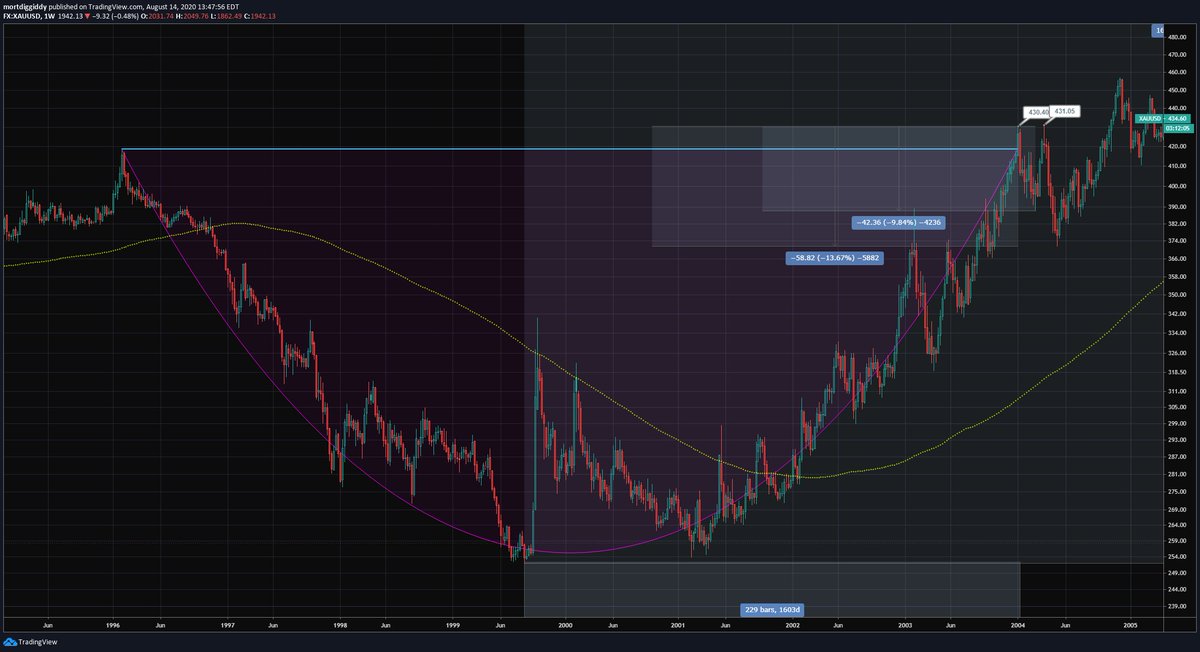
The correction in 2004 right after the breakout dropped gold a little less than 10%. The high was retested, and then it made another low to make a 13% correction.

When gold broke the 2011 high, we had about a 10% correction again.

$GLD $SLV ImageImage