As promised earlier, here I am starting thread on prediction of market direction by using simple TA.

Direction can be predicted with few minutes.

Terminologies used are -
PDR - previous day Range
PDH - Previous day High
PDL- Previous day Low

1/n
Nifty ( Market) Direction prediction by using technical Analysis -

1. If Nifty opened within previous days range & 1st 15 min candle breakout on upside then go for Bullish to Sideways View.

2/n
2. If Nifty opened within previous days range & 1st 15 min candle breakout on Downside then go for Bearish to Sideways View.

3. If Nifty opened Above previous days range & 1st 15 min candle breakout on upside then go for Bullish View.

3/n
4. If Nifty opened Above previous days range & 1st 15 min candle breakout on downside then go for Bearish to Sideways View. Change view if Nifty again reverse back from PDH and going above 1st 15 min candle.

4/n
5. If Nifty opened below previous days range & 1st 15 min candle breakout on Downside then go for Bearish View.

5/n
6. If Nifty opened below previous days range & 1st 15 min candle breakout on upside then go for Bullish to Sideways View. Change view if Nifty reversed from PDL and going below 1st 15 min candle.

Thank you. If you useful Thanks me Later. 🙏🙏.

• • •

Missing some Tweet in this thread? You can try to force a refresh
 

Keep Current with JK🇮🇳

JK🇮🇳 Profile picture

Stay in touch and get notified when new unrolls are available from this author!

Read all threads

This Thread may be Removed Anytime!

PDF

Twitter may remove this content at anytime! Save it as PDF for later use!

Try unrolling a thread yourself!

how to unroll video
  1. Follow @ThreadReaderApp to mention us!

  2. From a Twitter thread mention us with a keyword "unroll"
@threadreaderapp unroll

Practice here first or read more on our help page!

More from @PAlearner

1 Oct
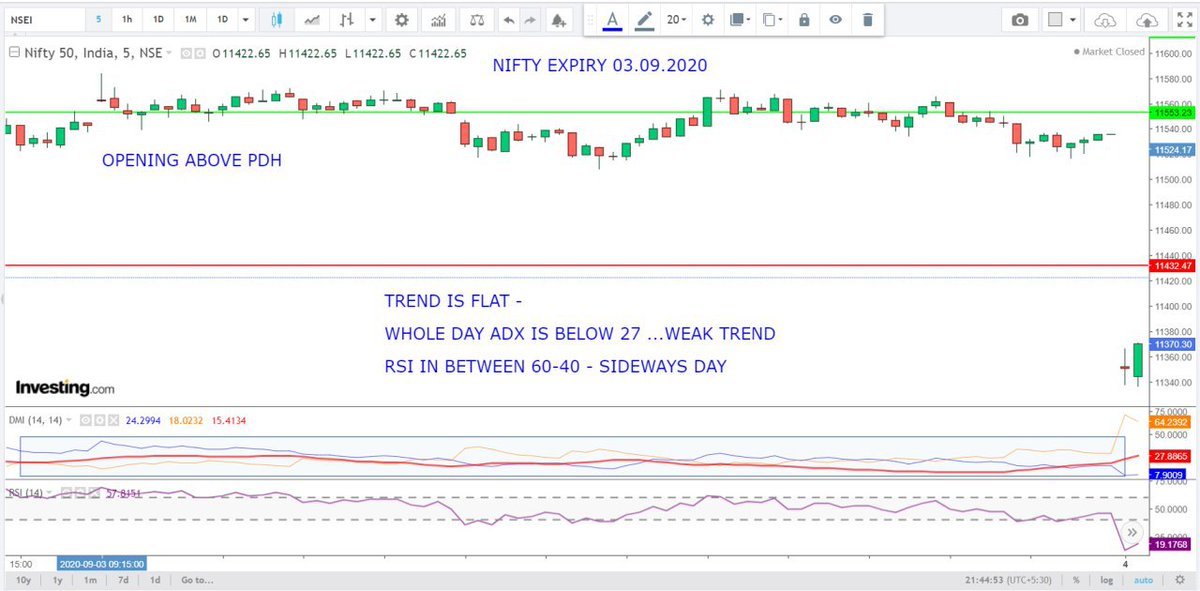
Based on ADX and RSI set up suggested by @TarunNayak2905 Analysed some charts.

Time - 5 Min

Observation -
1. ADX 27 - 15 & RSI betwee 60 - 40 - Sideways.
2. ADX above 27 & RSI above 60 - Bullish
3. ADX above 27 & RSI below 40 -
Bearish.

Check charts below -
Nifty Expiry 01.10.2017 Image
Nifty Expiry 03.09.2020 Image
Read 11 tweets
18 Jul
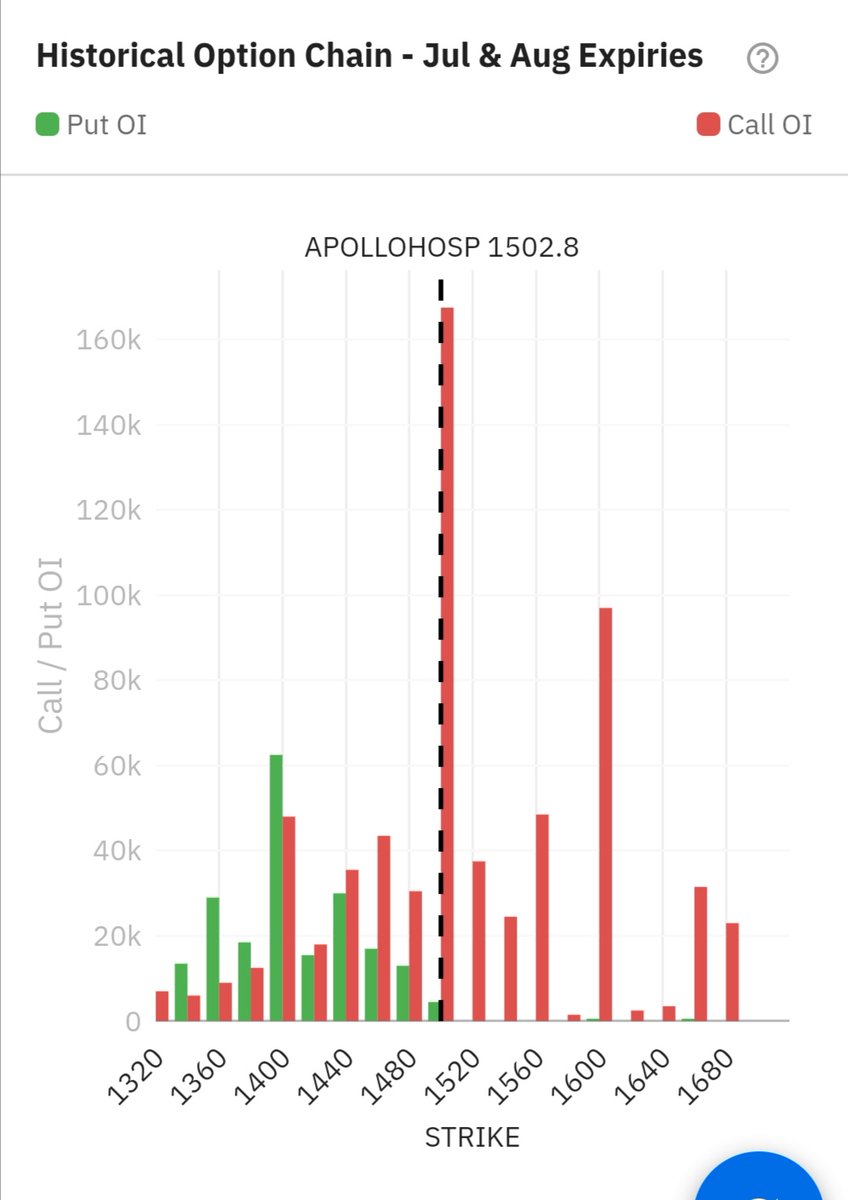
How is this breakout? Image
Here is volume - Image
Here is OI change. Image
Read 4 tweets
17 Jul
When I entered in trading in Yr 2017,
I searched for paid advisory services - I called many, there charges were like

1. Rs 10000 Per Call. Reason behind this was advisor him self paying huge to operator or so called expert to get this call.
2. Other option Rs 25000/ month
1/1
3. One option was 30% Profit sharing, No loss sharing. One day I joined one what's group, admin gave call to buy Tata global CE and PNB bank CE.
I made 60 K profit on Tata global and I lost 35 K on PNB, he started demanding 30% on 60 K. Where as 35 K loss was totally mine.
2/2.
4. This option is very lucrative, they will only charge Rs 1999 per month.
Most of the traders fall in this trap as they think this fees is very less.

Unfortunately These traps present today also.

3/3
Read 4 tweets
10 Jul
Friends ,

I was just studying my Monthly Iron condor strategy for the past months and i came up with some observation .

i found that when VIX is very low it is difficult to find good premium for IC at far away strikes .

1/1
I collected INDIA VIX Data for last 21 Months , I calculated Nifty Range based on VIX and compared it with actual Nifty Moves .

Out of 21 Months Nifty Actual move breached Vix Calculated move by 7 times that to only by 2-3% higher or lower.

see the data -
That means most of the Time Nifty follows Vix calculated move . Just take 2-3 % margin of safety.

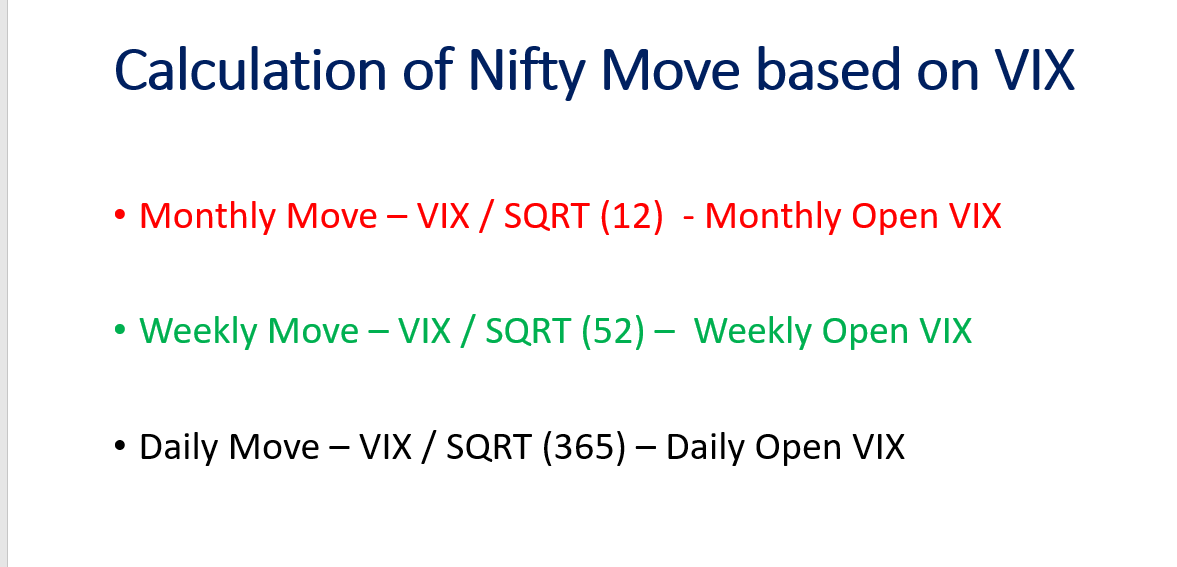
How to calculate Nifty Move From VIX ( Formula taken from Youtube videos ) -

See Below
Read 4 tweets
30 Jun
I also entered in the trading in Yr 2017 by seeing MTM screenshot on social media.
Falled in trap with some paid advisors - lost 75 % of of my capital in 2 years.
After that started learning, attended many webinars - 90% were useless - lost money there also.
1/1 Image
After that started self learning, worked hard on TA. Learned many indicators.
Tried many indicators but still trading was not getting better.
I was making some profit and again loosing it on bad trades.
2/2
Started working on price action and Risk management and Options strategies. I didn't made any loss from Dec - 2018.

Learning - There is no replacement to Self learning and Hard work.
Don't fall in trap with Paid advisors and seminars and webinars.
Find you edge and Trade.
3/3
Read 5 tweets
27 Jun
Here is Thread on Bank Nifty : -
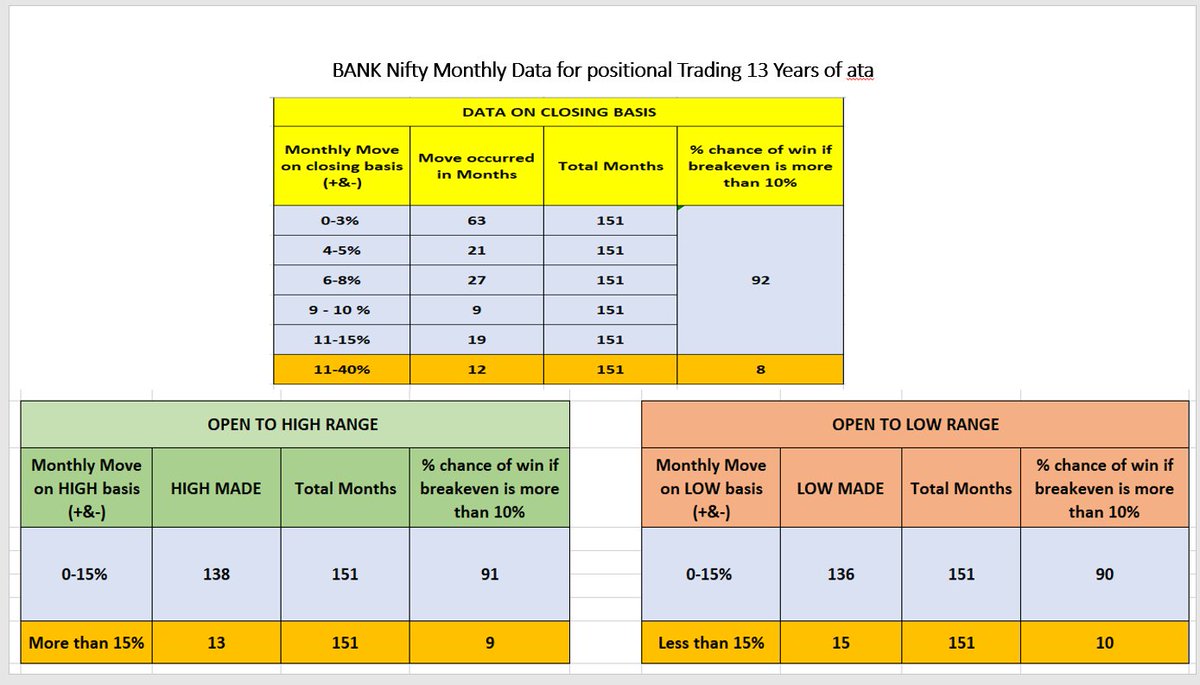
Total last 13 years of data Captured -
Note - Bank Nifty Far OTM options are very illiquid during month starting , ensure proper liquidity before entering trade . only 500 points away strikes are liquid.

Banknifty is very volatile than nifty
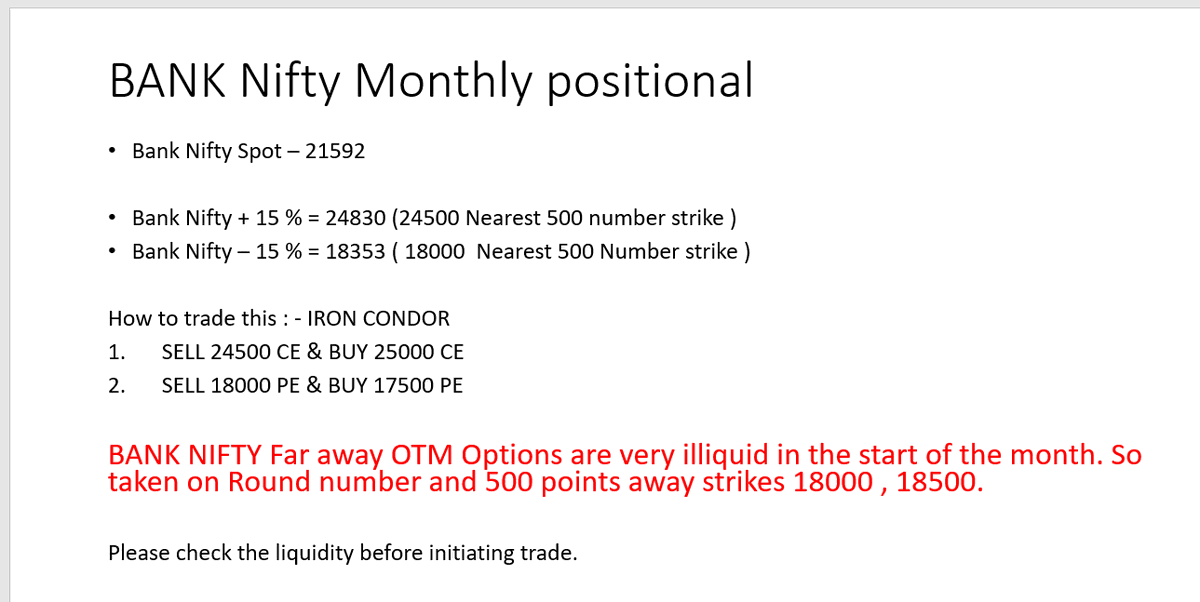
Starting with Bank Nifty Monthly data - see below pic - Data collected for past 151 month . focus on light blue area . As per data 90% of the time Nifty closed within +-15 % range from spot .
90% of the time it has not crossed 15% on higher side and also on lower side from spot
That Means if we sell options beyond 15% with hedge we can easily earn some profit every month .
See below pic - for strategy
Read 19 tweets

Did Thread Reader help you today?

Support us! We are indie developers!


This site is made by just two indie developers on a laptop doing marketing, support and development! Read more about the story.

Become a Premium Member ($3/month or $30/year) and get exclusive features!

Become Premium

Too expensive? Make a small donation by buying us coffee ($5) or help with server cost ($10)

Donate via Paypal Become our Patreon

Thank you for your support!

Follow Us on Twitter!