
New preprint:
“Computational timeline reconstruction of the stories surrounding Trump: Story turbulence, narrative control, and collective chronopathy”
arxiv.org/pdf/2008.07301…
P. S. Dodds, J. R. Minot, M. V. Arnold, T. Alshaabi, J. L. Adams, A. J. Reagan, and C. M. Danforth
“Computational timeline reconstruction of the stories surrounding Trump: Story turbulence, narrative control, and collective chronopathy”
arxiv.org/pdf/2008.07301…
P. S. Dodds, J. R. Minot, M. V. Arnold, T. Alshaabi, J. L. Adams, A. J. Reagan, and C. M. Danforth
Some questions to ask yourself and others:
What happened in the world over the last two weeks?
What about this time last year? Two years ago?
And what order did the major events happen in?
What happened in the world over the last two weeks?
What about this time last year? Two years ago?
And what order did the major events happen in?
For Trump’s presidency, how easily could individuals recall and sort these example stories?:
- North Korea
- Charlottesville
- kneeling in the National Football League
- Confederate statues
- family separation
- Stormy Daniels
- Space Force
- the possible purchase of Greenland
- North Korea
- Charlottesville
- kneeling in the National Football League
- Confederate statues
- family separation
- Stormy Daniels
- Space Force
- the possible purchase of Greenland
And how has time seemed to pass?
Fast, slow?
Is time flying or dragging?
Were there somehow 1000 days in April 2020?
Fast, slow?
Is time flying or dragging?
Were there somehow 1000 days in April 2020?
Our paper does two main things at the population scale:
1. Computationally create a list of words and phrases that represent the major storylines around some anchor.
2. Quantify story turbulence and chronopathy—the rate at which stories appear and how time seems to flow.
1. Computationally create a list of words and phrases that represent the major storylines around some anchor.
2. Quantify story turbulence and chronopathy—the rate at which stories appear and how time seems to flow.
We focus on the stories around Trump and we use Twitter as a kind of filter for distributed news aggregation.
But our methods could apply to any high volume topic on any text-rich platform.
“But Twitter is ...”
Yes, we know.
Walk with us.
But our methods could apply to any high volume topic on any text-rich platform.
“But Twitter is ...”
Yes, we know.
Walk with us.
Trump gives us one more element to study: Narrative Control.
To what extent are the dominant stories due to Trump?
Let us now operationalize (the right word but what a horrible word).
To what extent are the dominant stories due to Trump?
Let us now operationalize (the right word but what a horrible word).
We first get hold of all tweets containing “Trump” from 2015/01/01 on.
That gives us 80 billion 1-grams (words, numbers, hashtags, etc.).
In earlier work, we found that Trump is so common on Twitter that it’s tantamount to a function word, like “say”.
Lexical ultrafame:
That gives us 80 billion 1-grams (words, numbers, hashtags, etc.).
In earlier work, we found that Trump is so common on Twitter that it’s tantamount to a function word, like “say”.
Lexical ultrafame:
We create 1-gram and 2-gram usage distributions for every calendar day.
Function words like “the”, “of” etc. are at the top of these lists.
Then we compare days with each other using rank-turbulence divergence.
Thread here:
Function words like “the”, “of” etc. are at the top of these lists.
Then we compare days with each other using rank-turbulence divergence.
Thread here:
We compare each day to the same date a year before and find the most “narratively dominant” n-grams.
Aggregated at the scale of weeks, here’s our computational 1-gram historical record for Trump-matching tweets:
Aggregated at the scale of weeks, here’s our computational 1-gram historical record for Trump-matching tweets:
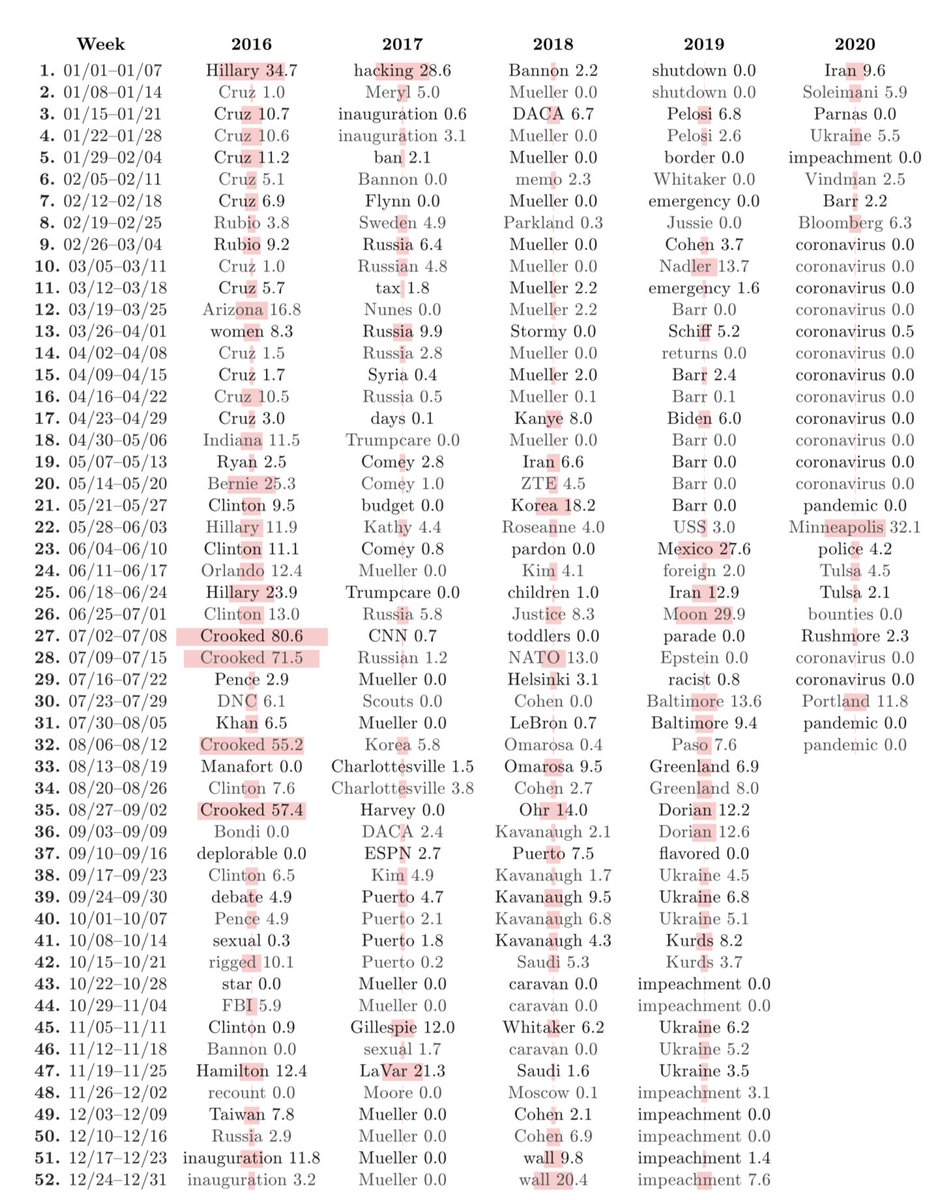
These are just the top 1-grams and each week, and each day is textured with Trump-related stories.
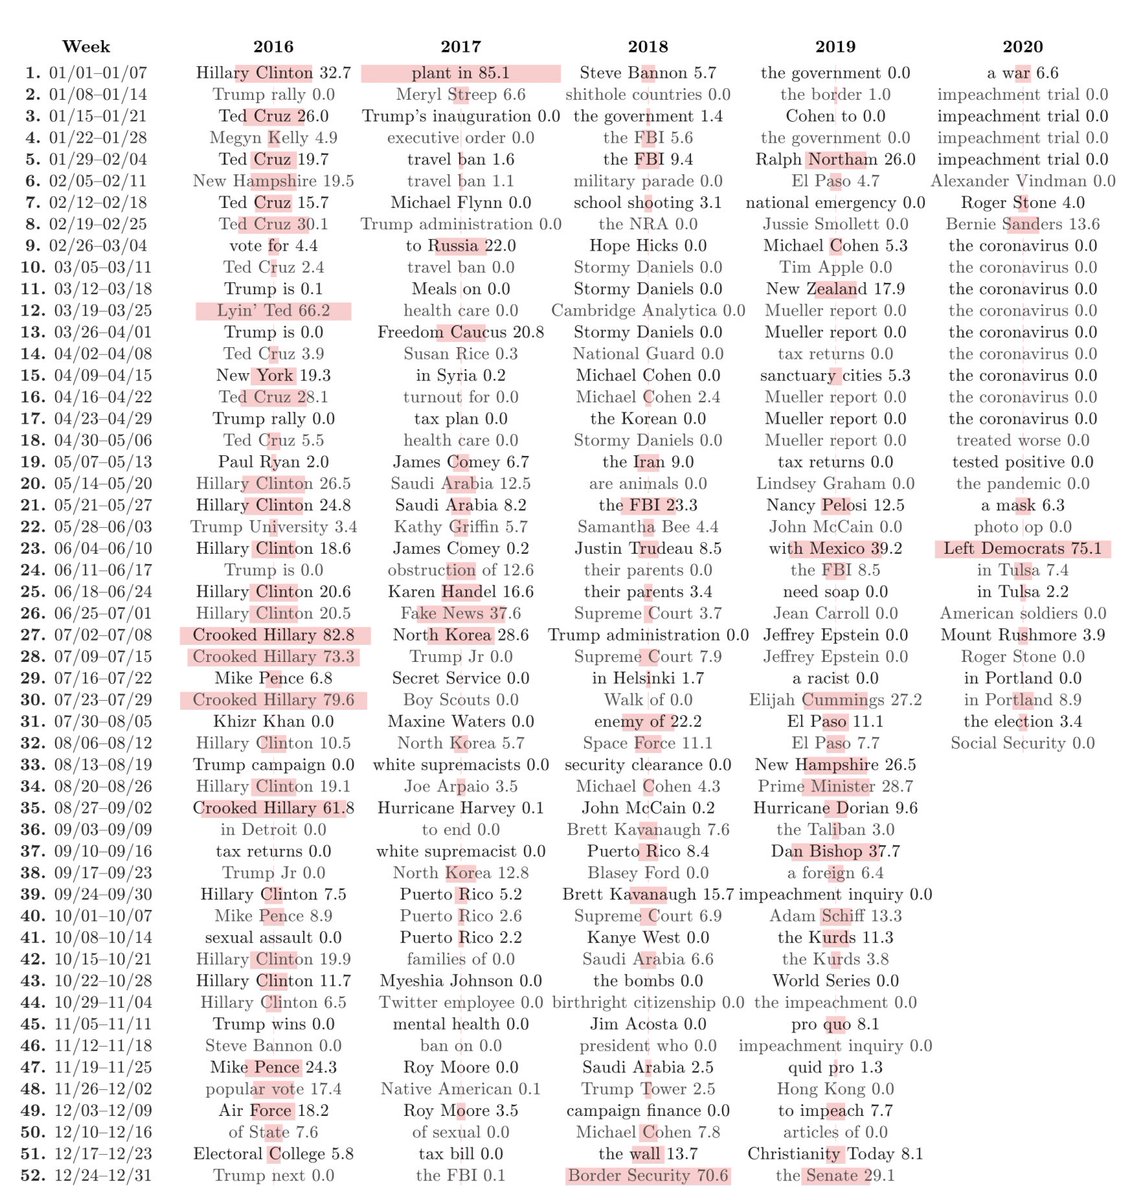
The top 2-grams variously agree, support, or point to different stories:
The top 2-grams variously agree, support, or point to different stories:
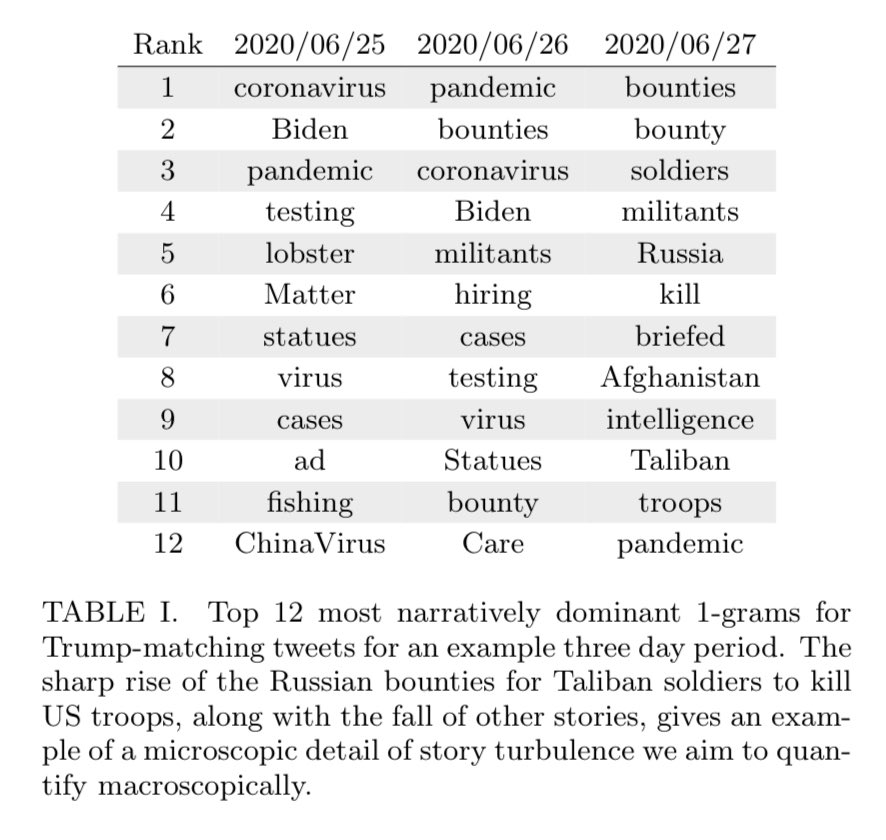
To give a sense of the detail for each day, here are the top 12 words for the three days in which the “Russian bounties to kill US troops” story emerged, taking over briefly from the pandemic narrative:
Narrative control:
The pale pink bars and the numbers next to each n-gram indicate what percentage of an n-gram’s usage is due to retweets of Trump during that week.
- “Crooked Hillary” is largely due to Trump.
- “coronavirus” is rarely explicitly tweeted by Trump.
The pale pink bars and the numbers next to each n-gram indicate what percentage of an n-gram’s usage is due to retweets of Trump during that week.
- “Crooked Hillary” is largely due to Trump.
- “coronavirus” is rarely explicitly tweeted by Trump.
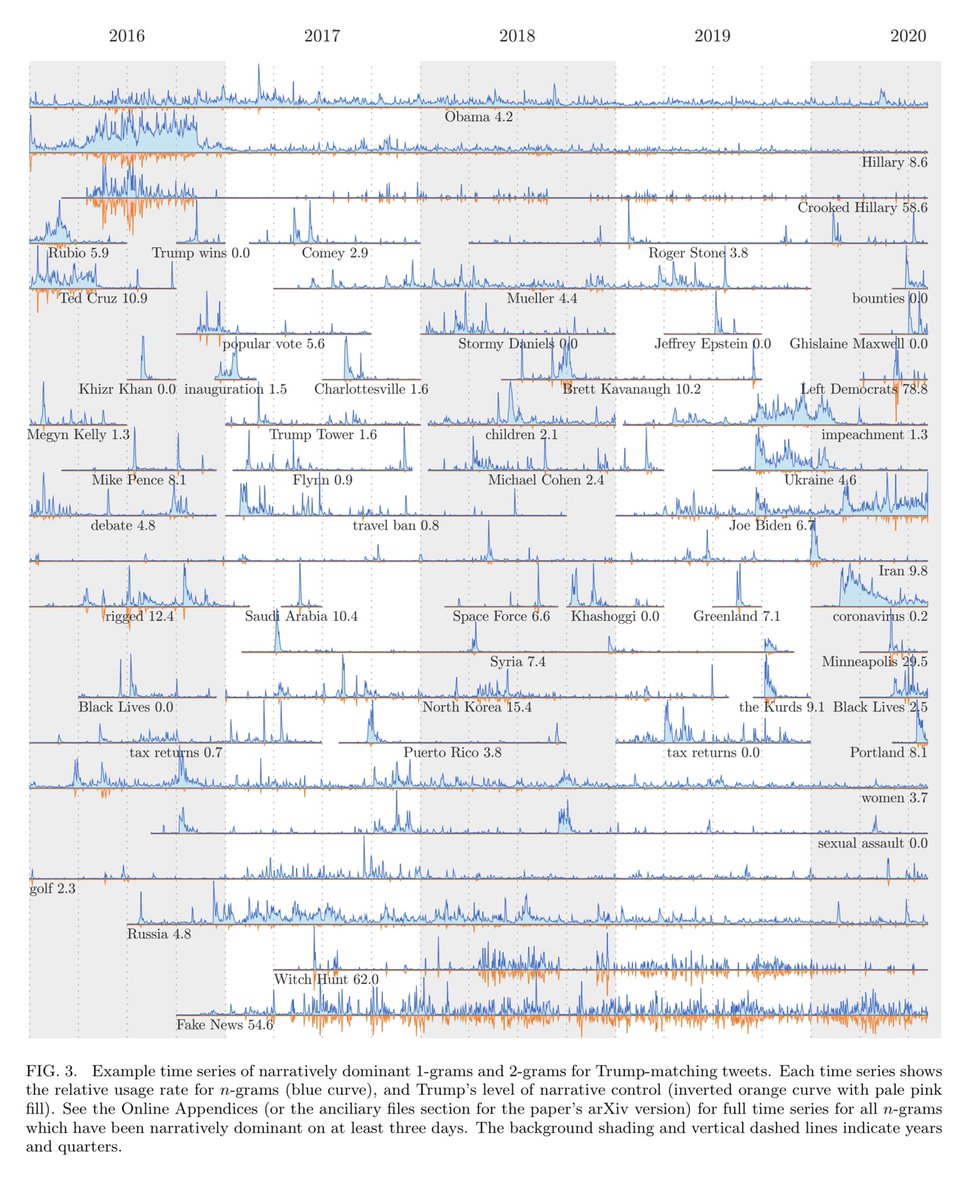
We then find the time series for the most narratively dominant words in stories around Trump.
Blue time series show the n-gram’s usage rate.
The orange time series underneath show what fraction is due to Trump.
Here’s a selection:
Blue time series show the n-gram’s usage rate.
The orange time series underneath show what fraction is due to Trump.
Here’s a selection:
The proof is in the pudding and our computational timelines achieve several goals:
- They give us a summary of history which we hope will be useful to journalists, historians, and anyone trying to make sense of things.
- They give us confidence to go on to deeper analyses.
- They give us a summary of history which we hope will be useful to journalists, historians, and anyone trying to make sense of things.
- They give us confidence to go on to deeper analyses.
We want to measure chronopathy: How the passing of time feels.
Here’s a summary of story turbulence around Trump.
For each month, we show how fast the story turnover is when looking back over different time scales.
Lighter is faster, darker is slower.
Here’s a summary of story turbulence around Trump.
For each month, we show how fast the story turnover is when looking back over different time scales.
Lighter is faster, darker is slower.
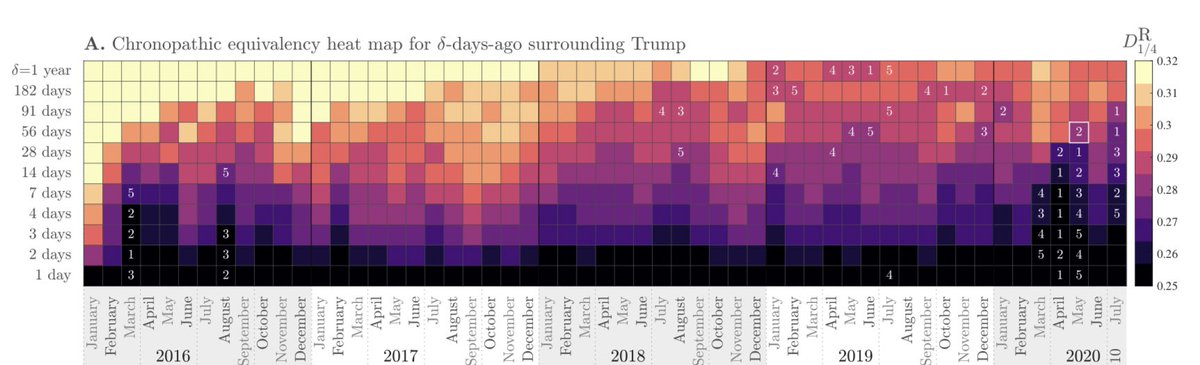
Over time, the “plot has thickened” around Trump.
2017 had the most story turbulence at all time scales, and September 2017 was the most disconnected from what had happened before.
Comey, Mueller, North Korea, Charlottesville, confederate statues, major hurricanes, ...
2017 had the most story turbulence at all time scales, and September 2017 was the most disconnected from what had happened before.
Comey, Mueller, North Korea, Charlottesville, confederate statues, major hurricanes, ...
2019 was the slowest at longer time scales, meaning when comparing a day to 6 months or a year ago.
And then COVID-19 slowed everything down.
The slowest days, weeks, and months all happened in April and May of 2020.
And then COVID-19 slowed everything down.
The slowest days, weeks, and months all happened in April and May of 2020.
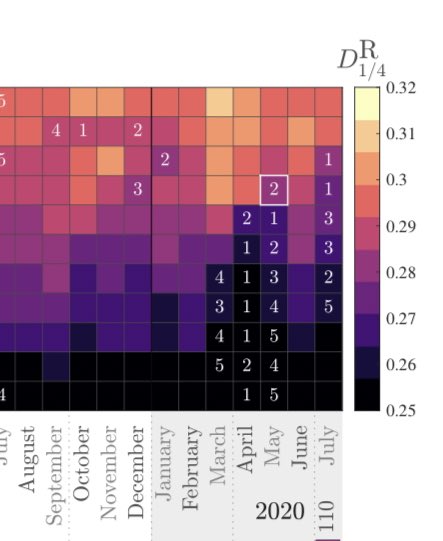
In June, the the murder of George Floyd broke through story-wise.
Trump regained narrative control in June (‘Minneapolis’, ‘Portland’).
But coronavirus came back, and July seemed more like April than any other three month gap had ever done.
Trump regained narrative control in June (‘Minneapolis’, ‘Portland’).
But coronavirus came back, and July seemed more like April than any other three month gap had ever done.
We can put numbers on the speed up/slow down.
By our measure, the change in story in May 2020 looking back 8 weeks (56 days) ago was the same as the change in story looking back just 2.9 days in September 2017.
Example equivalent times and speed up factors for all months:
By our measure, the change in story in May 2020 looking back 8 weeks (56 days) ago was the same as the change in story looking back just 2.9 days in September 2017.
Example equivalent times and speed up factors for all months:
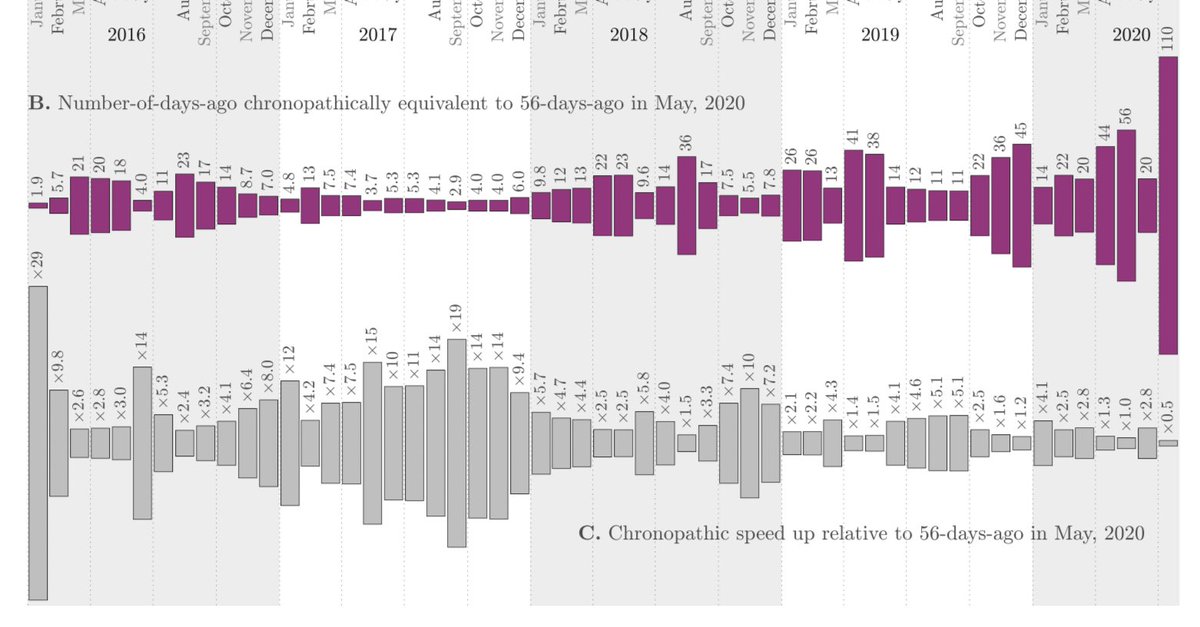
Chronopathy depends on how far you look back.
Memory is nonlinear: In July, stories around Trump seemed more like those in April than June.
Groundhog Day but with a pandemic.
Memory is nonlinear: In July, stories around Trump seemed more like those in April than June.
Groundhog Day but with a pandemic.
That’s enough for this thread.
Everything is discussed in our paper which, again, is here:
arxiv.org/pdf/2008.07301…
We have an initial site for the paper where you can download some of the data we’ve generated (we plan to add more):
compstorylab.org/trumpstoryturb…
Everything is discussed in our paper which, again, is here:
arxiv.org/pdf/2008.07301…
We have an initial site for the paper where you can download some of the data we’ve generated (we plan to add more):
compstorylab.org/trumpstoryturb…


