As we read #EEG studies, we look for specific brainwave patterns and rarely stop to think about the molecular/cellular events that are taking place to yield each component of the recording. This thread is a reminder of that! #MedEd #twEEGtorial #tweetorial #Neurology
1/
1/
My favorite example is the focal epileptiform discharge. We’re very good at detecting focal spike/sharp waves on routine surface EEG studies. So good that we can train machines to teach themselves to recognize them fairly accurately! E.g. jamanetwork.com/journals/jaman…
2/
2/
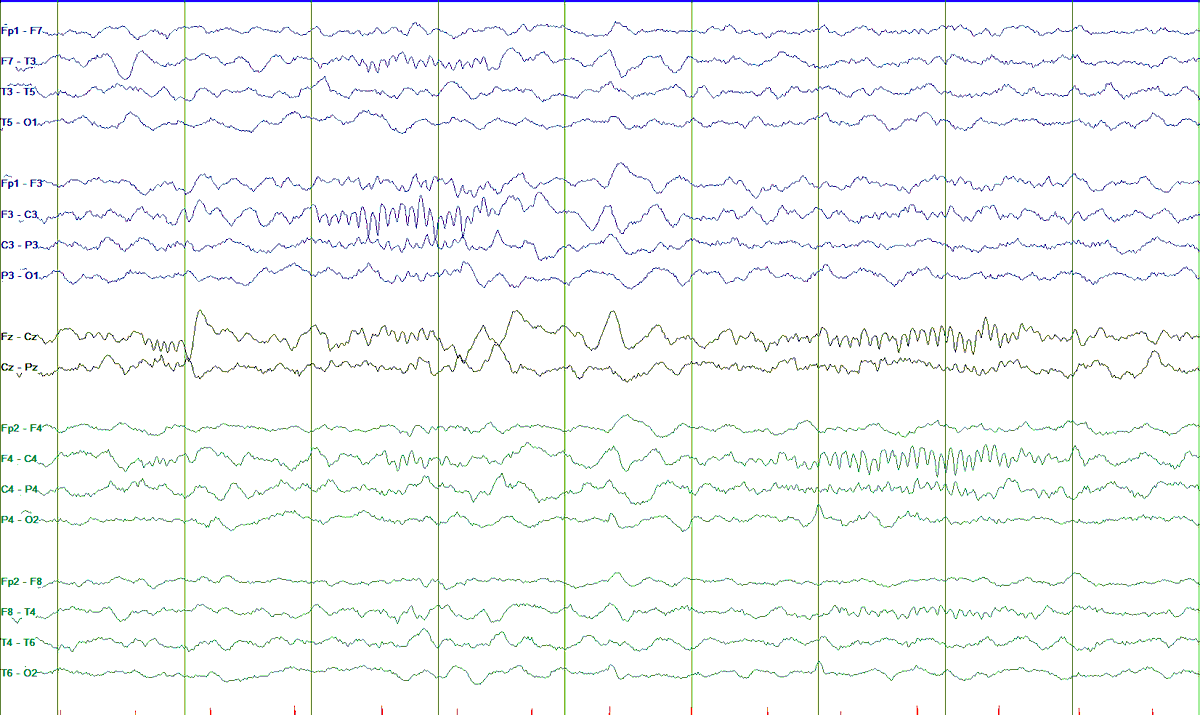
But what is a spike/sharp wave saying about underlying brain events? Let me take you from scalp to cell, step by step. Here’s a surface recording in longitudinal bipolar with LFF = 1 Hz, HFF = 70 Hz, S = 7 uV/mm, t = 30 mm/sec.
3/
3/

As you can see from an average montage of the same EEG page, this is an epileptiform discharge with maximal amplitude in F8 (where you see it phase reversing on double banana montage) and a field mostly over Fp2 and T4.
4/
4/

How much cortex is needed for scalp electrodes to “see” activity is contentious, with classic descriptions going from 6 cm2 to record a field (from Cooper’s seminal work in the 60’s sciencedirect.com/science/articl…
) to at least 10 cm2 to record a spike (e.g. onlinelibrary.wiley.com/doi/pdf/10.111…
)
5/
) to at least 10 cm2 to record a spike (e.g. onlinelibrary.wiley.com/doi/pdf/10.111…
)
5/
So what part of the brain is generating our F8-maximal sharp wave? Let’s take a look at the intracranial recording during this exact time. LFF = 1 Hz, HFF = 70 Hz, S = 150 uV/mm, t = 30 mm/sec.
6/
6/

You can see that scalp F8 (aka “right anterior temporal) sharp waves are indeed being generated most prominently by the deepest (1-3) contacts of depth electrodes implanted in the right amygdala and anterior hippocampus…
7/
7/
Here, we have to remember that depth electrodes don’t record activity at the cellular level. We are much closer to the source (which is why I changed the sensitivity from 7 to 150 uV/mm when going from scalp to depth), but we are not recording single-cell activity.
8/
8/
However, intracranial recordings do give us a proxy of the molecular signature of epileptiform discharges. Look what happens when we change up the low frequency filter from 1 to 50 Hz and the high frequency filter from 70 to, say, 500 Hz
9/
9/

Now let me make it more dramatic and expand the time base from 30 to 60 mm/sec. Voilà! These are high frequency oscillations (HFOs)! Activity that is much faster than we usually see on scalp, ranging from 80 to 250 Hz (ripples) and even 250 to 500 Hz (fast ripples).
10/
10/

What HFOs are, what they mean for localization of seizure-onset zone, and their implications for outcomes is a huge area of research (and debate!). Important: they reflect activities of GROUPS of neurons, not of an individual neuron (we need single-cell recordings for that)
11/
11/
But identifying HFOs reminds us of what is happening at the microscopic level in those neurons: paroxysmal depolarizing shift (PDS). You will hear this over and over: PDS is the molecular/cellular signature of epileptiform activity!
12/
12/
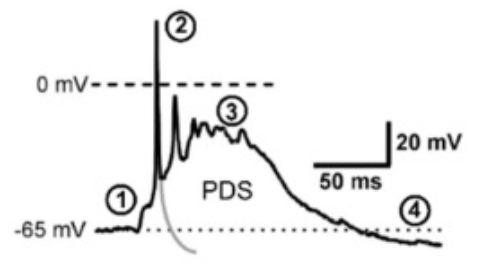
Under normal conditions, after an excitatory neuron fires, it becomes more resistant to firing for a period of time through a number of mechanisms. Do you remember this “hyperpolarization” phase of the action potential (red arrow)?
13/
13/

In epileptogenic neurons, changes in the function, density, and opening dynamics of ion channels decreases their resistance to fire during what would be hyperpolarization. Many authors believe that the co-grouping of such aberrant neurons gives rise to the seizure focus!
14/
14/
This figure shows what should have been the normal morphology of a normal action potential (the tail in grey color) vs. one with PDS showing all those depolarizations in succession (between # 2 and 3) Retrieved from this review paper: ncbi.nlm.nih.gov/pmc/articles/P…
15/
15/
The bursting activity in PDS results in prolonged depolarization of the membrane (since each one of those brings more Ca2+ into the cell), which opens more volt-dependent Na+ channels (hence bringing more Na+ inside), which in turns yields more action potentials.
16/
16/
There’s still quite a bit of debate about this, but I summarize it in my head as follows (way oversimplified but helps me relate scalp to cell activity):
➡️ Microscopic: PDS
➡️ Mesoscopic: HFOs (crank up your filters to see them!)
➡️ Macroscopic: Epileptiform discharge
17/
➡️ Microscopic: PDS
➡️ Mesoscopic: HFOs (crank up your filters to see them!)
➡️ Macroscopic: Epileptiform discharge
17/
This has a lot of implications, many of which are currently being investigated. It’s an exciting time to be a neurologist! Next time you see an epileptiform discharge on EEG, think about what that means for the underlying abnormalities even at the level of ion movements!
18/18
18/18
Please experts / basic neuroscientists (lot's of oscillator experts out there!), feel free to expand, correct, add anything you might think is valuable for clinicians / clinical researchers 🤓