
1/10 This incorrect reading (summarized in the story below) of what’s going on in the TIPS market is pervasive these days.
Here is a refresher of how to interpret signals from the TIPS market (thread).
@LizMcCormickWV @ctorresreporter @jbensondurham
bloomberg.com/news/articles/…
Here is a refresher of how to interpret signals from the TIPS market (thread).
@LizMcCormickWV @ctorresreporter @jbensondurham
bloomberg.com/news/articles/…
2/10 The TIPS rate can be expressed as follows:
TIPS Rate =
Expected Average Real Fed Funds Rate +
Real Term Premium +
Liquidity Premium
The liquidity premium reflects normally lower liquidity in the TIPS vs nominal market (investors demand a premium to hold TIPS).
TIPS Rate =
Expected Average Real Fed Funds Rate +
Real Term Premium +
Liquidity Premium
The liquidity premium reflects normally lower liquidity in the TIPS vs nominal market (investors demand a premium to hold TIPS).
3/10 The breakeven rate can always be expressed as:
Breakeven Rate =
Expected Inflation +
Inflation Risk Premium -
Liquidity Premium
So, the liquidity *adds to* observed TIPS rates and *subtracts from* breakeven rates (that's b/c breakeven=nominal rate - TIPS rate).
Breakeven Rate =
Expected Inflation +
Inflation Risk Premium -
Liquidity Premium
So, the liquidity *adds to* observed TIPS rates and *subtracts from* breakeven rates (that's b/c breakeven=nominal rate - TIPS rate).
4/10 There ways to disentangle the various components from observed TIPS and breakeven rates: See federalreserve.gov/econres/notes/….
Note that these methods are created and maintained at the #Fed itself, so the #Fed is aware of what’s really going on.
Note that these methods are created and maintained at the #Fed itself, so the #Fed is aware of what’s really going on.
5/10 So, what is really going on? The chart below shows the TIPS rate decomposition. As it’s easy to see, the average expected real FFR (a proxy for growth) dropped in the spring as #covid_19 hit and never recovered. Since then, all movements in TIPS rate are liquidity premiums. 

6/10 Similarly, expected inflation dropped in the spring and never recovered. Breakevens are higher not because expected inflation is up but because liquidity in the TIPS market has been getting better and better (presumably as everyone is piling into an already crowded trade).
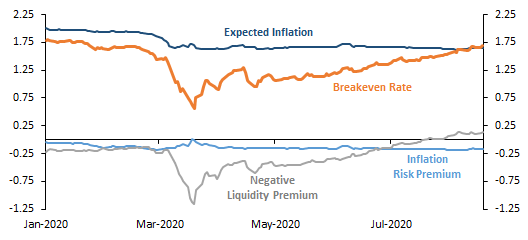
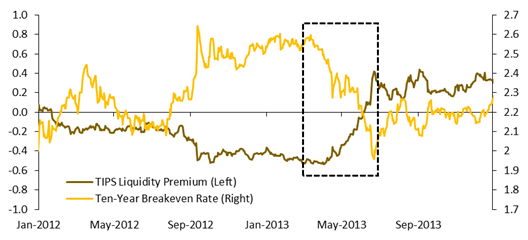
7/10 We need to understand that being long breakeven rates today doesn’t mean necessarily being long inflation. More than anything it means being long TIPS liquidity. The trade probably continues to work, but be careful because TIPS liquidity can be fickle (eg. see 2013 below).
8/10 Finally, many people point to the apparent oddity of steady nominal rates vs falling TIPS rates/raising breakevens.
No surprise there: That's what should happen when all movements are induced by TIPS liquidity. Simple arithmetic shows what's going on.
No surprise there: That's what should happen when all movements are induced by TIPS liquidity. Simple arithmetic shows what's going on.
9/10 Note that:
Nominal Rate = TIPS Rate + Breakeven.
Or, according to 2 and 3 above:
Nominal Rate =
Expected Avg. Real Fed Funds Rate +
Expected Inflation +
Real Term Premium +
Inflation Risk Premium
The liquidity premium cancels out and nominal yields move little.
Nominal Rate = TIPS Rate + Breakeven.
Or, according to 2 and 3 above:
Nominal Rate =
Expected Avg. Real Fed Funds Rate +
Expected Inflation +
Real Term Premium +
Inflation Risk Premium
The liquidity premium cancels out and nominal yields move little.
10/10 To summarize:
* Breakevens/TIPS rates are moving mostly because of liquidity, not inflation expectations.
* The macro signals (lower inflation AND growth expectations) happened quickly in the spring and are not being reversed.
* No surprise that nominal rates stay low.
* Breakevens/TIPS rates are moving mostly because of liquidity, not inflation expectations.
* The macro signals (lower inflation AND growth expectations) happened quickly in the spring and are not being reversed.
* No surprise that nominal rates stay low.

