1/ Covid (@UCSF) Chronicles, Day 157
We’re only 6 months into Covid in the U.S., a little early for déjà vu, but I’m definitely experiencing it – the calm-before-the-storm feeling I had in May, as the numbers fell in the Northeast and we thought that we were over the worst.
We’re only 6 months into Covid in the U.S., a little early for déjà vu, but I’m definitely experiencing it – the calm-before-the-storm feeling I had in May, as the numbers fell in the Northeast and we thought that we were over the worst.
2/ Today, after SF updates, I’ll lay out my thinking about what the next few months may have in store, including the prospects of another surge. I’m worried that September will be mellow – just as May was – and we’ll let our guard down… only to be slammed again in October.
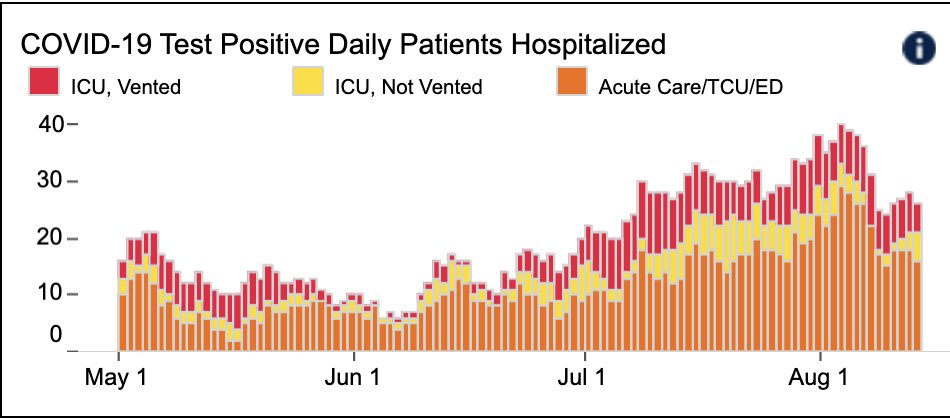
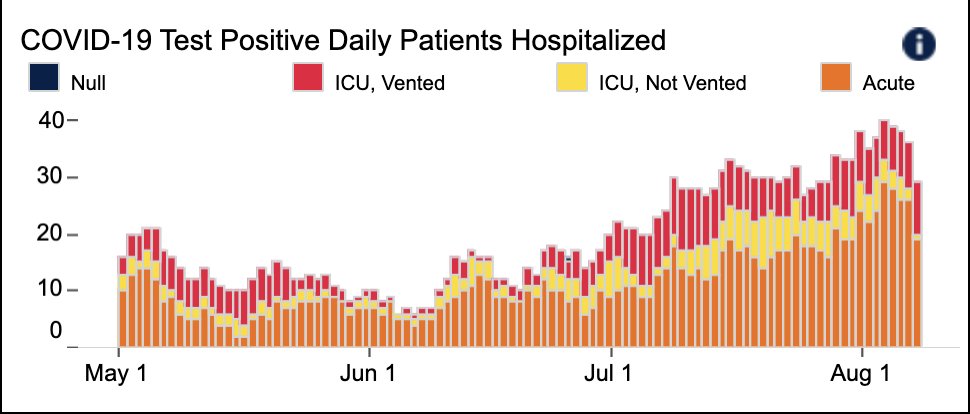
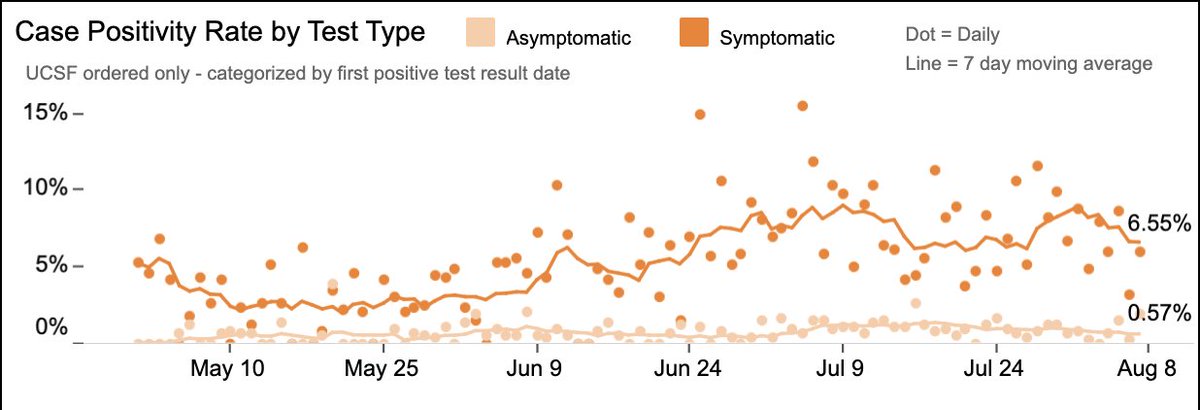
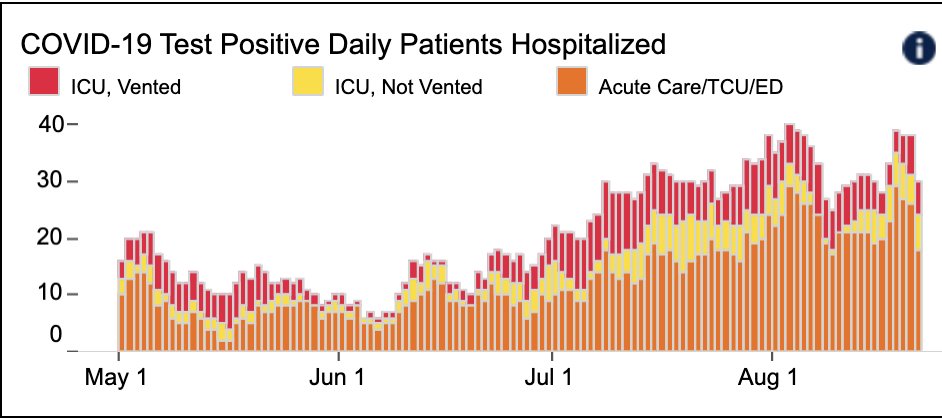
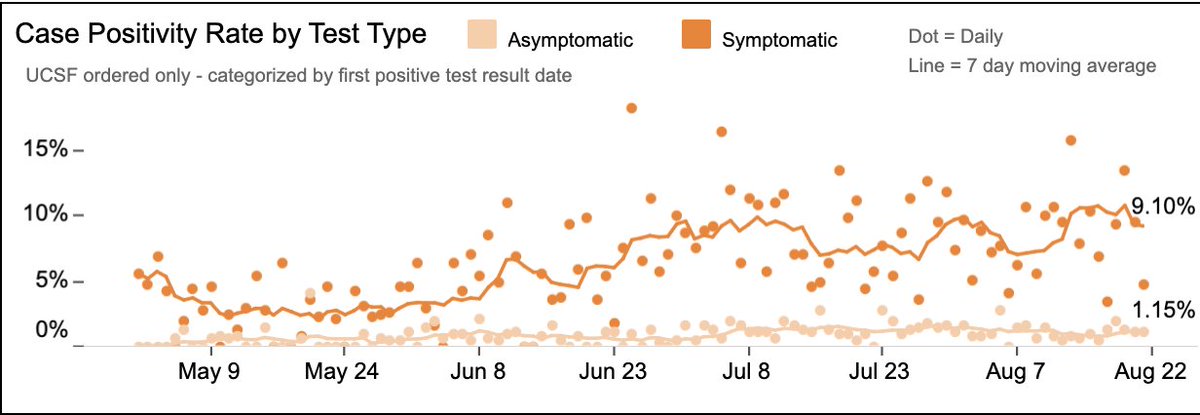
3/ @UCSFHospitals, 30 pts, 6 on vents (Fig L). Test positivity rate 2.6%; 9.1% in pts w/ symptoms; 1.15% in pts w/o (Fig R). All of these numbers are up a bit in the last month. We have plenty of capacity, but it would be good to come down from these too-high plateaus. 
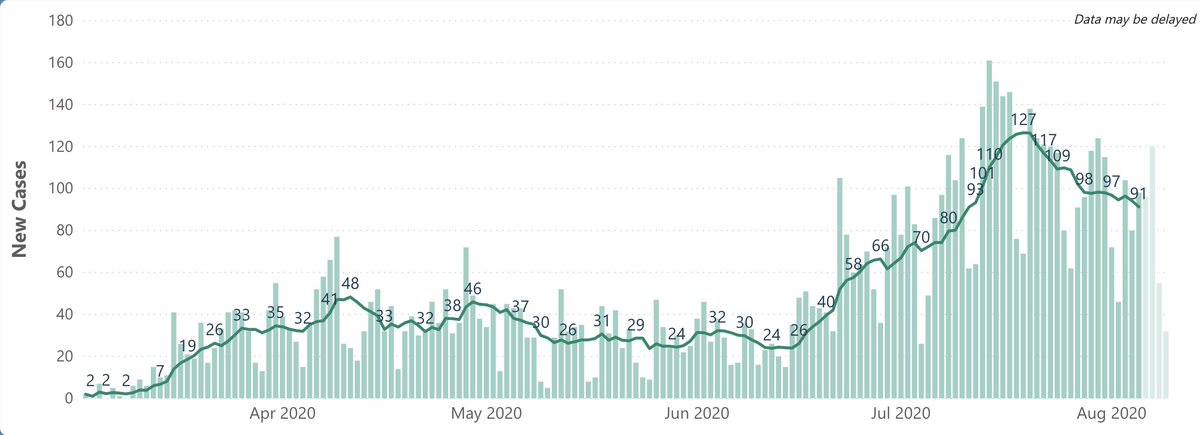
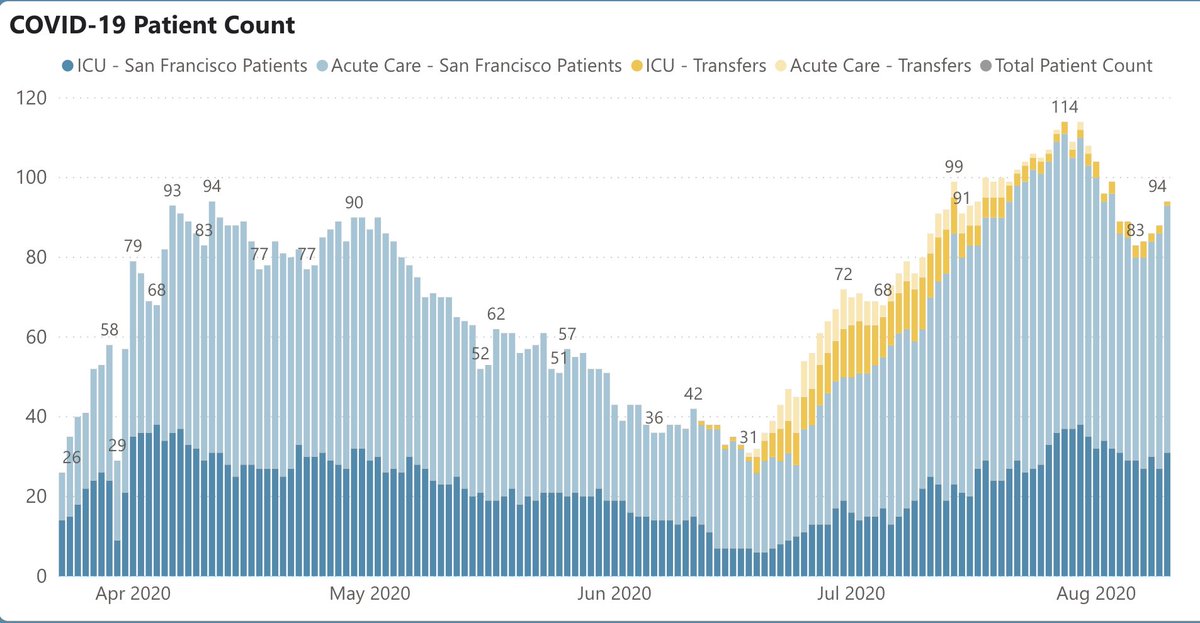
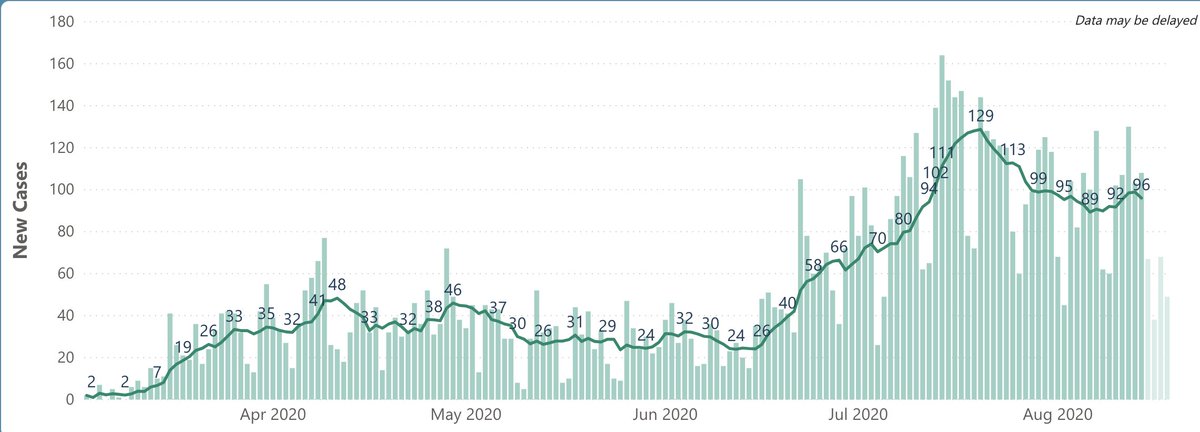
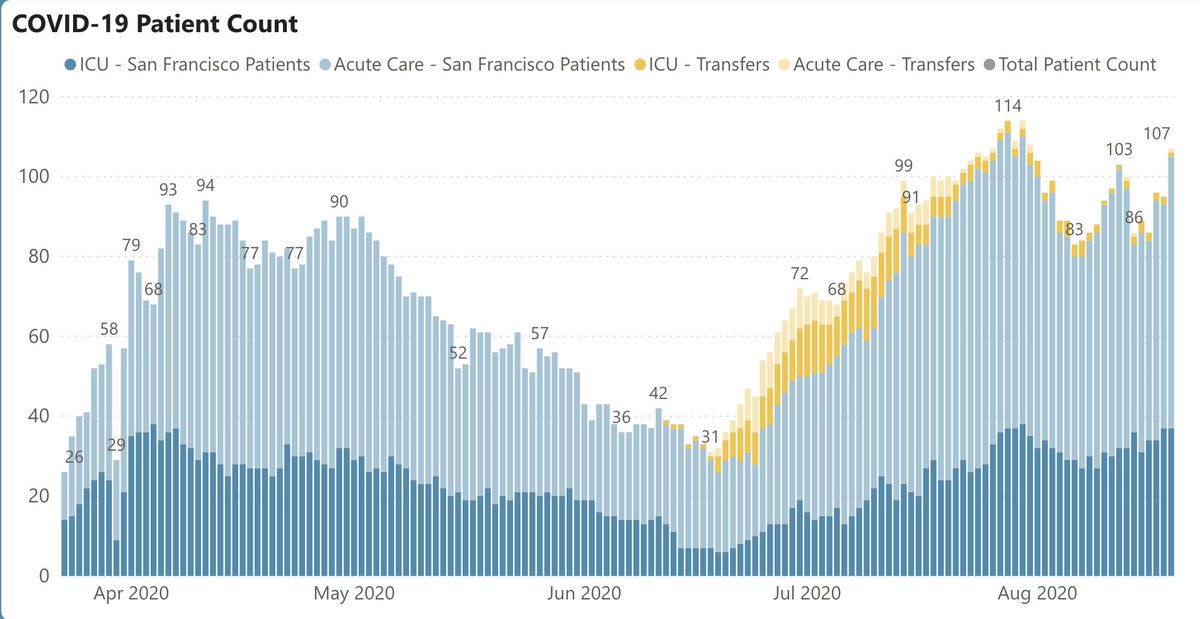
4/ Ditto for SF – running 96 cases/day, down from 129 last mth (Fig L). Hospitalizations also stubbornly high (Fig R); new bump to 107, but mostly ups/downs. 72 deaths in SF; avg 1 every 2 days. Each is a tragedy, but deaths per capita remain lower than any other big city in US.
5/ Plateaus at UCSF & in SF mirror CA’s numbers, a bit surprising given the shutdowns that Newsom ordered in July. Interesting that southern states ¬– which had much larger surges in June-July – have dropped more sharply; their per-capita case counts are now similar to CA’s.
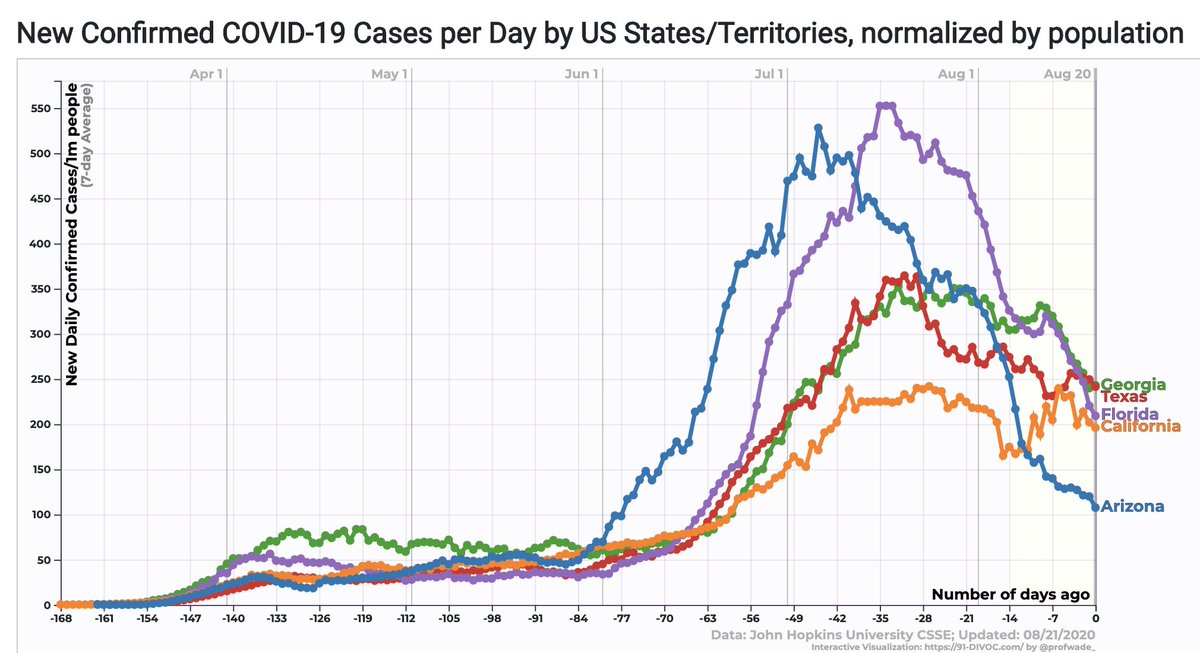
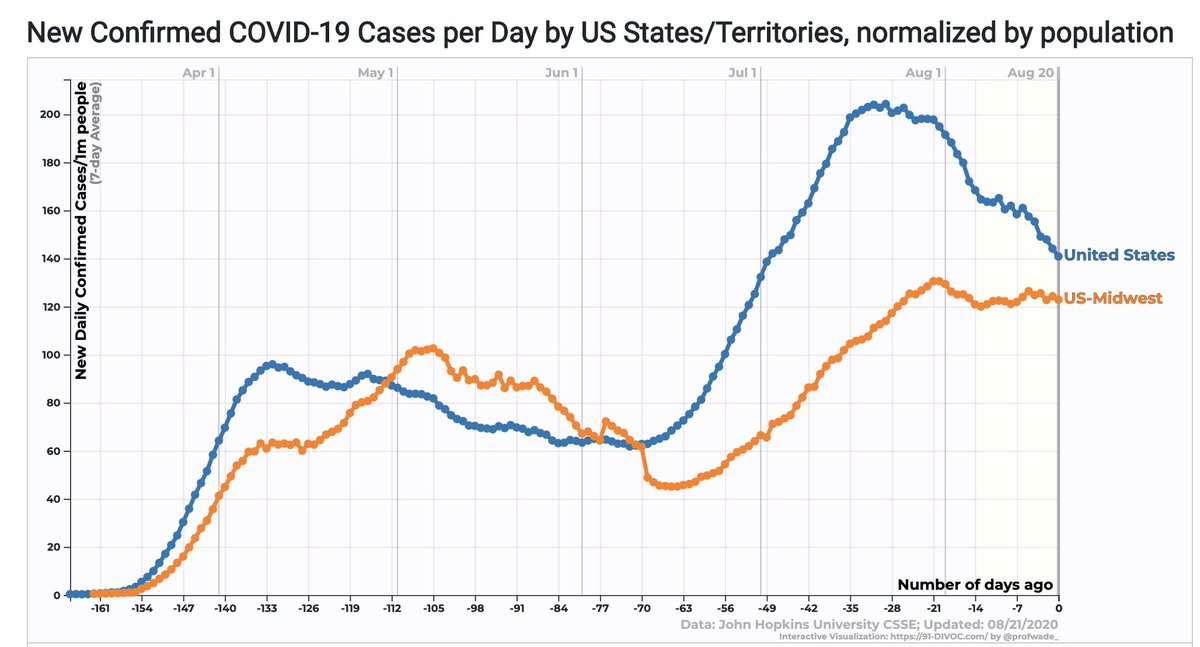
6/ Even with CA’s plateau, the overall trendlines for the U.S. are improving. And – while there are mild upticks here & there – no states have the kinds of spikes we saw in AZ, TX, FL, & GA (and CA) in June-July. One might think that we’re in for a period of relative calm…
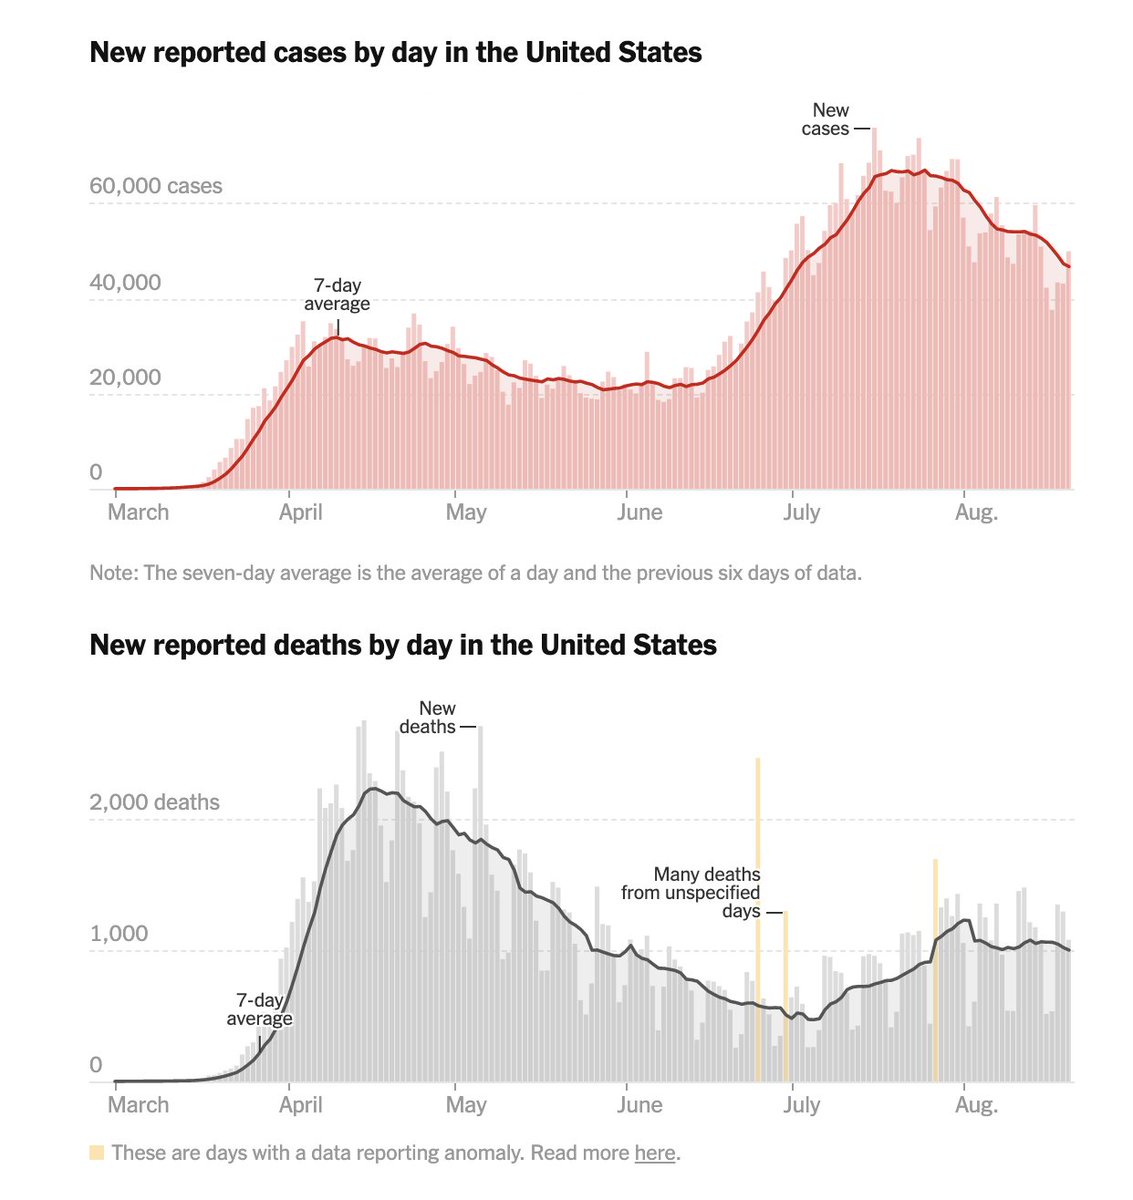
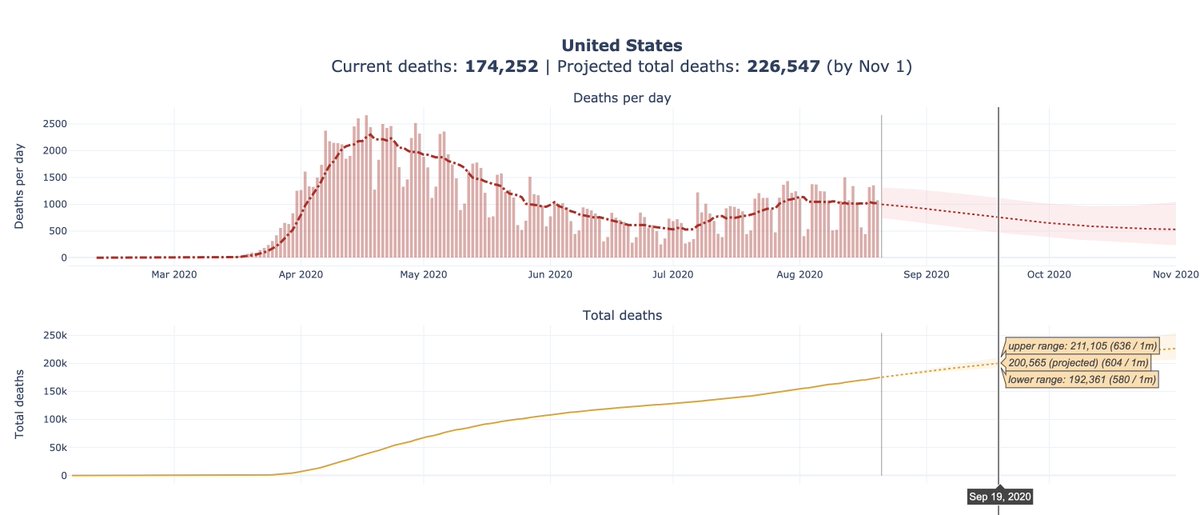
7/ …and maybe we are. But it’s a terrible calm, w/ ~45,000 cases/day in U.S. & >1000 deaths. Per Gu projections (below), we’re on track for 200K deaths by mid-Sept and 230K by Election Day. Note that populations of Boise, Richmond VA, & Baton Rouge are ~230K. We can't be inured.
8/ Nevertheless, lower IS better and I’m guessing September will be the fall’s May, when the surge in the Northeast had been tamed and the summer surges in the South and West had not yet begun. I’ve mapped out my view of the five stages of this pandemic roller coaster below.
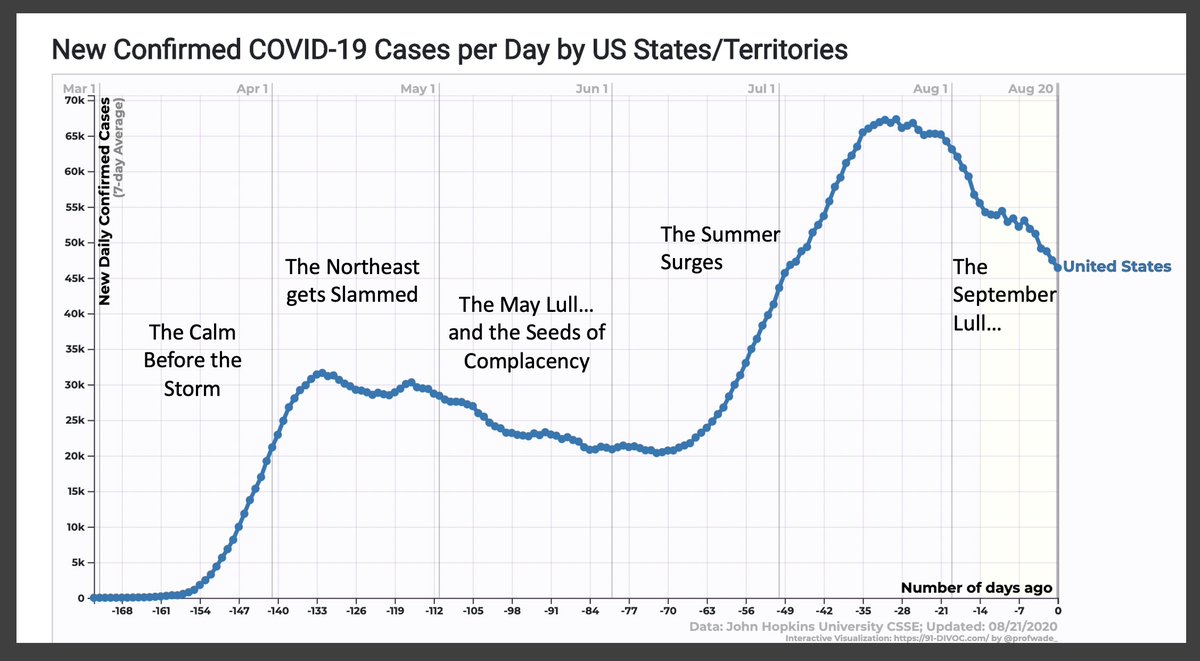
9/ One characteristic of U.S. pandemic is how regional our surges have been – mostly driven by the surge in the NE in the spring & in the South in the summer. If the South matches the Northeast’s peak/valley pattern, it could be quite “cool” (Covid-wise) by mid-September.
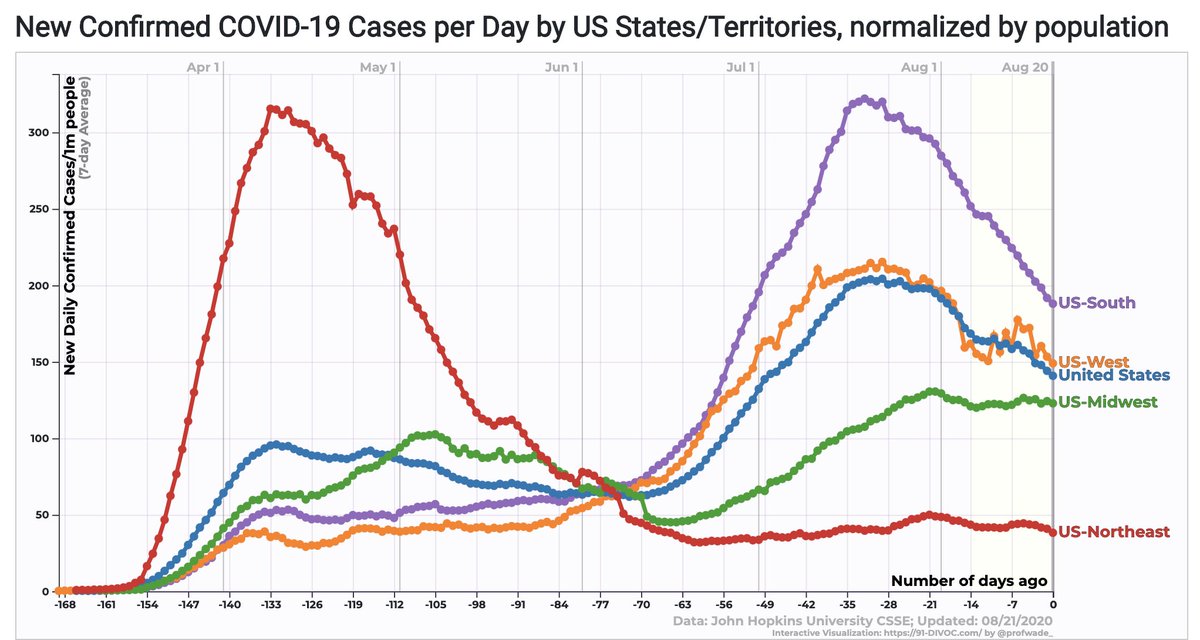
10/ As we’ve discussed before, we’re not totally sure how to explain the NE's plunging cases in May – specifically the relative contributions of policy & behavioral changes vs high proportions of the population having antibodies (“partial herd immunity”). Likely both are at play.
11/ The West never reached the staggering highs of AZ/FL, but its descent is also less steep. Perhaps a milder surge leads to less behavioral change (less fear of God) AND fewer people with antibodies. The combo results in a slower and flatter descent than in hammered regions.
12/ So where's the next surge likely to be? We’re now seeing steady growth in cases in the Midwest: cases/million/day rose from 50 two months ago to 120 now. While the region is plateauing, one wonders if that’s due to outdoor activities. If so, this’ll change fast come fall.
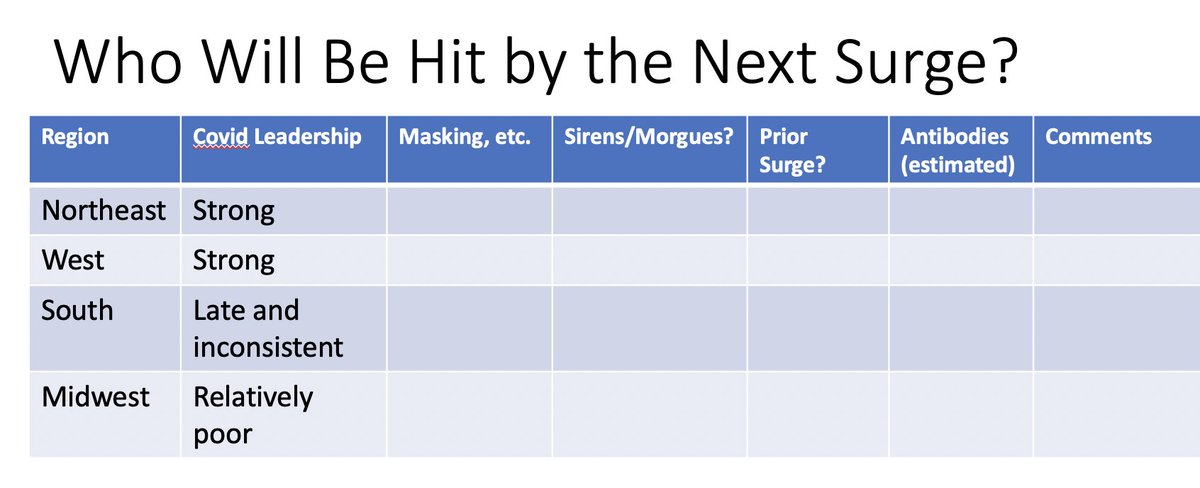
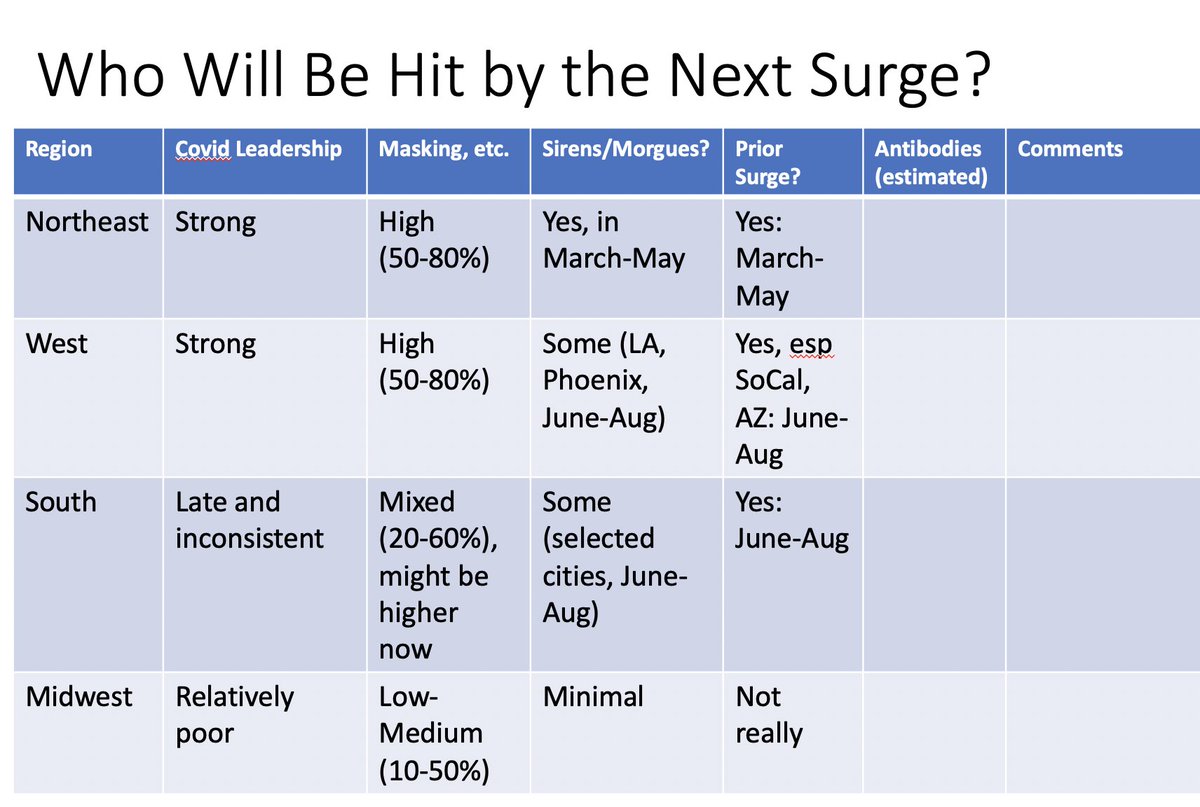
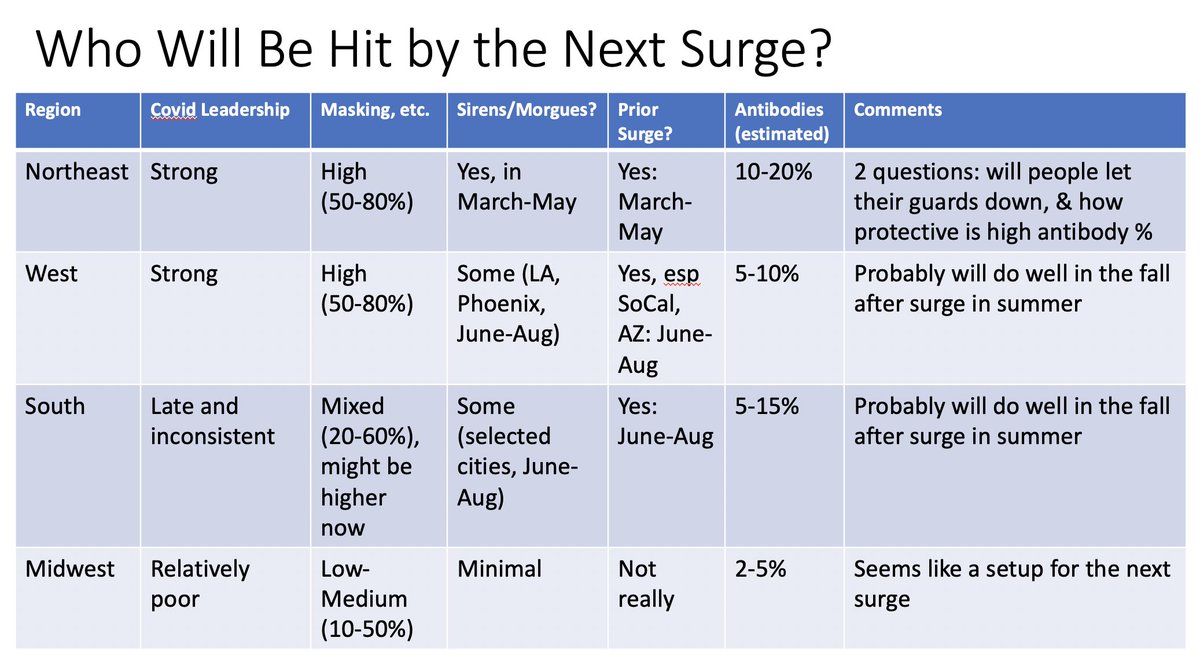
13/ Here's some (informed) speculation. Below, I’ve mapped out the categories that seem to explain & predict surges. The behavior of the virus is easier to predict than the behavior of both people & politicians, but if the patterns hold, the next surge may be in the Midwest.
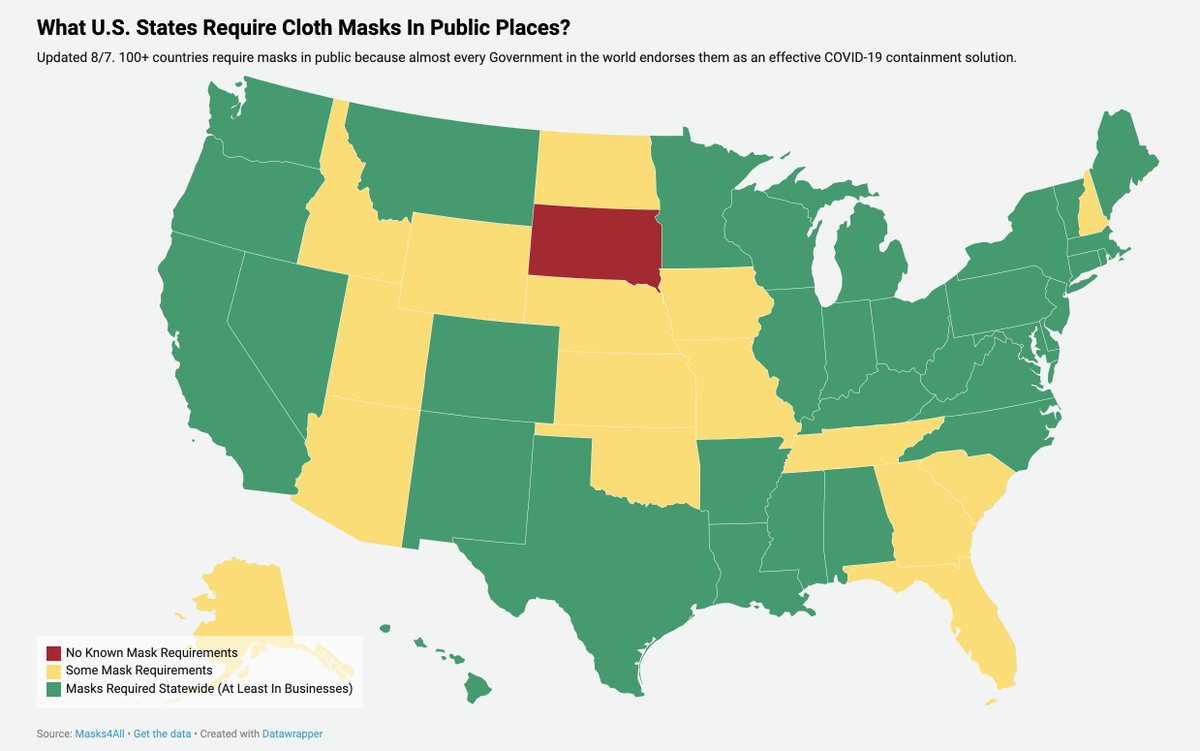
14/ Category 1: “Covid Leadership.” There are lots of ways to judge this, but I chose to use mask mandates. The map (from tinyurl.com/yyphur48) shows that mandates are nearly universal in the NE, the West and, belatedly, the South (but not the SE), but often absent in Midwest.
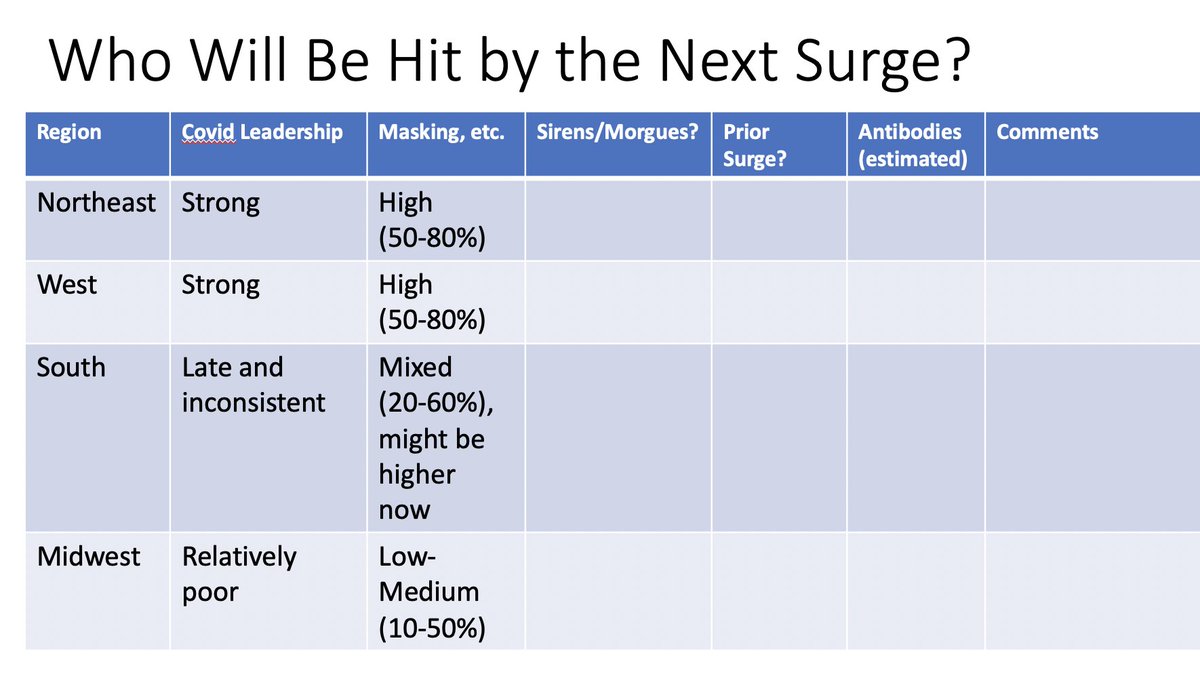
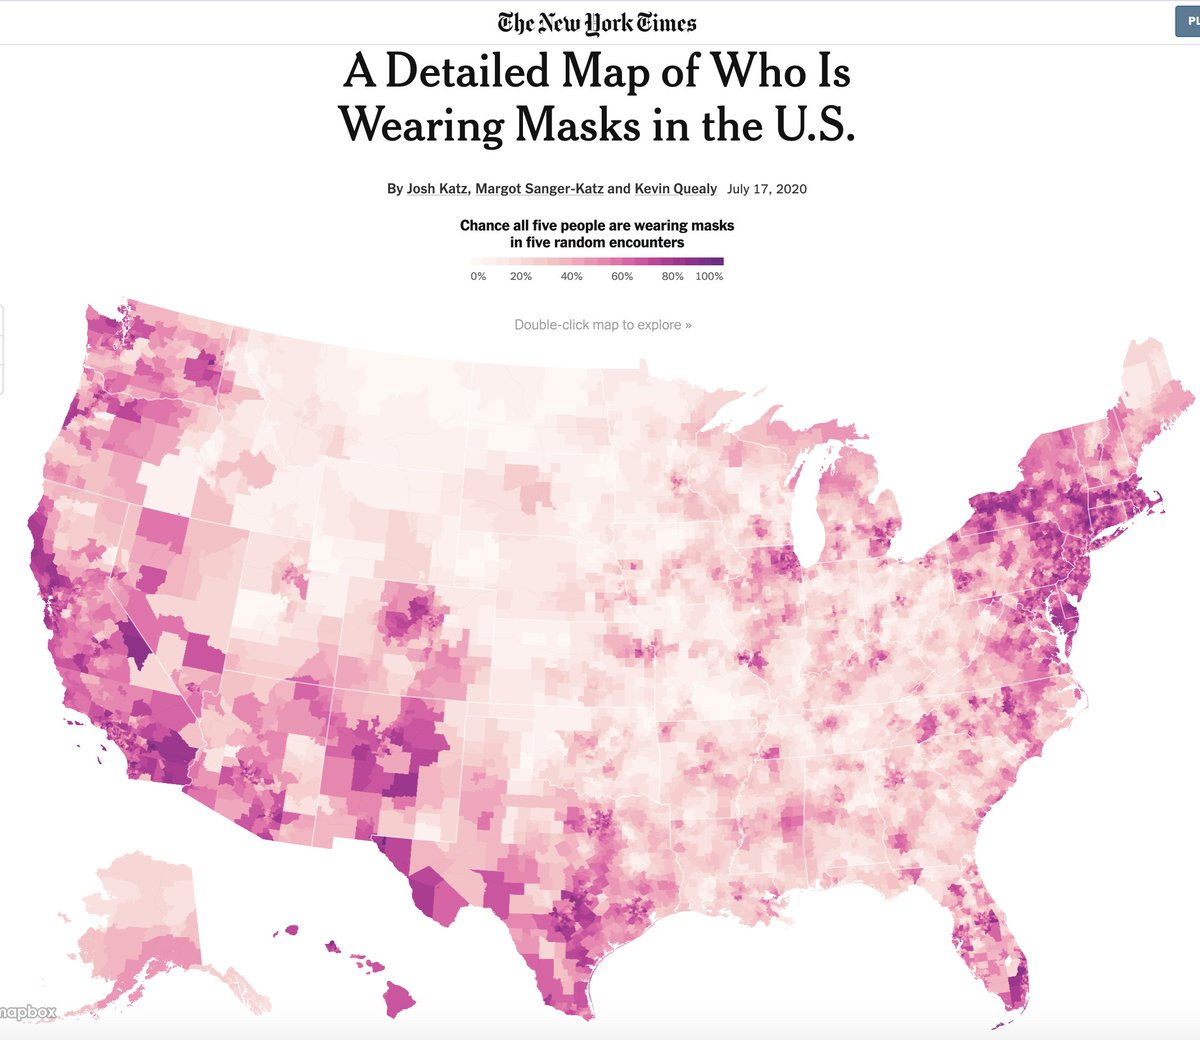
15/ Category 2: fraction of people that wear masks. The New York Times surveyed the U.S. in July tinyurl.com/yxfu375k & found huge regional variation. The numbers vary by county; the % represents my estimate (by region) of the chance that, in a group of 5, all will be masked.
16/ Next 2 categories: how directly an area was impacted by Covid. No area can match NYC – people who saw refrigerated morgue trucks & heard sirens wailing all night will never forget it. Summer surge has been more widely distributed, with fewer cities and hospitals overwhelmed.
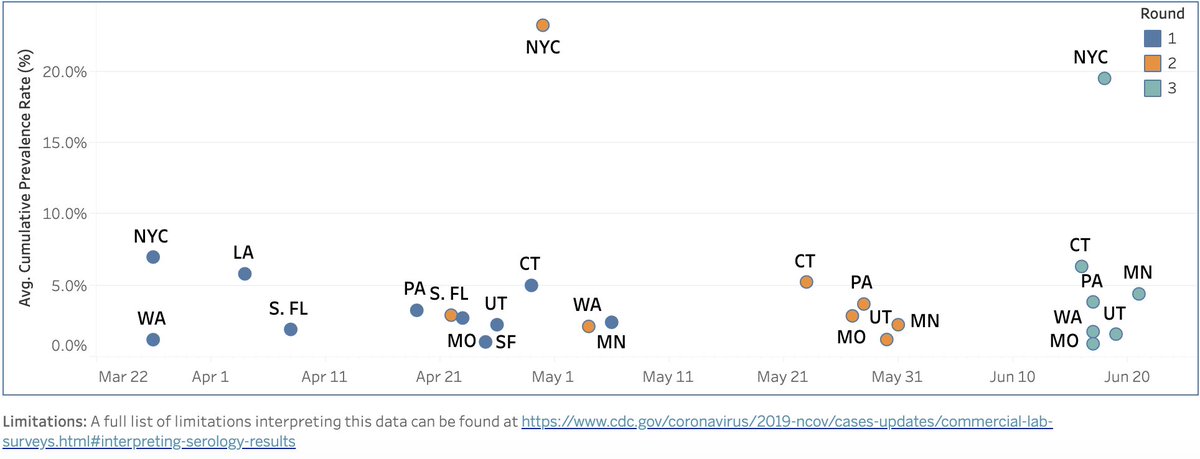
17/ Finally, antibodies. Tricky. CDC has listed tinyurl.com/y32dnu9w ~20 regional antibody studies (Fig R); is doesn't cover all regions, & the timing may be off. For example, S. FL data (1.9% w/ antibodies) from April; by late May it was up to 7.5%. It’s probably 15-20% now.
18/ Based on that analysis, I predict a relative lull for next month, as the weather remains OK for outdoor activities. But then combo of complacency, cold weather, and schools & businesses reopening will lead to a new surge, most likely in Midwest, probably starting late Sept.
19/ Another prediction (this one isn’t so hard): a Sept. lull will lead Trump to declare “Mission Accomplished” (yet again). Unfortunately, this will be proven wrong (yet again) as October rolls around. The exact timing of all of this, of course, is utterly unpredictable.
20/ How will next surge differ from prior ones? The case-fatality rate for this summer's surge was far lower than the rate in the spring. The reasons are well known tinyurl.com/yck5thrz; they include younger pts, more testing, fewer overwhelmed hospitals, & better treatments…
21/ Most of those factors seem unlikely to change, except the last one. There probably will be additional therapies – maybe interferon, or monoclonal antibodies, or convalescent plasma – demonstrated to be beneficial in the next few months. This could reduce mortality even more.
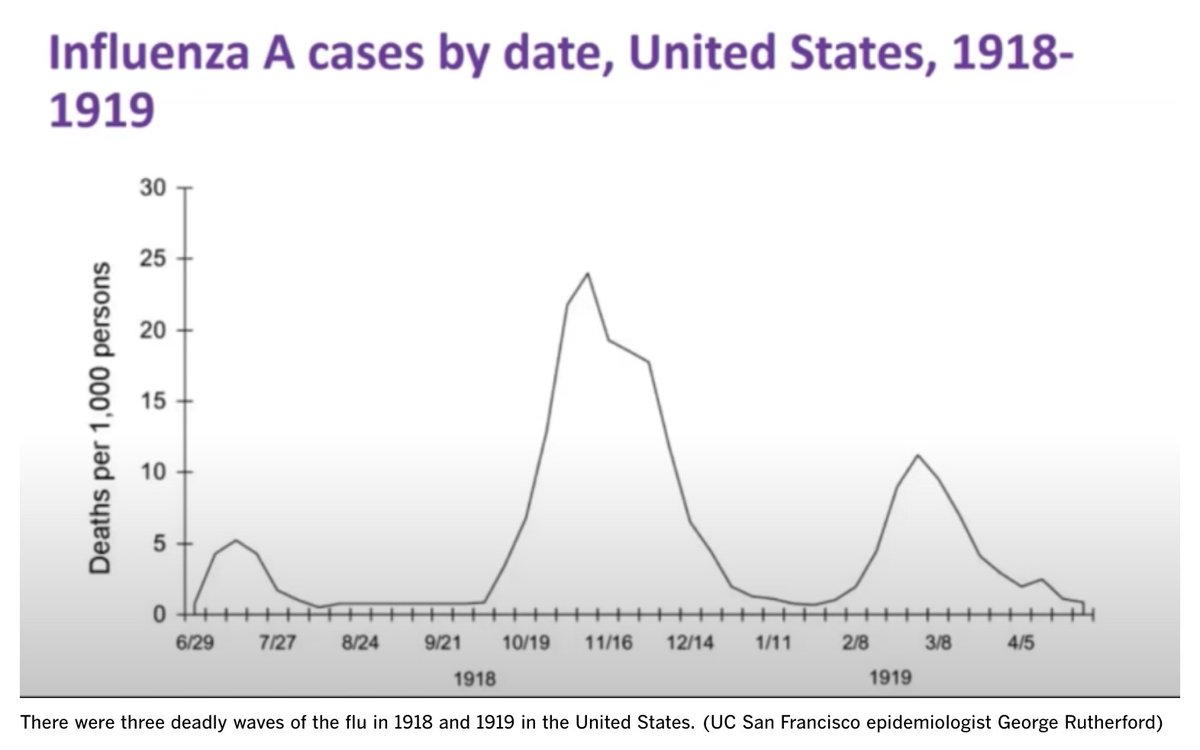
22/ Let’s all hope that our curve flattens and stays flat. Sadly, the precedent for three waves was well established by the 1918 flu pandemic. Since SARS-CoV-2's characteristics haven't changed materially, a third surge in the fall seems likely.
23/ Of course, its height & toll will be determined by how well everyone adheres to masking, distancing & the other recommendations, as well as by whether we’ve rolled out more & faster testing/tracing. Given that all of this depends on federal leadership, we can’t count on it.
24/ That’s it. I’m starting vacation, mostly in New Hampshire. Here’s Newman contemplating the view of our local lake. Back after Labor Day; we’ll restart grand rounds then. I’ll tweet at times but no long threads till I’m back.
Hope you get a little down time too. Stay safe.
Hope you get a little down time too. Stay safe.