my favorite strategy
$XLY & $WMT spread z-score
entry
z < -1 std => long 1/3 of total lots
long WMT & short h * XLV
z < -2 std => long 2/3 of total lots
profit
z > 0 std => out 1/3 lots
z > +1 std => out 1/3 lots
z > +2 std trailing 1/3 lots
stop
z < -3 std. out.
$XLY & $WMT spread z-score
entry
z < -1 std => long 1/3 of total lots
long WMT & short h * XLV
z < -2 std => long 2/3 of total lots
profit
z > 0 std => out 1/3 lots
z > +1 std => out 1/3 lots
z > +2 std trailing 1/3 lots
stop
z < -3 std. out.
XLY-WMT spread vs $VIX
when XLY-WMT z-score < -1 std (greed zone), #VIX spiking secured in 1-2 wks time-frame
should be confirmed by many of my other breadth & Jaws indicators
also huge warning, when VIX crushed, but the spread rising. stealthy sector rotation in Jan 2018
when XLY-WMT z-score < -1 std (greed zone), #VIX spiking secured in 1-2 wks time-frame
should be confirmed by many of my other breadth & Jaws indicators
also huge warning, when VIX crushed, but the spread rising. stealthy sector rotation in Jan 2018
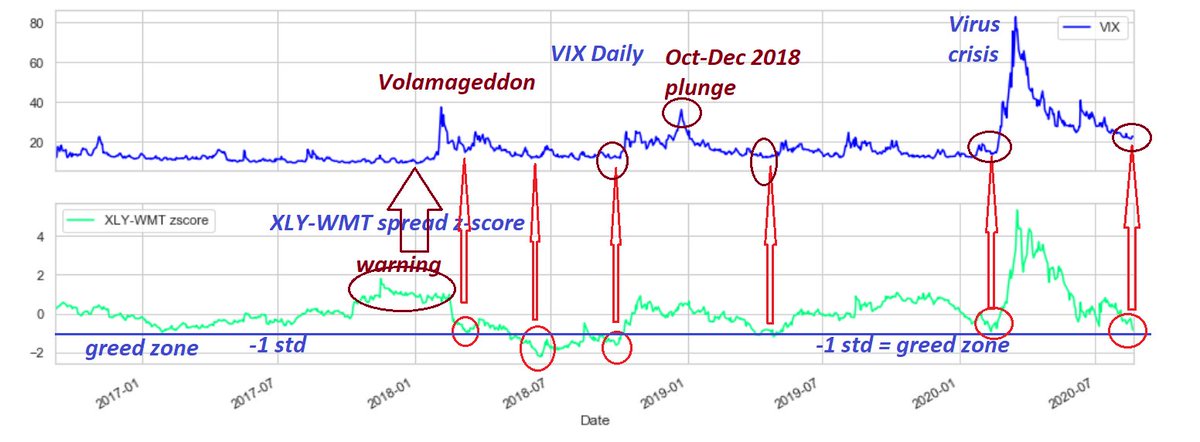
The 4+ year correlation b/w
1 XLY-WMT spread z-score
2 $VIX
3 > 0.7
tradeable corr & z-score
how about I scan tons of other similar growth/value sectors & stocks, charting their spread z-score & corr with VIX & Sector ETF? along with PCR
Hmm greatest breadth indicator ever?🧐
1 XLY-WMT spread z-score
2 $VIX
3 > 0.7
tradeable corr & z-score
how about I scan tons of other similar growth/value sectors & stocks, charting their spread z-score & corr with VIX & Sector ETF? along with PCR
Hmm greatest breadth indicator ever?🧐
Probability of $XLK (or $QQQ) outperforming $SPY by 3.2 sigma (std-dev) = 0.13%
In other words, the prob of XLK-SPY spread returning back to mean is 99.87%, if "Gravity"🦃acting like 2002🙃
last 4.6 yrs, the spread b/w SPY-XLK was
+1 std-dev & -1 std-dev except Jan 2018
crazy.
In other words, the prob of XLK-SPY spread returning back to mean is 99.87%, if "Gravity"🦃acting like 2002🙃
last 4.6 yrs, the spread b/w SPY-XLK was
+1 std-dev & -1 std-dev except Jan 2018
crazy.

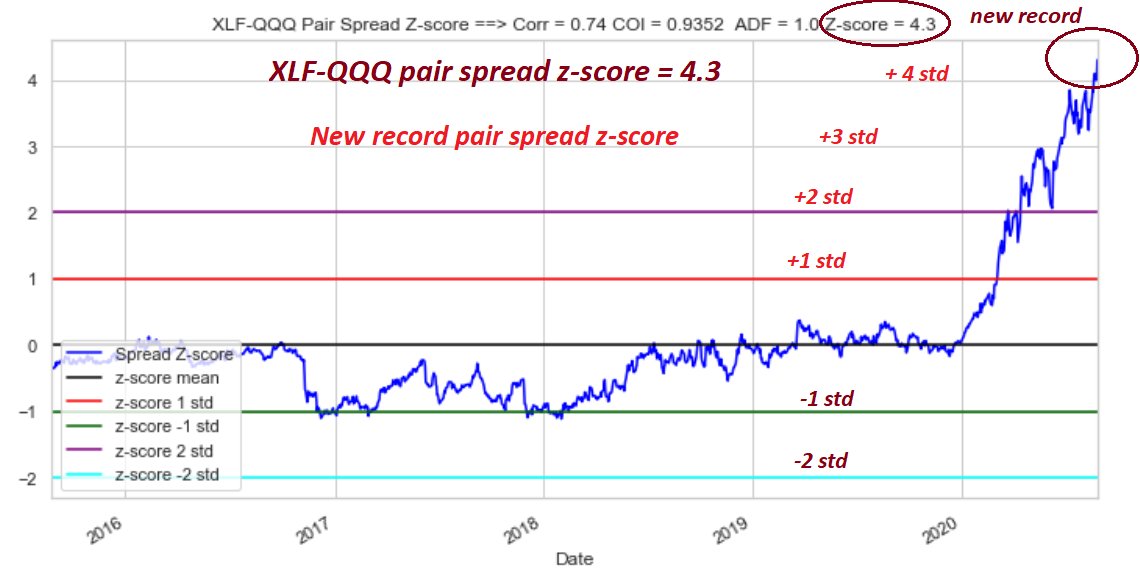
XLF-QQQ pair spread:
z-score = 4.3 sigma as of Aug 26 close.
a new record.
super bad market breadth across the board.
Worse than Mar 2000
what super bullish trend?
just pumping 5 mega-cap tech stocks.
A->B; B -> A Ponzi continues until 🦃🦃
z-score = 4.3 sigma as of Aug 26 close.
a new record.
super bad market breadth across the board.
Worse than Mar 2000
what super bullish trend?
just pumping 5 mega-cap tech stocks.
A->B; B -> A Ponzi continues until 🦃🦃
I heard somebody yelling:
"give me a 4.5 sigma" ==> like a level 10 earthquake
okay, here we go
XLU-QQQ spread z-score = 4.5 => level 10 earthquake
Sector rotation to "value" stocks cancelled by Powell & his ardent followers: Robinhooters & BTFD monkeys
this will end well?
"give me a 4.5 sigma" ==> like a level 10 earthquake
okay, here we go
XLU-QQQ spread z-score = 4.5 => level 10 earthquake
Sector rotation to "value" stocks cancelled by Powell & his ardent followers: Robinhooters & BTFD monkeys
this will end well?

people asking what is a 10 sigma event..
see below chart for a 4.5 sigma event.
XLU:QQQ linear regression lines:
the last 10-days scatter plot vs:
blue = 5-year regression (sigma calculated from 5-year)
green = 2.5 year regression
purple = 1 year regression
see below chart for a 4.5 sigma event.
XLU:QQQ linear regression lines:
the last 10-days scatter plot vs:
blue = 5-year regression (sigma calculated from 5-year)
green = 2.5 year regression
purple = 1 year regression

Ha. my screener laughed at me.
what 4.5 sigma (XLU-QQQ)?
here is a 6.02 sigma.. haha.
WMT-TSLA spread z-score = 6.02 sigma.
WMT = staple, non-cyclical, value, defensive stock
TSLA = no words; a cult stonk; beyond "gravity"
Yes. super bullish. party like 1999.
what 4.5 sigma (XLU-QQQ)?
here is a 6.02 sigma.. haha.
WMT-TSLA spread z-score = 6.02 sigma.
WMT = staple, non-cyclical, value, defensive stock
TSLA = no words; a cult stonk; beyond "gravity"
Yes. super bullish. party like 1999.

Top 20 QQQ companies in term of market-cap (weight):
$INTC & $CSCO are outliers 🧐==> value stocks 🙃😎
$INTC & $CSCO are outliers 🧐==> value stocks 🙃😎

Top 42 QQQ stocks in terms of market-cap.
I am pushing the limit here.
Can I squeeze 100 charts in one screen? 🧐🙃
I am pushing the limit here.
Can I squeeze 100 charts in one screen? 🧐🙃

experiment:
changed the DPI to 1200, exporting to a PDF file
more clear than DPI 100 default setting in Matplotlib
changed the DPI to 1200, exporting to a PDF file
more clear than DPI 100 default setting in Matplotlib

$TSLA "Cult" Valuation justified?
$TSLA EPS Est by analysts to justify the insane valuation
from 90 days ago to current est: trending higher; of course to justify the valuation
notice the difference between the RED bar & Green bar
can they make it?
the BAR is too high 🦃
$TSLA EPS Est by analysts to justify the insane valuation
from 90 days ago to current est: trending higher; of course to justify the valuation
notice the difference between the RED bar & Green bar
can they make it?
the BAR is too high 🦃

LOW:HD Pair trading example:
LOW:HD pair spread z-score = -2.1; hedge ratio = 1.81
Both at ATHs, but $HD underperforming $LOW
I like $HD; I am biased; 🧐👌
LOW:HD pair spread z-score = -2.1; hedge ratio = 1.81
Both at ATHs, but $HD underperforming $LOW
I like $HD; I am biased; 🧐👌

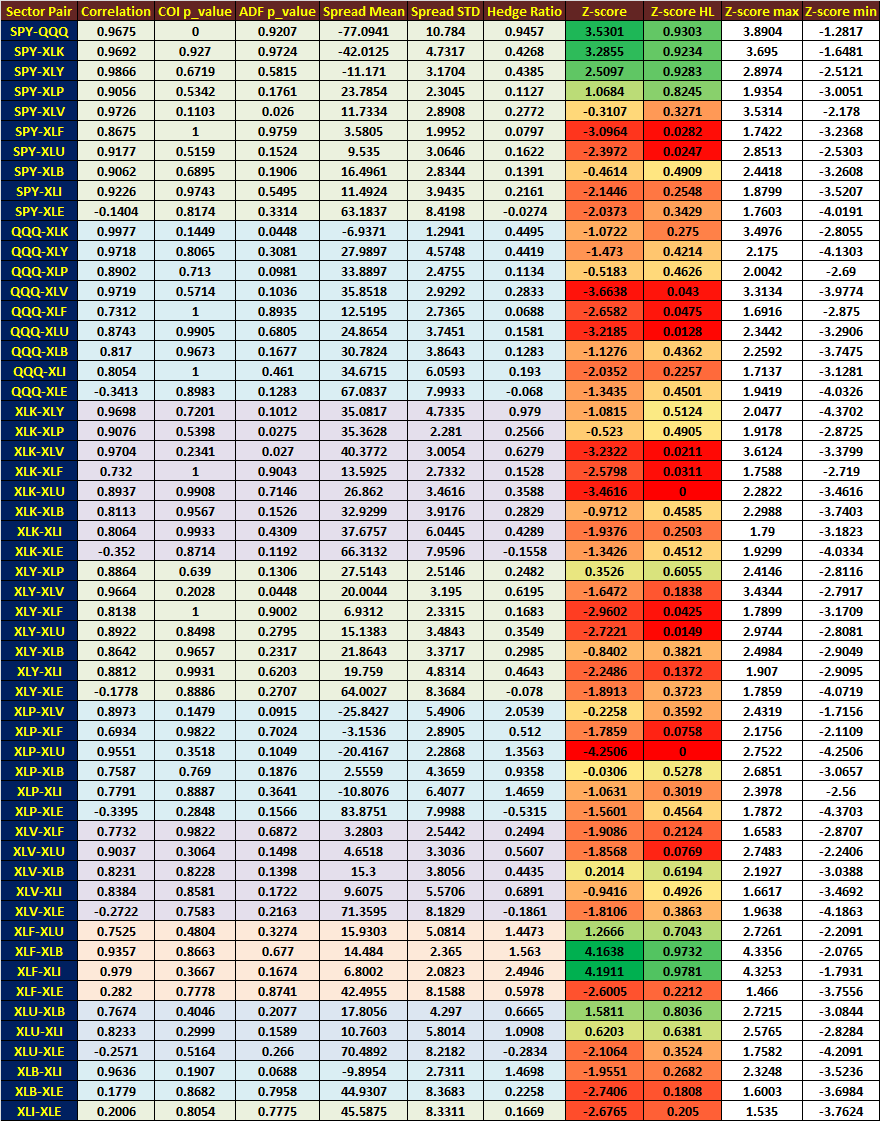
S&P-500 Sector rotation & relative strength table
all sector relative strength in one table
ex:
SPY-QQQ pair: (5-year data)
Z-score= 3.53 sigma (QQQ outperforming SPY)
Z-score HL= 0.93; at 93% relative to 5 year high & low
Z-score max= 5 year high #
Z-score min= 5 year low #
all sector relative strength in one table
ex:
SPY-QQQ pair: (5-year data)
Z-score= 3.53 sigma (QQQ outperforming SPY)
Z-score HL= 0.93; at 93% relative to 5 year high & low
Z-score max= 5 year high #
Z-score min= 5 year low #
SPY-QQQ pair spread Z-Score Plot (5 year)
SPY-QQQ z-score = 3.53 sigma,
at 93% relative to 5 year Hi-Lo range
super bullish? or super-duper bubble? 🦃🙃👌
SPY-QQQ z-score = 3.53 sigma,
at 93% relative to 5 year Hi-Lo range
super bullish? or super-duper bubble? 🦃🙃👌

My favorite.
INTC-TSLA pair spread z-score = 7.11 sigma (a record)
TSLA #5 on the QQQ market cap list
INTC #11
crazy valuation. 10 sigma next week? or 20 sigma?
a picture is worth a million words.
I need more colors 🙃👌
INTC-TSLA pair spread z-score = 7.11 sigma (a record)
TSLA #5 on the QQQ market cap list
INTC #11
crazy valuation. 10 sigma next week? or 20 sigma?
a picture is worth a million words.
I need more colors 🙃👌

💰💰If you can only monitor one indicator for: 💰💰
1 BTFD - below fear zone, BTFD on cross-over
2 STFR - above euphoria zone & Jaws (divergence), STFR on trend-line break
my super smart dog Algo strategy
thanks to my "genius" dog, divulging her trillion $ strategy for free👍
1 BTFD - below fear zone, BTFD on cross-over
2 STFR - above euphoria zone & Jaws (divergence), STFR on trend-line break
my super smart dog Algo strategy
thanks to my "genius" dog, divulging her trillion $ strategy for free👍

For Market profile gurus
some people claimed they had a hard time grasping the z-score sigma chart
I did a quick & dirty "market profiling" for the z-score
1 POC or TPO=point of control almost perfectly aligned with 0 mean
2 VAH-VAL=70% of the volume traded
statistics & prob
some people claimed they had a hard time grasping the z-score sigma chart
I did a quick & dirty "market profiling" for the z-score
1 POC or TPO=point of control almost perfectly aligned with 0 mean
2 VAH-VAL=70% of the volume traded
statistics & prob

Correlation study:
SPX-Gold correlation 50-d
SPX-VIX correlation 7-day
SPX-VVIX correlation 7-day
A. 2 out of three aligned = good prob (> 70%🦃)
B. 3 out of three alighed = excellent prob ( > 85%🦃)
C. today? yep. 3 out of three stars aligned
left tail risk is rising BIGLY
SPX-Gold correlation 50-d
SPX-VIX correlation 7-day
SPX-VVIX correlation 7-day
A. 2 out of three aligned = good prob (> 70%🦃)
B. 3 out of three alighed = excellent prob ( > 85%🦃)
C. today? yep. 3 out of three stars aligned
left tail risk is rising BIGLY