Kerberos007 Profile picture
To transform massive raw data into meaningful trading information which in turn enables one to build investment knowledge. This is for educational purposes only
64 subscribers
May 25, 2022 9 tweets 3 min read
in theory

1) if SPX @Ath, making higher highs
2) $VIX should go down, or making lower high
3) but if both moving up in sync with 7-day corr>25%
4) means left-tail risk rising
smart-money long SPX puts, hedging under-the-hood, expecting a risk event coming
5) someone always knows 6) same for VVIX
7) normally, SPX & VVIX should be negatively correlated
8) but, if both SPX & VVIX moving up together with 7-day corr>30%
9) means left tail-rising
smart-money long VIX calls, hedging under-the-hood, expecting a risk event coming
10) someone always knows😎
May 25, 2022 8 tweets 2 min read
leading & lagging Indi's difference?

in Dec 2021
1) SPX made higher highs daily, super bullish chart patterns on all fractals
2) all SMA/EMAs pointing up
3) all lagging/coincident indi's moving up
4) plus, $GS claimed strong seasonality & massive share buybacks coming in Jan/Feb 5) believing: Powell is always has your back
6) inflation is transitory😉 the US economy is very strong, plus TINA & cash is trash
7) what could possibly go wrong?
8) bullish, all-in, fomo buy @ ATHs & BTF-rip🤣
9) with full margins & 10x lever
10) dreaming buying a super-yacht🍻
Mar 26, 2022 18 tweets 3 min read
warning: a long thread😉

a real story on one of my data mining projects

a few years back, I embarked a huge project trying to find the best standard "indicators" for swing-trading under all market conditions.

I picked several most popular indy's

below is the MACD story. I only trust data, and backtesting is just one of many ways of verifying the data-mining results:

Back-testing usually involves “data mining” which denotes the practice of finding a profitable trading strategy by extensive search through a vast
number of alternative strategies.
Aug 15, 2021 4 tweets 1 min read
super educational material in below thread & sub-threads for Pair-Trading strategies:

I have more to share in the coming days & weeks & months with my latest research employing the latest technology🧐

stay tuned 😉 😎
Aug 1, 2021 28 tweets 9 min read
below chart intrigued me BIGLY

prompted me to dig into more about $VIX behavior pre-crisis

I took this oppor to get all of my prevous notes/studies/programs on $VIX modeling/prediction to compare results for detecting VIX anomalies before crisis to improve my market-top ind's
Jul 26, 2021 4 tweets 2 min read
These are from 15-min time frame only

see below

I have separate tables for 1 hr & 4 hr & daily

for now, I only concentrate on a few inidcators:

1 MACD
2 RSI
3 CCI

more later, to test the effectiveness with these ind's or a comnibation of these

when all TFs align, go for it
Apr 27, 2021 9 tweets 3 min read
ZH - Nomura Axes Head Of Risk After Revealing More Losses Tied To Archegos Implosion

Nomura also suspended some senior executives, following in the footsteps of $CS

- more cockroaches in the kitchen? 🤣👌 There are 4 different SMA related "breadth" indicators:

index % stocks
1 above 20d SMA
2 above 50d SMA
3 above 100s SMA
4 above 200d SMA

if the index itself (say, S&P-1500) is trading above 20d-SMA, it doesn't make sense to look into % stocks above 100d SMA or 200d SMA.
Apr 26, 2021 10 tweets 4 min read
Every weekend,
during the "shaking out the weak hands" attempt,
just BTFD when #BitCoin down ~20%, and found support around 100d-SMA (red line)

works like a charm

50-day SMA also offered a strong support since April 2021

%B (20, 2) also a good confirmation signal around 0 line A. Tuesday Inflation Chart porn:

There is no inflation
inflation is contained
Inflation is transitory 🤣

#1: Bloomberg Commodity Index cash
#2: Bloomberg Agriculture Index Futures

Since May 2020, burrrr4ever to infinity
and
whatever it takes.

they got what they wanted
🍻👌
Apr 22, 2021 4 tweets 2 min read
Seagate STX is scheduled to report 3rd fiscal 2021 earnings on Apr 22

STX anticipates third-quarter fiscal 2021 non-GAAP earnings of $1.30 (+/-15 cents) per share.

Priced for perfection. over-valued.

yesterday, $STX put volume surged = 4x 30-day avg

Volume PCR = 5.42👌🧐 ORCL

Volume-PCR for $ORCL surged the last two days with analyst upgrades.🧐

Put volume surged BIGLY yesterday.

somebody always knew in advance

Today $ORCL down -2.3%

$SPX down 40 points.
$VIX above 19 again.
Apr 20, 2021 5 tweets 2 min read
that's a quiz🧐

"when most of the Index IVX30HL=0; last Fri"
what does that mean?
ans: 1 yr low

yep. most of the index & ETF IVX30HL ~0 last Fri,
bullish++
Stonks always go up, what could possibly go wrong?

then
time to buy VIX calls
or buy SPY puts
on Fri

super leading🍻😎 Small cap (Rut & IWM) was down more than 1.5% Mon

See the puts explosion since last wk on $RUT & $IWM

especially RUT put volume for Mon

massive Put volume demand for $Rut on a -1.5% down day

volume Put/Call ratio=10.87?🦃(wow)
fear of a small-cap crash 🍻🤣

IVXHL surged also
Feb 4, 2021 21 tweets 7 min read
To the new generation of penny stock investors
WallStreetKids

Penny stock screener

criteria

stocks < $1
up 50+%

WSK lotto tickets to da Moon screener

Click 'like' if you want me to keep posting the penny screener with different criteria 🤣🧐

Is this legal? 🍻 Image WSK to da Moon screener

penny price > $0.01
penny price < $2.00

up 20+% today Image
Dec 23, 2020 4 tweets 1 min read
To quant followers:

A few good books for Christmas and New Year.

1 Machine Learning for Factor Investing R Version
by Tony Guida; Sep 1, 2020

2 Algorithmic Trading: A Practitioner's Guide Paperback – by Jeffrey M Bacidore; July 20, 2020 3. Machine Learning for Algorithmic Trading: Predictive models to extract signals from market and alternative data for systematic trading strategies with Python, 2nd Edition Paperback – July 31, 2020
by Stefan Jansen

- this is the best one for 2020 from my reading list.
Dec 18, 2020 176 tweets 61 min read
if our beloved $SPX tanks 20-30% from here, I would post a looooong BTFD list 😉

stay tuned.

it is coming 🤣 $USD up
$VIX up

$USD up
$VIX up
$SPX down

the correlation between $USD and $VIX > 50%,
since March

If USD == up and SPX == up
STFR 👌

if USD ~= 85:
sky is falling 🤣

Plus $JPY correlation, Image
Dec 17, 2020 5 tweets 2 min read
Equity call/put ratio (equity PCR inverted)
vs
$GEX

correlation>54%

both at "maximum optimism" lvl

plus

NYSE short-interest at lowest level in the last 10 years as posted Sun

what could go wrong?🧐

No more shorts to squeeze
all traders are super bullish, all-in, fomo

👇👇 Dec 16th:

from my magic screener:

STFR idea:

two super over-valued stocks

1 ACGL: close 35.40; high valuation & analysts downgrade
2 AAL: close 16.86; super over-valued; poor analyst rating

STFR & lotto tickets. 🧐👌
Nov 8, 2020 102 tweets 36 min read
Financial Stress Index ticks up to 0.1029 in the week ended Oct. 30 (0=normal)

see previous market corrections right after Financial Stress Index rising above 0 at rapid speed while $SPX $NDX were super bullish, complacent & FOMO

Feb 2018
Dec 2018
Sep 2019
Feb 2020

and Now?🧐 Image Shocking correlation between

1 St. Louis Fed Financial Stress Index and
2 VIX

Since 1994: amzing

To be exact: 26-year correlation = 85% Image
Oct 22, 2020 112 tweets 41 min read
monitor below chart closely.

$NQ just re-tested the lower support level

$NQ low = 11,598

they can't allow to plunge below 11,600 level.

otherwise, tomorrow bloodbath.

see below Support & Resistance levels

super accurate😉

stop-run levels on both sides: bulls & bears👇 $NQ support & strong resistance levels

4-hr chart since Aug

$NQ above 11,600 = strong support (late Aug)
once breaking down below 11,600 (in Sep), then
it became strong resistance

then,

once it breaking above 11,600 (in Oct), it became strong support

super accurate TA? 😉 Image
Oct 17, 2020 6 tweets 2 min read
volatility tips: 😉

why "volatility always came in clusters"? people ask

50% fundies & 50% technicals:

1 fundies/shocking-news triggering the first wave spike
2 people not prepared for the shock, scramble to buy protections
3 sell risky assets
4 rotate to safe-havens

#1 of 3 5 trigger dealer & MMs Gamma flip level, exacerbating the VIX spike 2nd wave

6 which in term trigger the over-leveraged weak-hand longs, hitting stop loss levels & margin calls- 3d wave

7 risk-parity funds portf rebalance due to sudden plunge in risky assets. trimming

#2 of 3
Oct 8, 2020 6 tweets 2 min read
Trump sent call buying signal to his paid service subscribers 10 minutes in advance. 🧐

$REGN OTM calls to da Moon tomorrow.

Blatant stock market manipulation "legally"?

where is $SEC ? 🙃 Read above post

Where is SEC?
conspiracy?

Trump is

1 "car" salesman (OTM calls) for stonks
2 insider trading paid service Ponzi sponsor
3 selling insider information for profit
4 blatant stock market manipulation

proof? conspiracy?

$SEC investigate?

call vol & call OI 👇
Sep 3, 2020 5 tweets 2 min read
People asking about BTFD indicators:

I have tons of these..

BTFD #1 - Capitulation zone BTFD indicator #2

Maximum pessimism and Capitulation zone

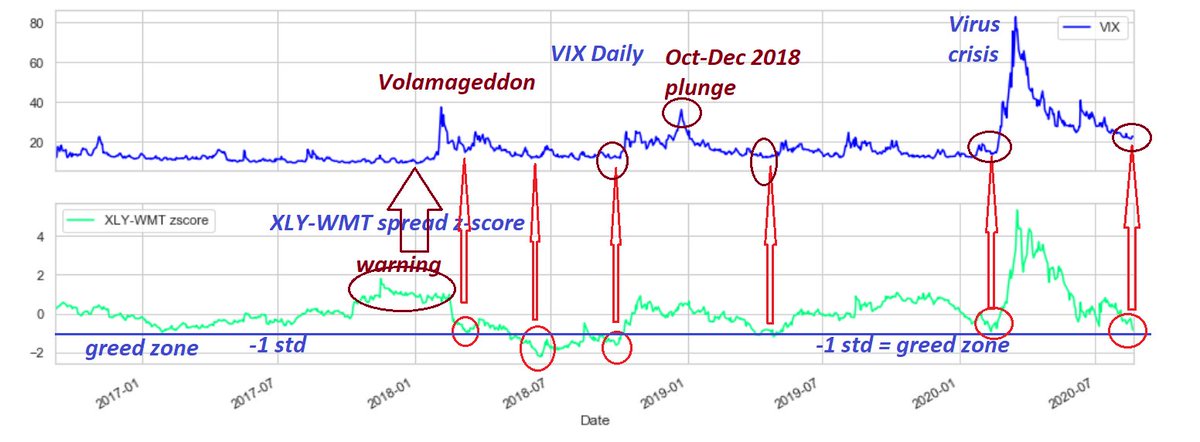
Aug 25, 2020 19 tweets 7 min read
my favorite strategy

$XLY & $WMT spread z-score

entry
z < -1 std => long 1/3 of total lots
long WMT & short h * XLV

z < -2 std => long 2/3 of total lots

profit
z > 0 std => out 1/3 lots
z > +1 std => out 1/3 lots
z > +2 std trailing 1/3 lots

stop
z < -3 std. out. XLY-WMT spread vs $VIX

when XLY-WMT z-score < -1 std (greed zone), #VIX spiking secured in 1-2 wks time-frame

should be confirmed by many of my other breadth & Jaws indicators

also huge warning, when VIX crushed, but the spread rising. stealthy sector rotation in Jan 2018
Aug 23, 2020 5 tweets 2 min read
a derivative of this arbitrage strategy is to time your favorite stock

1 if I prefer over based on fundamentals & other economic factors

2 wait for > than ; spread > 2 std

3 then, long ,; short

4 with money mgmt of -10% stop loss and position sizing Hedging or pair trading with SPY, QQQ & SPY-500 sector ETFs

criteria

1 correlation>0.8
2 co-integration pvalue<0.05
3 ADF stationary pvalue<0.05

long your favorite stocks & short the index & sector ETFs

or

short , & long your favorite index & sector ETFs

1 of 3 Image