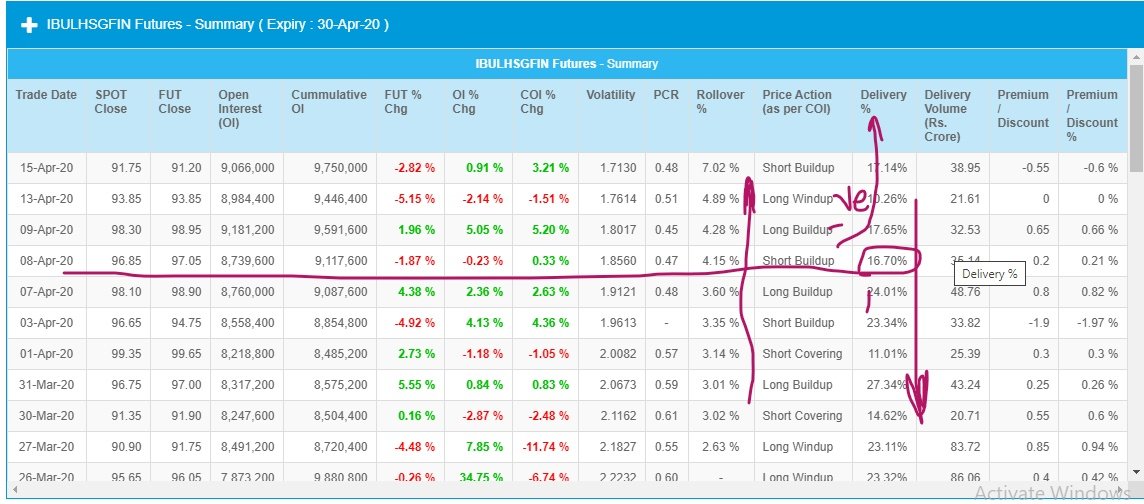
When Data & Aata is coming together....its necessary to see the building up picture.

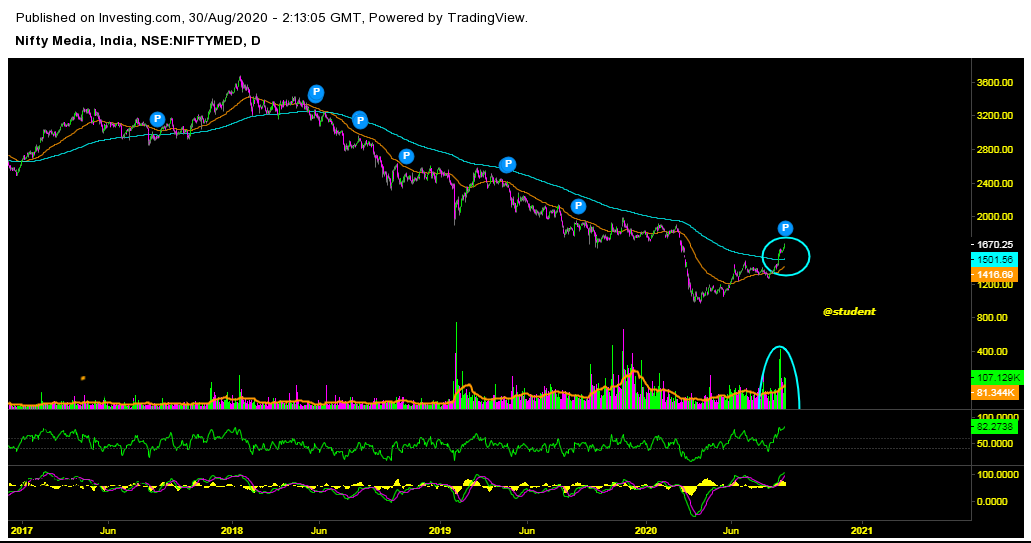
#NIFTYMEDIA

*** B/O of down sloping channel with significant volume..
*** Crossover of 50 & 200 DEMA.

Find your stocks in the sector. ImageImage
Non FNO, where i am looking for.

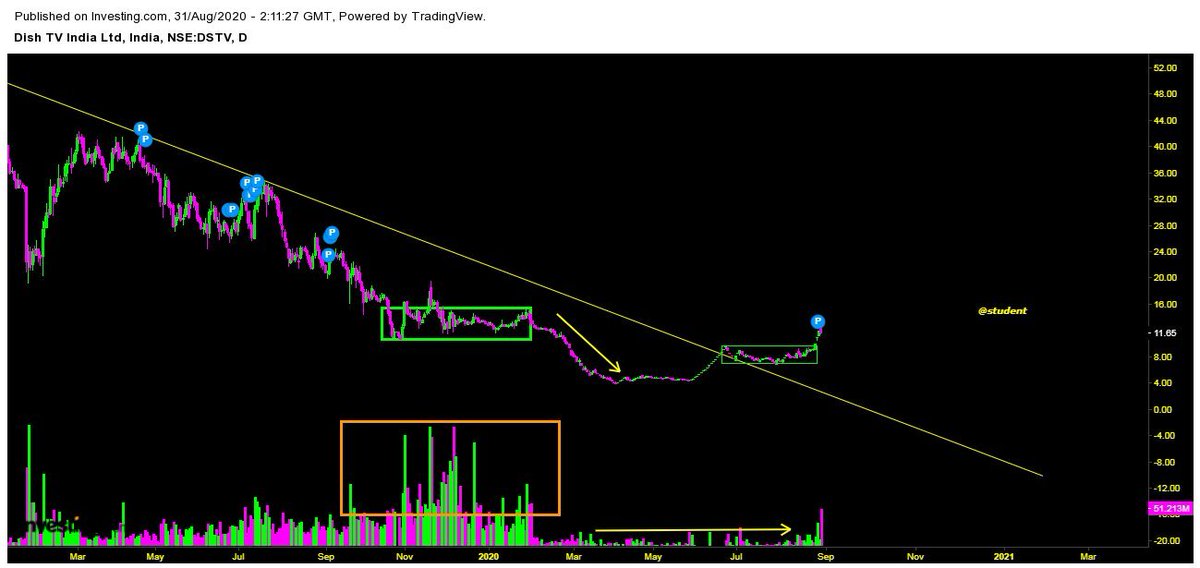
A deep consolidation, Away from limelight, A penny stock where we see unprecedented volume in recent past. ImageImage
Just for info..it has just come out today...

What do you think stock will do.....
From loss making Company turned in profit . Image
So far up by
10% from the results announcement.
#DISHTV

Weekend study.

*** Delivery vol. & % data shown buying by strong player with greater no. of Traded quantity /no. of trades than its monthly average..

*** Media index shown better Relative Strength than NIFTY 500. Image
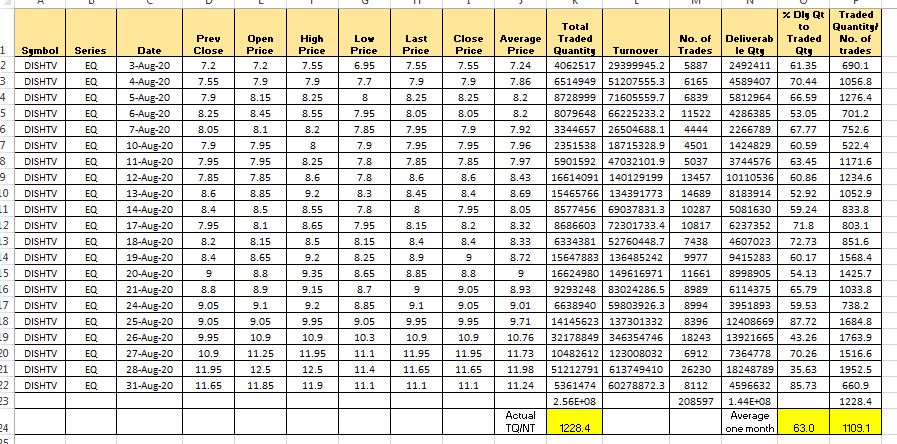
Stock performance in last 15 days.

*** Stock accumulation & delivery % increasing is simple yet powerful indication.

*** Quarterly results were known to Insiders (Every time).

Up move awaited.

25% ++

Before After ImageImage

• • •

Missing some Tweet in this thread? You can try to force a refresh
 

Keep Current with Student

Student Profile picture

Stay in touch and get notified when new unrolls are available from this author!

Read all threads

This Thread may be Removed Anytime!

PDF

Twitter may remove this content at anytime! Save it as PDF for later use!

Try unrolling a thread yourself!

how to unroll video
  1. Follow @ThreadReaderApp to mention us!

  2. From a Twitter thread mention us with a keyword "unroll"
@threadreaderapp unroll

Practice here first or read more on our help page!

More from @BasicLearner

26 Jul
#Option Chain
#Option trading

# ATM CE position built up... Strong resistance
# ATM PE position built up... Strong support.
# Far OTM position built up on call side...Strong bullish
# Far OTM CE position built up... Strong bearish....

I couldn't find it so simple.
Mostly, what I learned is this presumption is a very easy way to misguide the masses by using the option chain.

On many occasions I have taken absolutely opposite stand and got good hit ratio.
Apart from the position built up, if one pays attention to futures position, traded value in cash and delivery% along with the traded value at the each strike price of respective option, this may give much stronger insight of bias, since, bigger money at stake.
Read 10 tweets
30 Apr
24 March 2020..... India equity markets made low of 7511 and next 35 days 2348 points recovery.

So let's see which all sectors participated and which lagging behind.

Violet line indicates ... Nifty 50 Index
Green line indicates respective Index.
Yellow line indicates... RSI(14)
My chart reading says..

Participating sectors... NIFTY financial services, Pvt bank, Metal, Energy, Auto, Infra & IT

Laggards..... Nifty consumption, FMCG, Pharma, Media, Realty, PSU Bank

So one can decide where to long and short in May series.
Image
Read 17 tweets
24 Apr
Why did I say so?

Let's have a look, how smart men set the move and we dragged along.

A learning thread of price action and its option chain set up.
Stage 1.

Stock come into radar on 17 Apr 20. with its increase in traded value, traded volume and above average delivery % in last one week. Also, noticed the ratio of number of trade and total traded quantity is high..... Seems big players are interested in this.
With this set basic set up further peep into the charts and option chain gave some important observations:

1. Stock is in consolidation since last expiry.
2. When CMP was around 1300. Unusual activity seen on far OTM PE.
3. On 1160 PE highest unwinding is observed.... GADBAD
Read 10 tweets
20 Apr
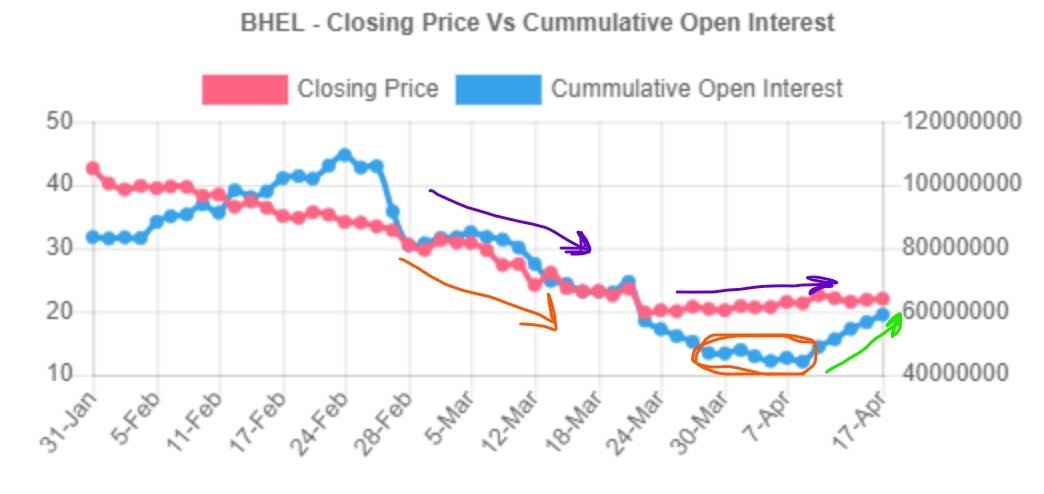
#BHEL #FNO #PSU #STOCKSTUDY #STOCKANALYSIS

It's wonderful Bullish set up.😀

*** Volume, Traded Value & Delivery%...... Up.
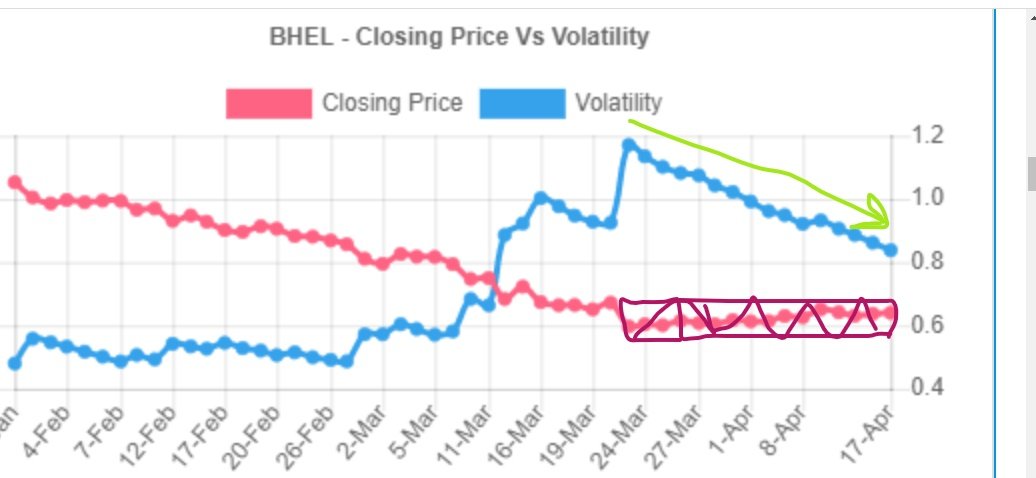
*** Consolidation for more than month in a Narrow range.
*** Unwinding in shorts from 30 March to 10 Apr.... Indicated with Orange color.

*** Fresh position added in Futures from 10 Apr on words.... Indicated with Green arrow.
*** Quite accumulation in progress. Fall in ATR value and daily volatility.
Read 6 tweets
18 Apr
1. Chart Pattern: Consolidation after four continued weekly bearish candles.
2. Price facing resistance at 20 DEMA.
3. COI rising.
4. Increasing delivery on weekly basis.
5. Addition in far OTM PE in Apr & May series.
6. Addition in ITM, ATM & all OTM CE.
7. PCR 0.58
We have very limited stocks in FNO in this sector.

Its IT sector.... Lets do some study.

*** Note.

Don't speculate. Don't mention name here. Allow everyone to put efforts. If you find the stock, study the effects. Focus on learning.
Commendable efforts by many..... small addition to input.

Nothing big happens without prior preparation......

Therefore, don't forget to check the data in recent past in Futures, option chain and delivery pattern.
Read 5 tweets
16 Apr
#IBULHSGFIN........ A case study.

21. 71% ++...... Surprise..... Isnt it???

Yes....For every one who sees it today.
This is a short story...

*** Stock made its low on 19 march. COI made a low on 30 Mar 2020. Thereafter, mild increase in the COI.....
Price almost trading in the range for almost last 15 trading days.
From 8th Apr.. Drastic reduction in delivery %, however rollover % increased.... Indicates no volume based selling by big players. Contracts getting rolled over to next series.
Read 8 tweets

Did Thread Reader help you today?

Support us! We are indie developers!


This site is made by just two indie developers on a laptop doing marketing, support and development! Read more about the story.

Become a Premium Member ($3/month or $30/year) and get exclusive features!

Become Premium

Too expensive? Make a small donation by buying us coffee ($5) or help with server cost ($10)

Donate via Paypal Become our Patreon

Thank you for your support!

Follow Us on Twitter!