
We published @howwefeel COVID-19 findings in @NatureHumBehav from 500K US participants in April-May on (1) factors for who got tested; (2) symptoms & factors for PCR+ tests; (3) pred models for + tests; (4) social distancing & mask wearing behaviors (1/).
nature.com/articles/s4156…
nature.com/articles/s4156…
Big thanks go to @weallen1, Han Altae-Tran, James Briggs, @xinnie, Glen McGee, @andyshi_stats, @bitdrift, Dave Cheng, @8en, @zhangf and many members of the @howwefeel team (howwefeel.org), all HWF participants, and partnership with the state of CT. (2/)
Using the self-reported @howwefeel app data from general public across 50 states, we investigated COVID-19-related symptoms, exposure, demographic and behavioral factors, preexisting comorbidities, and the degree of asymptomatic and mildly symptomatic cases. (3/) 
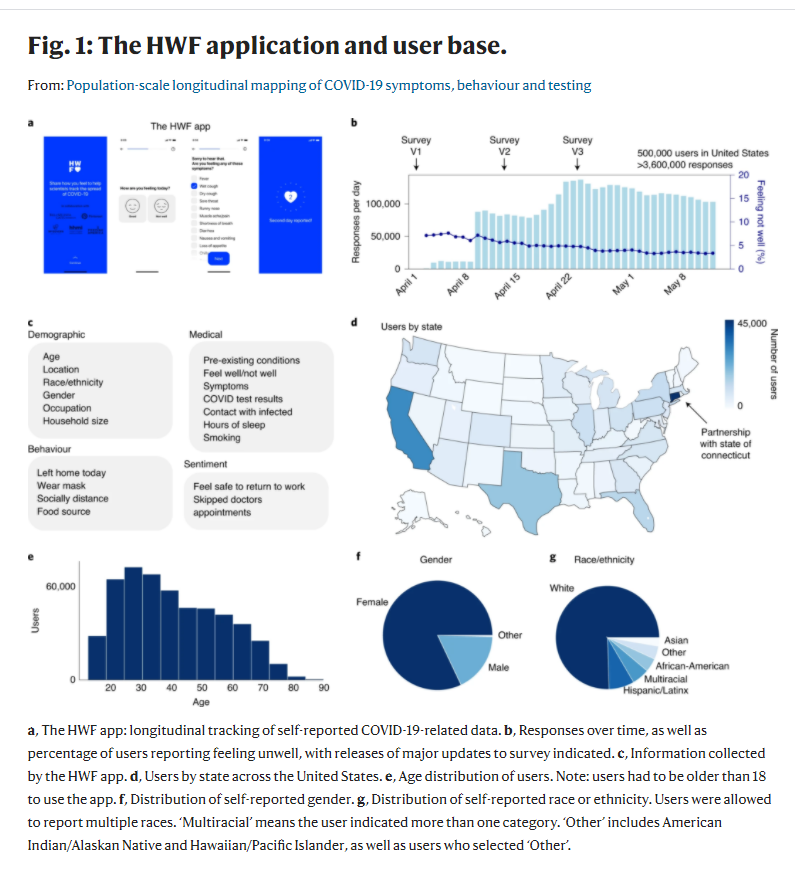
We found symptomatic subjects, healthcare workers and essential workers were more likely to be tested (4/)

36% of positive PCR test users reported symptoms not listed by CDC or no symptoms. These results suggest testing eligibility criteria in April and May might miss asymptomatic and mildly symptomatic cases (5/).
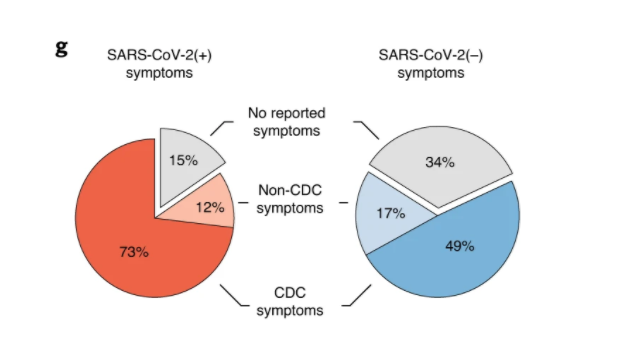
This estimated percentage of asymptomatic and mildly symptomatic cases was likely to underestimate the true % of asymptomatic and mildly symptomatic cases, as sick and vulnerable groups were more likely to be tested (6/)
Our Nature paper showed that about 87% of cases in Wuhan went undetected. Many were likely to be asymptomatic and mildly symptomatic (7/).
Analysis of the tested subjects showed that exposure both within and outside the household is a major risk factor for users testing positive: Odd ratios (OR) for within-household exposure =19.0, and OR of community exposure is 3.6. Within-house exposure has a much higher risk(8/

Males (OR=2), African-American & Hispanic/Latino users (OR=2.6 and 2.4), healthcare workers and essential workers (OR=1.9 and 1.7) are at a higher risk of infection, after adjusting for social-economic and pre-existing medical factors (9/)
The symptoms significantly associated with PCR + tests were: Loss of taste/smell (OR=33.2); fever (OR=6.3) & cough (OR = 4.5). Loss of taste/smell is the most important symptom: Prevalence of anosmia/dysosmia (loss of taste/smell)=0.6% (not tested), 5% (PCR -) & 39% (PCR +)(10/)

The symptom of loss of taste/smell has a very low prevalence in the general public and a very high prevalence among COVID-19 patients. With the flu season coming, it provides a useful COVID-19 symptom that distinguishes from the flu symptoms. (11/)
Those living in high-density neighborhoods had a significantly higher chance of testing positive (OR=1.85) (12/)
The model using only 4 household and community exposure & loss of taste and smell symptom variables predicted the risk of positive test very well (cross-validated AUC of the ROC =0.8), while the prediction model using only the CDC symptoms gave the cross-validated AUC=0.69 (13/)

This suggests it is insufficient to predict COVID-19 infection using only symptoms. It is important to perform risk assessment using both exposures and symptoms (14/)
Since symptomatic subjects & vulnerable subjects were likely to be tested, the subjects who were tested were not a random sample. To correct for selection bias, we used inverse probability weighted logistic regression when studying the factors associated w/ PCR + tests(15/)
61% of the users had left home: 77% of these users reported leaving for non-work reasons, including exercising, and 19% left for work. Of people who left home, a majority of users,
but not all, reported social distancing and using face protection. (16/)
but not all, reported social distancing and using face protection. (16/)

There was an abrupt, large increase in users reporting staying home after testing +. Many, but not all, PCR test (+) users reported staying home in the 2–7 days after their test date (7% still went to work), 23% of untested and 26% PCR test (−) users left for work (17/)

3% of PCR test (+) users, 10% of PCR test (-) users, and 13% of untested users reported going to work without a mask. Test positive and negative individuals and came into close contact with a median of 1 person and 4 people within 3 days respectively (18/)

Healthcare workers and essential workers were statistically significantly much more likely to go to work after taking a positive or negative test, (OR=9.3 and OR=6.8 respectively). A vast majority of PCR positive users stayed at home (OR=0.1) (19/)

