
📔 Mom's VWAP Workshop Thread 📔
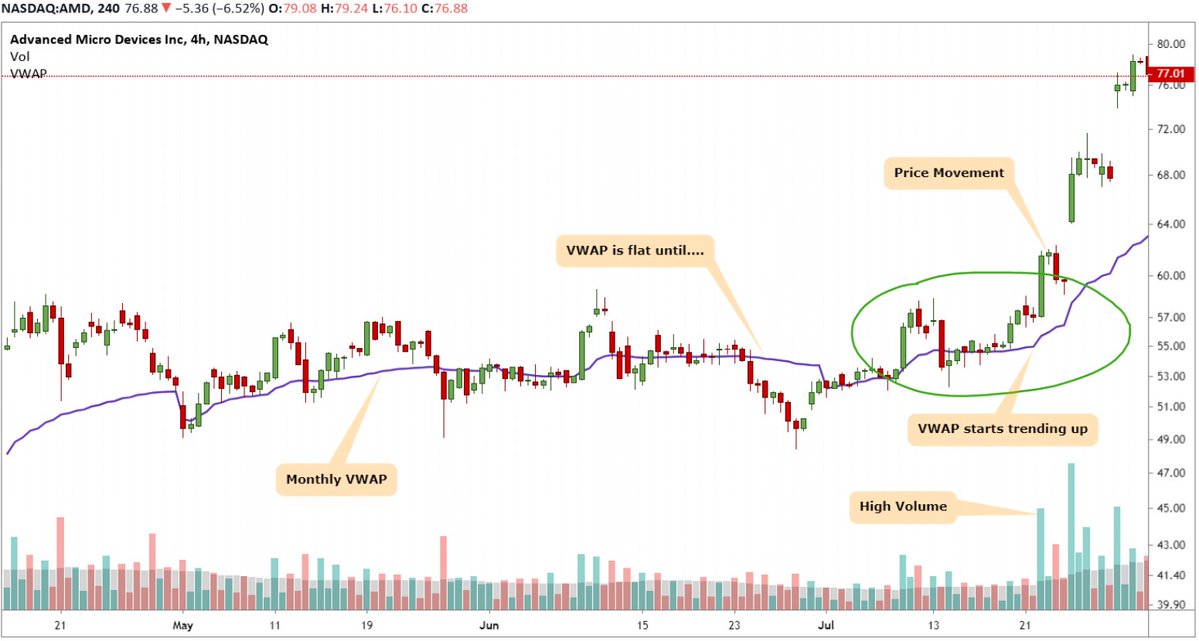
The Volume Weighted Average Price (VWAP) is a reference line you can place on your chart based on a combination of price and volume. Unlike price-only Simple Moving Averages (MA), it changes direction when price movement has volume behind it.
The Volume Weighted Average Price (VWAP) is a reference line you can place on your chart based on a combination of price and volume. Unlike price-only Simple Moving Averages (MA), it changes direction when price movement has volume behind it.
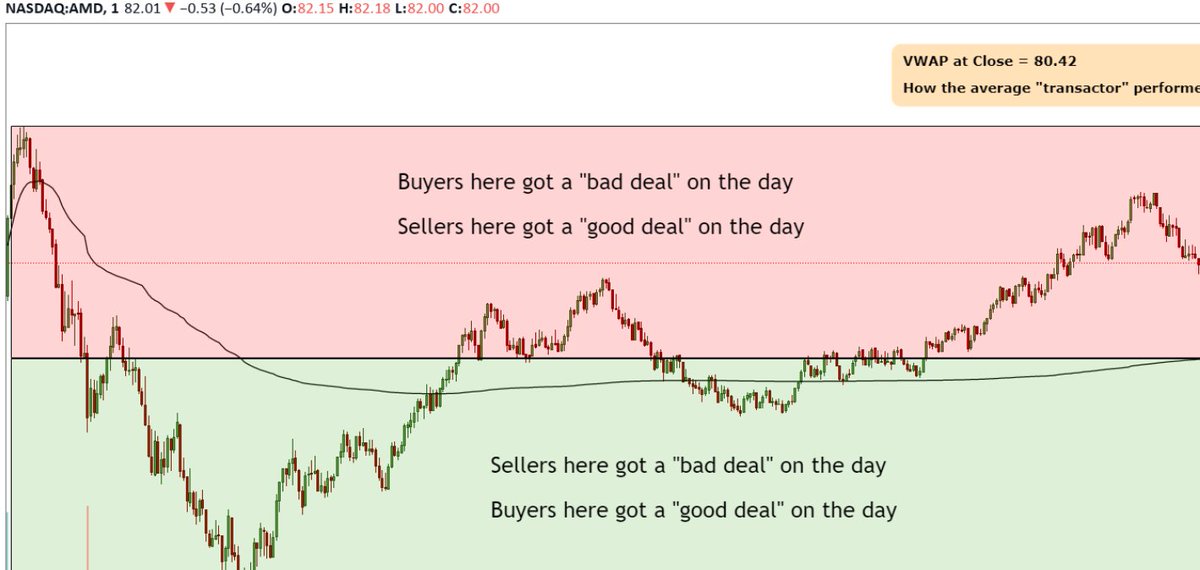
This is the best non-mathematical way to look at the VWAP:
"Draw the VWAP across any duration of time.....if you sold above it, you got a better deal than the average sellers...if you bought below it, you get a better deal than the average buyer"
intraday example
"Draw the VWAP across any duration of time.....if you sold above it, you got a better deal than the average sellers...if you bought below it, you get a better deal than the average buyer"
intraday example
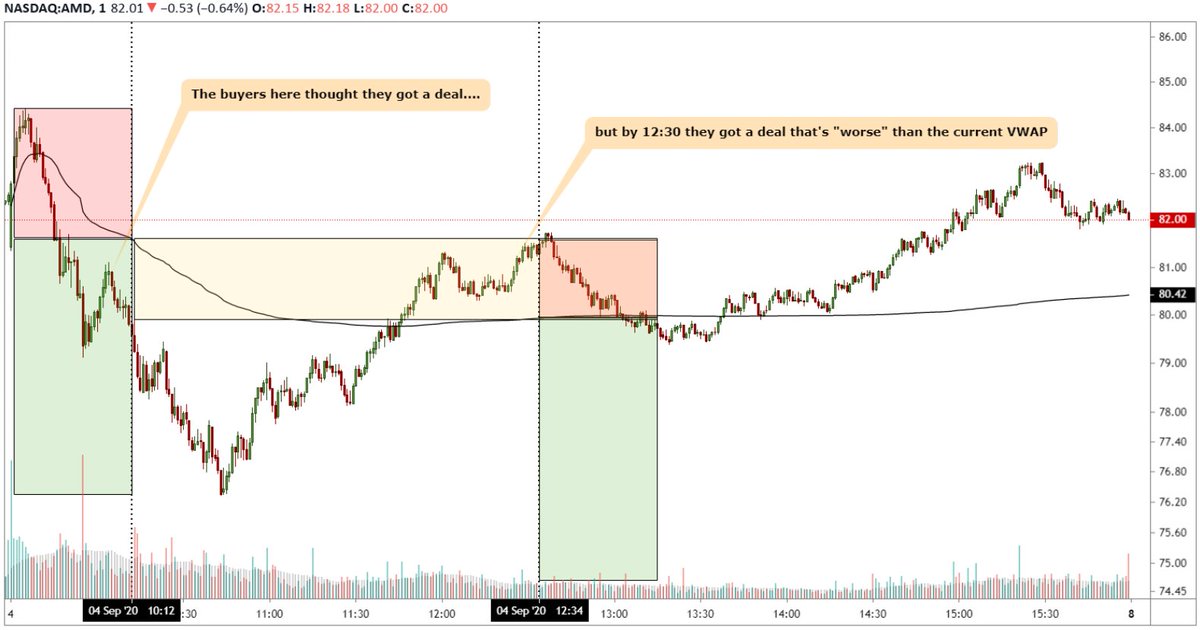
Now keep in mind, VWAP is evolving so don't fall in love with the hindsight perspective. In the chart below you can see, early morning 10 am buyers thought they got a deal but by noon and end of the day they were under-performers
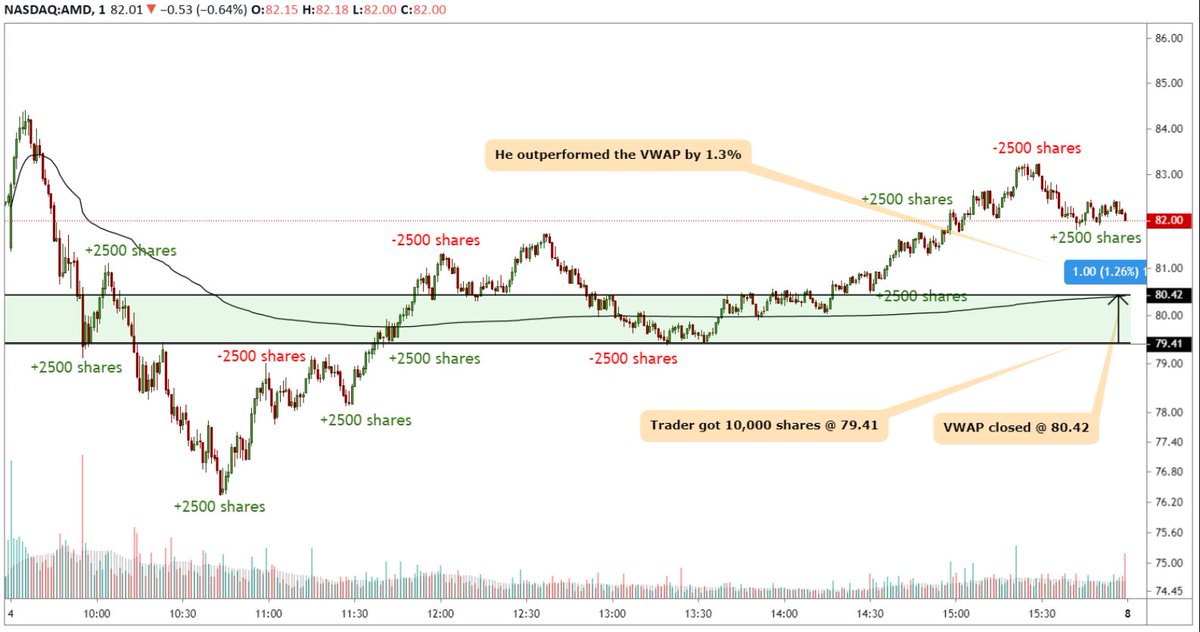
So the most common way VWAP is used by institutional traders is as a yardstick of their "selling" / "buying" performance.
Let's say a trader was to buy 1,000 shares of on this day, here is a theoretical performance relative to the VWAP at the day's close..his report card
Let's say a trader was to buy 1,000 shares of on this day, here is a theoretical performance relative to the VWAP at the day's close..his report card
You can extend this concept across any time frame...a trader may have the task of accumulating or distributing a position across a week, month or quarter even
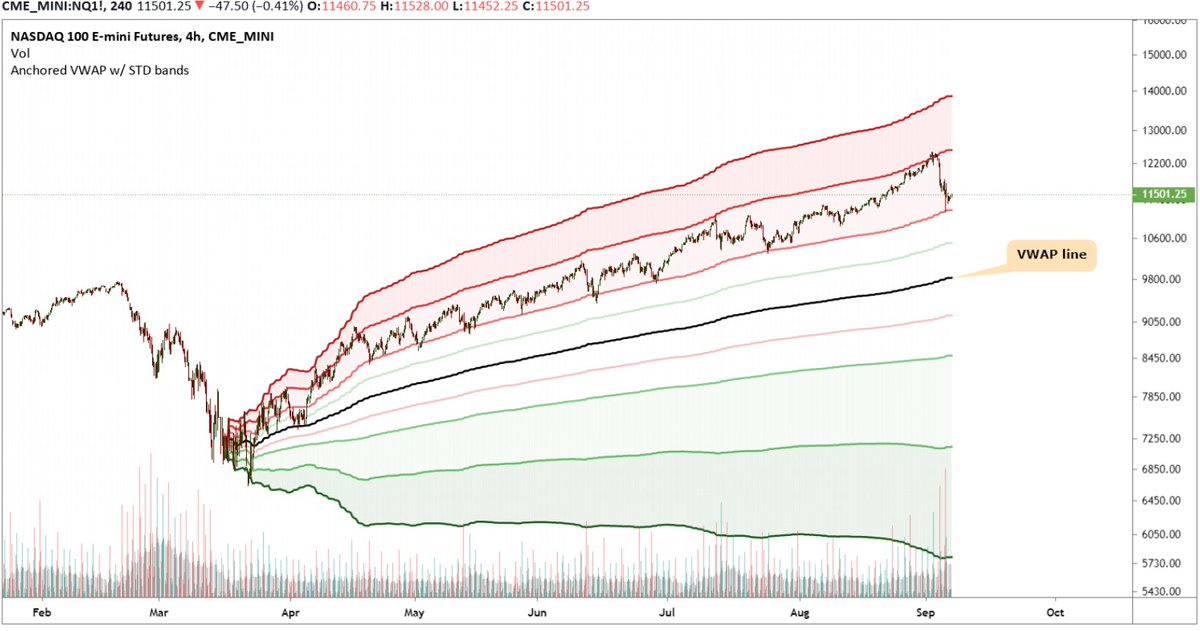
VWAPs can even be anchored to a special trigger event, here's one anchored to rate cut to 0% by the Federal Reserve
VWAPs can even be anchored to a special trigger event, here's one anchored to rate cut to 0% by the Federal Reserve
Next up, we'll look at VWAP bands and how to use the VWAP both a mean reversion and momentum type trade.
I gotta take the kids to practice for now ⚽️
I gotta take the kids to practice for now ⚽️
Ok let's look at VWAP bands but before we do, someone asked me a great question over a DM:
"Why does prices return to VWAP?"
I'll give the answer but it will be for both the above and the complimentary question of "Why do prices move away from the VWAP?"
"Why does prices return to VWAP?"
I'll give the answer but it will be for both the above and the complimentary question of "Why do prices move away from the VWAP?"
Without getting too technical, the simple answer is:
"As we move away from the VWAP, there is incentive for the winners to lock in the performance surplus. As we move back to the VWAP, there is incentive for the losers to close trades at a lower performance deficit"
"As we move away from the VWAP, there is incentive for the winners to lock in the performance surplus. As we move back to the VWAP, there is incentive for the losers to close trades at a lower performance deficit"
The dynamic of these two forces, namely profit taking and loss acceptance, all with the purpose of achieving OR beating a VWAP performance is what determines price behavior around it. Standard deviation bands help us contextualize this battle and see where the boundaries may be
So here's an example, 1 min candles across the session VWAP band.
I use 4 bands, 0.5, 1, 2 and 3 std deviations, centered around the VWAP
One easy observation you can make, albeit in hindsight, is with price under declining VWAP, this was a slightly bearish trending day
I use 4 bands, 0.5, 1, 2 and 3 std deviations, centered around the VWAP
One easy observation you can make, albeit in hindsight, is with price under declining VWAP, this was a slightly bearish trending day

So let's say you had the task of selling as much stock as you can for the best price on this day, this is your train of thought with respect to how your performance will be gauged (the VWAP)
You can just invert this thinking if you're buyer
You can just invert this thinking if you're buyer

So here's an example, where you can use some momentum divergence technicals and the -2 std dev band holding as a start point to buy and trade some
You tranche up your position into 3 entries, and add as we gain (test and CLOSE above) std deviation bands...you target VWAP
You tranche up your position into 3 entries, and add as we gain (test and CLOSE above) std deviation bands...you target VWAP

You can apply the same concept on the bands across any timeframe, in this example you come in with bearish bias looking for good trade location on shorting
Using indicators or TA that you're comfortable with in confluence can help entries, I'm using momo divergences here
Using indicators or TA that you're comfortable with in confluence can help entries, I'm using momo divergences here

That's it for VWAP band basics, next we'll look at how VWAP bands act on trending days and how they can be used to buy pullbacks in direction of trend. We';; also look at some risk management tips.
Please keep in mind this is all easy in hindsight so don't get too excited ❤️⚽️
Please keep in mind this is all easy in hindsight so don't get too excited ❤️⚽️
• • •
Missing some Tweet in this thread? You can try to
force a refresh


