1/ Why do I believe that COVID symptom survey data at SCALE could be a meaningful addition to the public health armamentarium?
Let me give you a glimpse- and I hope that you will be inspired to do your own analysis and join the symptomchallenge.org (and win the $50,000 prize)
Let me give you a glimpse- and I hope that you will be inspired to do your own analysis and join the symptomchallenge.org (and win the $50,000 prize)
2/ Background on the symptom survey- and how it might address some of the weaknesses of our existing public health surveillance methods is here:
3/ People who use facebook have been opting into these COVID-related surveys since April- at an unbelievable pace.
I ran a 10,000-person neighborhood random-digit survey in NYC for many years. I was very proud of it.
There are 8.8 MILLION survey responses in this dataset 🤯
I ran a 10,000-person neighborhood random-digit survey in NYC for many years. I was very proud of it.
There are 8.8 MILLION survey responses in this dataset 🤯

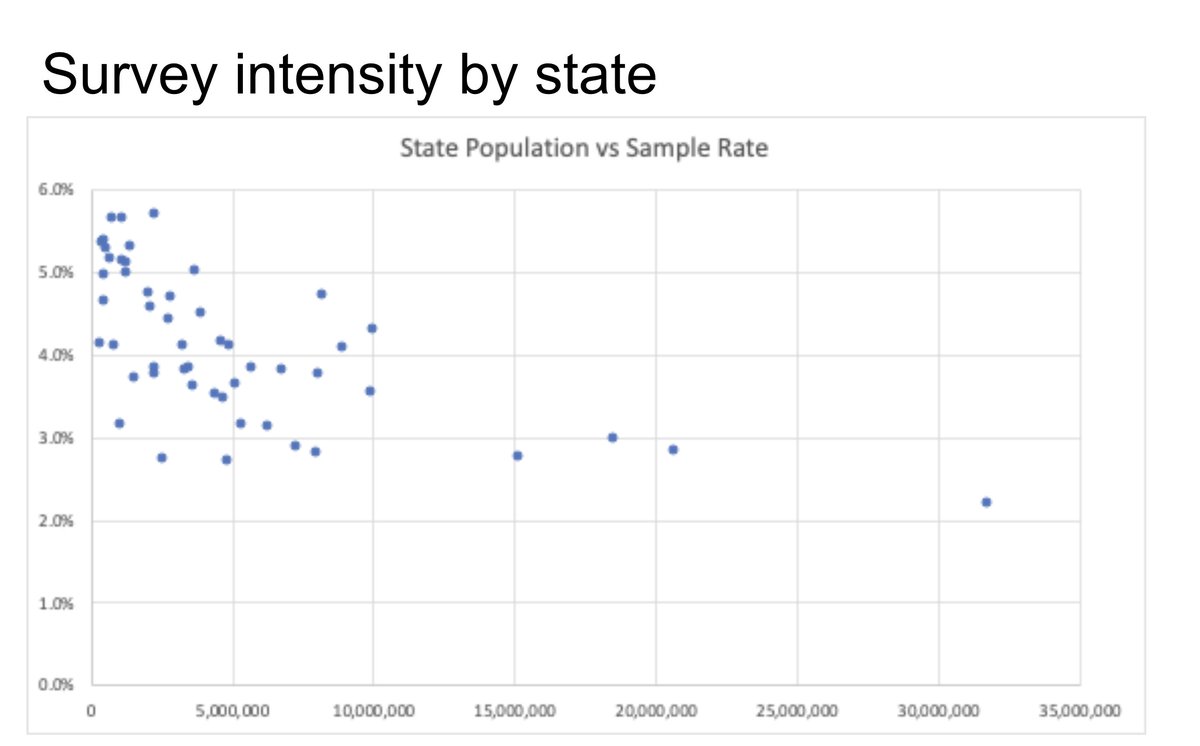
4/ Over the past 4 months, a sizable proportion of each STATE have filled out the @CmuDelphi survey
In big states likes California it might be "only" equivalent to 2.2% of the entire population (~700,000 responses). In smaller states, survey responses could be nearly 6% of pop!
In big states likes California it might be "only" equivalent to 2.2% of the entire population (~700,000 responses). In smaller states, survey responses could be nearly 6% of pop!
5/ Now everyone knows that poeple aren't equally likely to respond to surveys- that's why I'm skeptical of "convenience" samples- whether for surveys or "man in the street" serosurveys
But the researchers could statistically weight the samples: 18-34 yo men ⬆️ 35-54 yo women ⬇️
But the researchers could statistically weight the samples: 18-34 yo men ⬆️ 35-54 yo women ⬇️

6/ ..and they asked A WHOLE BUNCH OF QUESTIONS about different symptoms.
Fever?
Cough?
Difficulty breathing?
Anosmia/Ageusia (sense of taste/smell)?
Anyone in household?
Self?
Know anyone in community?
Which one has best signal? We need your help in figuring that out.
Fever?
Cough?
Difficulty breathing?
Anosmia/Ageusia (sense of taste/smell)?
Anyone in household?
Self?
Know anyone in community?
Which one has best signal? We need your help in figuring that out.

7/ If you take as a starting point a composite "Covid-like illness" syndrome [Fever AND (cough OR shortness of breath OR difficulty breathing)] it sure looks like there's a strong correlation between states with high covid case activity and symptom rates
That's "face validity"
That's "face validity"

8/ Here's another key piece of evidence that this isn't just GIGO
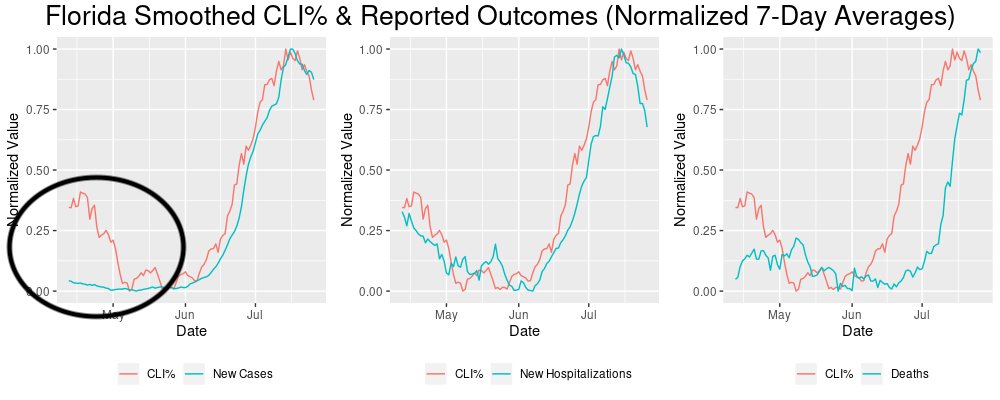
If we zoom in on one state, it really looks like the symptom data might lead other indicators of COVID activity, especially hospitalizations and deaths
And it's unaffected by testing bias.
Look at April on left-
If we zoom in on one state, it really looks like the symptom data might lead other indicators of COVID activity, especially hospitalizations and deaths
And it's unaffected by testing bias.
Look at April on left-

9/ At a time when @GovRonDeSantis was celebrating a Florida "success story" based on few diagnosed positive cases, it's clear now that there was a significant amount of COVID activity in the state, (and hospitalizations, and later deaths, though dwarfed by what was to come)
10/ We see the other side of the coin in NY (and NJ)- no matter what measure of symptoms we use, when the surveys first started up in April, there were sky-high levels of symptoms, they came down through April, and have been suppressed ever since.
This maps onto test positivity
This maps onto test positivity

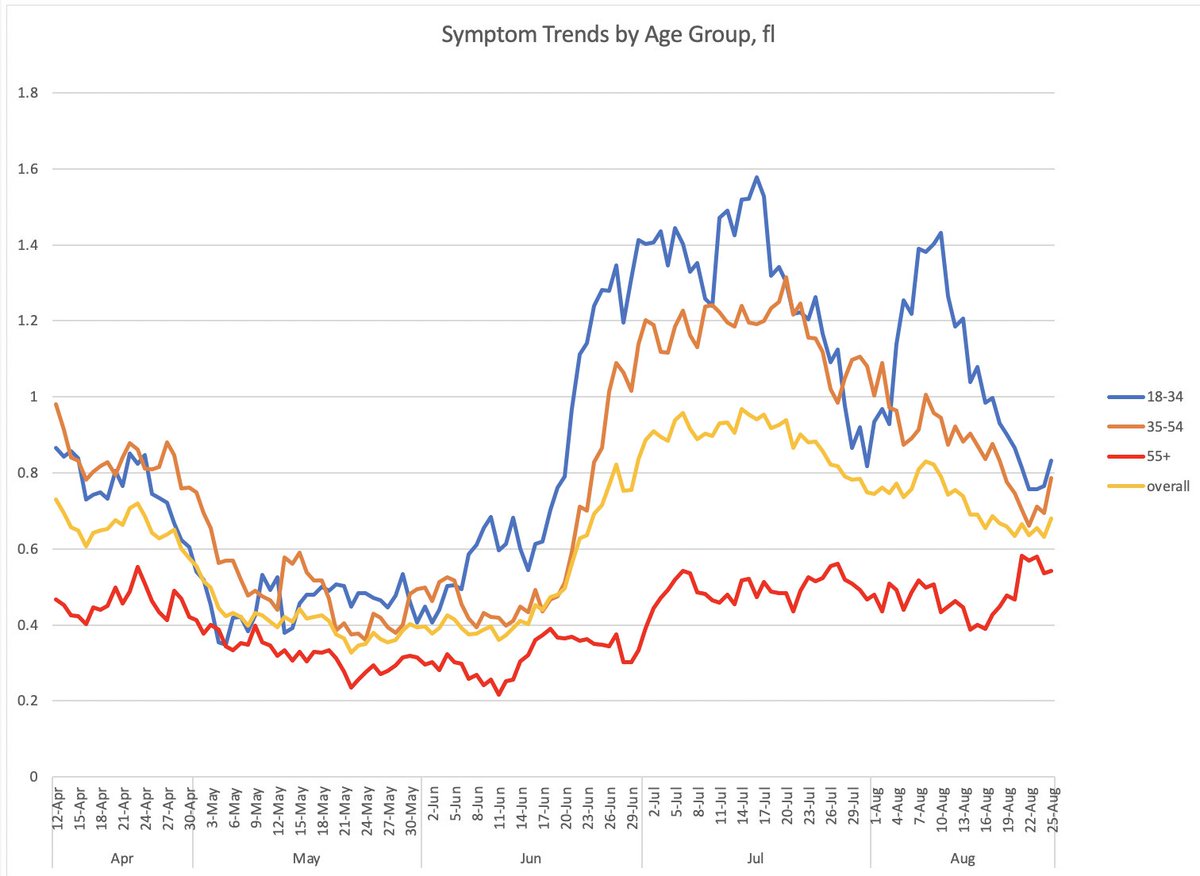
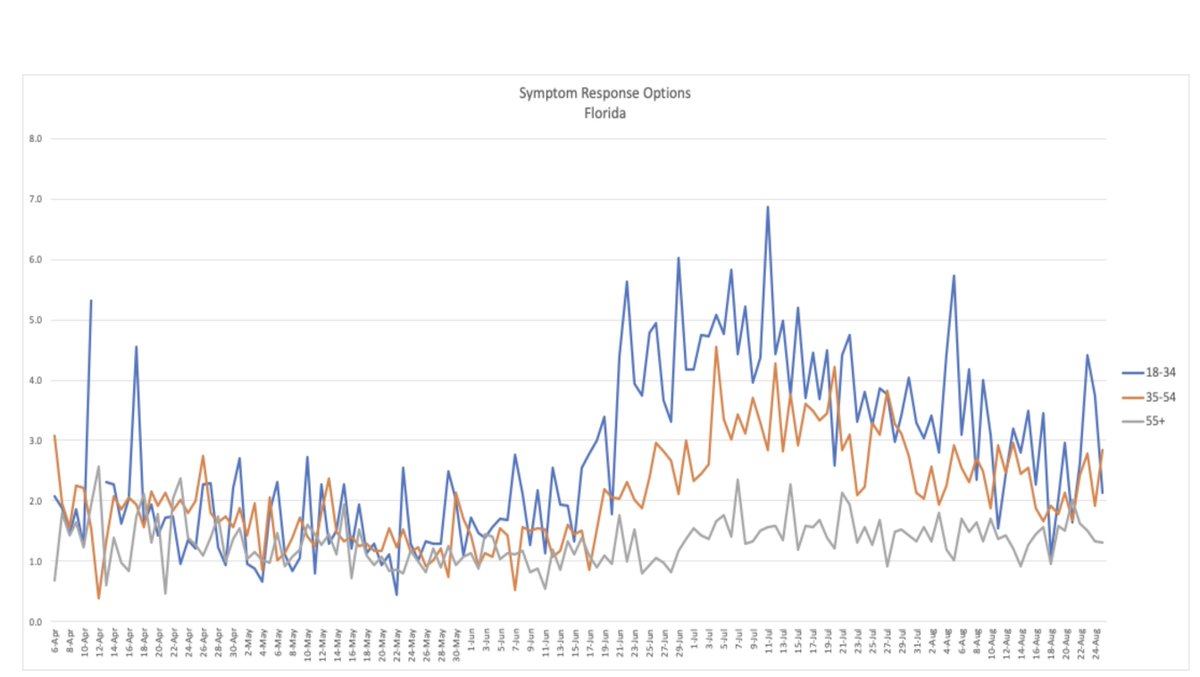
11/ It's especially helpful to break these trends down by age (and gender)- and there's nothing to say we couldn't add race/ethnicity
We SHOULD be able to have these breakdowns for cases/hospitalizations/deaths by state/county. We DON'T
Younger ppl MORE Symptoms (infections)
We SHOULD be able to have these breakdowns for cases/hospitalizations/deaths by state/county. We DON'T
Younger ppl MORE Symptoms (infections)

12/ [TANGENT]
It's crazy to me that an old has-been epidemiologist sitting in his basement is "unveiling" these results.
The data is PUBLIC thanks to @CmuDelphi
GO DOWNLOAD IT
Tell me what you found.
Enter the competition
cmu.app.box.com/s/ymnmu3i125go…
It's crazy to me that an old has-been epidemiologist sitting in his basement is "unveiling" these results.
The data is PUBLIC thanks to @CmuDelphi
GO DOWNLOAD IT
Tell me what you found.
Enter the competition
cmu.app.box.com/s/ymnmu3i125go…
13/ The gender difference is intriguing.
We know that men tend to die more from COVID than women, but is that because of more infections or more comorbidities/ more severe infection?
This data seems to show more symptomatic infections (or more honest reporting) among women.
We know that men tend to die more from COVID than women, but is that because of more infections or more comorbidities/ more severe infection?
This data seems to show more symptomatic infections (or more honest reporting) among women.

14/ But the age difference is ABSOLUTELY crucial to understanding what's going on
The central epi question of the moment is the extent to which deaths/cases are down because [more testing], [younger cases], [better treatment]
We NEED to monitor epidemic spread to elderly
TX:
The central epi question of the moment is the extent to which deaths/cases are down because [more testing], [younger cases], [better treatment]
We NEED to monitor epidemic spread to elderly
TX:

15/ From this data at least, it looks like (non-institutionalized) older people in hotbeds like Texas and Florida have - so far- been able to keep themselves largely away from the hottest spikes in the outbreak (though they do have higher rates of symptoms than other states
FL:
FL:
16/ What's cool about this data source is - we don't have to speculate.
They asked those same 8.8M respondents whether they avoided contact with other people "all or most of the time"
Older people have been more careful
(interesting to see Texas bump back up after flareups)
They asked those same 8.8M respondents whether they avoided contact with other people "all or most of the time"
Older people have been more careful
(interesting to see Texas bump back up after flareups)
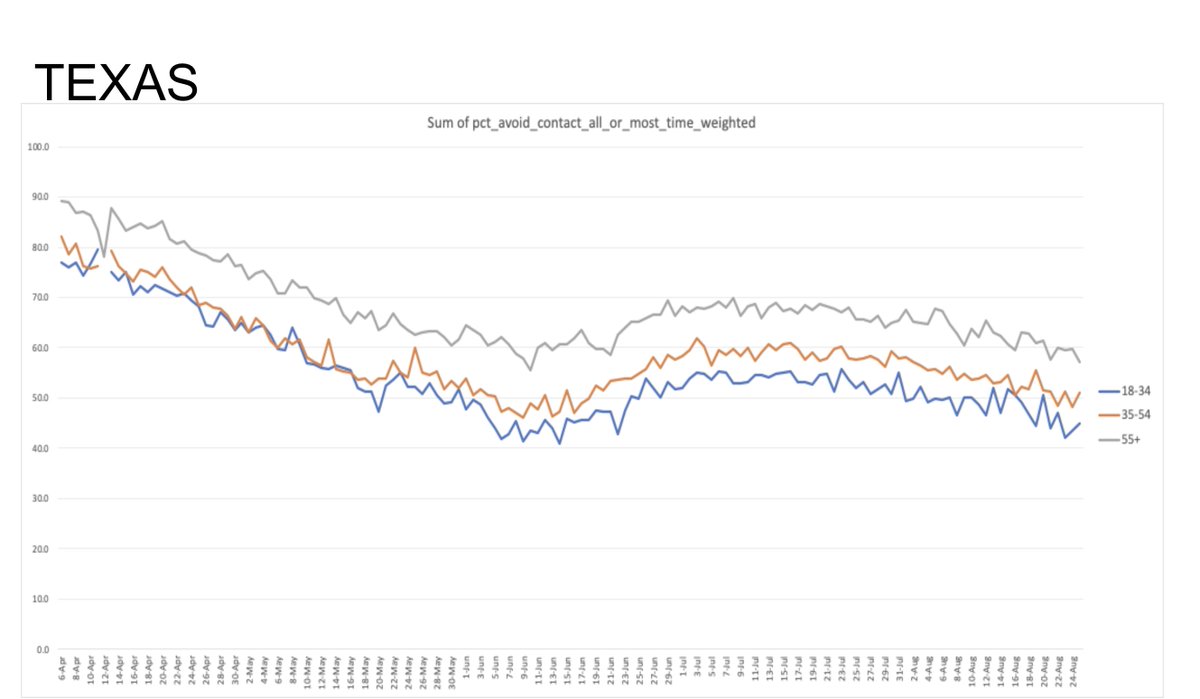
16/ We have all been relaxing our social distancing over the past few months
It's good to see FL/TX rebounding somewhat
NY was super-careful, continues to steadily decline, but it's well under control
What worries me are places like Alabama with ripping outbreak/less vigilance
It's good to see FL/TX rebounding somewhat
NY was super-careful, continues to steadily decline, but it's well under control
What worries me are places like Alabama with ripping outbreak/less vigilance

17/ The survey also asks if you've been in contact with someone with COVID.
It's concerning to see the lines cross for TX/FL and NY, and no- we can't totally isolate the elderly when it's spreading- see the increase in exposure in TX even among the elderly
It's concerning to see the lines cross for TX/FL and NY, and no- we can't totally isolate the elderly when it's spreading- see the increase in exposure in TX even among the elderly


18/ Another potential indicator might be to ask people if they know anyone in the community with covid-like illness, vs asking about them, or their household personally
In their blog, CMU colleagues show that correlation with community cases is higher for community CLI than self
In their blog, CMU colleagues show that correlation with community cases is higher for community CLI than self

19/ IMO correlation with diagnosed cases is likely to be somewhat misleading vs the question of whether there is ADDITIONAL value to the symptoms data- both community CLI and diagnosed cases are dependent on testing intensity. Self-reporting Sx aren't
Prevalence is HIGH in FL/TX
Prevalence is HIGH in FL/TX


20/ My final amuse-bouche to whet your appetite, my friends.
The survey also asked people with symptoms if they were tested, and what the results were
Here you can see testing availability marching up steadily in Texas, while the outbreak (positive results) rose and fell.
The survey also asked people with symptoms if they were tested, and what the results were
Here you can see testing availability marching up steadily in Texas, while the outbreak (positive results) rose and fell.

21/ But.. despite much wider availability of testing, MOST PEOPLE WITH SYMPTOMS DON'T GET TESTED
Even people with symptoms highly consistent w COVID>
That is a real problem- we need IMMEDIATE testing/contact tracing of those w symptoms to interrupt the chain
Here's CA
Even people with symptoms highly consistent w COVID>
That is a real problem- we need IMMEDIATE testing/contact tracing of those w symptoms to interrupt the chain
Here's CA

22/ I hope this taste of the symptom data entices you to join our #SymptomChallenge
webinar tomorrow, with
@DukeMargolis McClellan
@ResolveTSL @DrTomFrieden
@JHSPH_CHS @cmyeaton
register.gotowebinar.com/register/61026…
webinar tomorrow, with
@DukeMargolis McClellan
@ResolveTSL @DrTomFrieden
@JHSPH_CHS @cmyeaton
register.gotowebinar.com/register/61026…
Linking