
1/ Is there a way to gauge future expected returns for the US stock market?
What could the returns look like a couple of years from now, and more importantly, 5-year or even 10-year from today?
How could we gauge the risk to reward conditions in the US stocks today?
Thread. 👇
What could the returns look like a couple of years from now, and more importantly, 5-year or even 10-year from today?
How could we gauge the risk to reward conditions in the US stocks today?
Thread. 👇
2/ In this thread, we are going to leave bullish & bearish narratives aside, and just focus on valuations — which have historically been the most reliable indicator of future returns.
Please keep in mind that no indicators are perfect & history doesn't necessarily repeat.
Please keep in mind that no indicators are perfect & history doesn't necessarily repeat.
3/ We are going to start off with short term predictability, which is extremely difficult to trust.
Let's face it, markets can be swayed by sentiment & macroeconomic shifts over the short term, however, they eventually mean-revert over the very long term.
Let's face it, markets can be swayed by sentiment & macroeconomic shifts over the short term, however, they eventually mean-revert over the very long term.
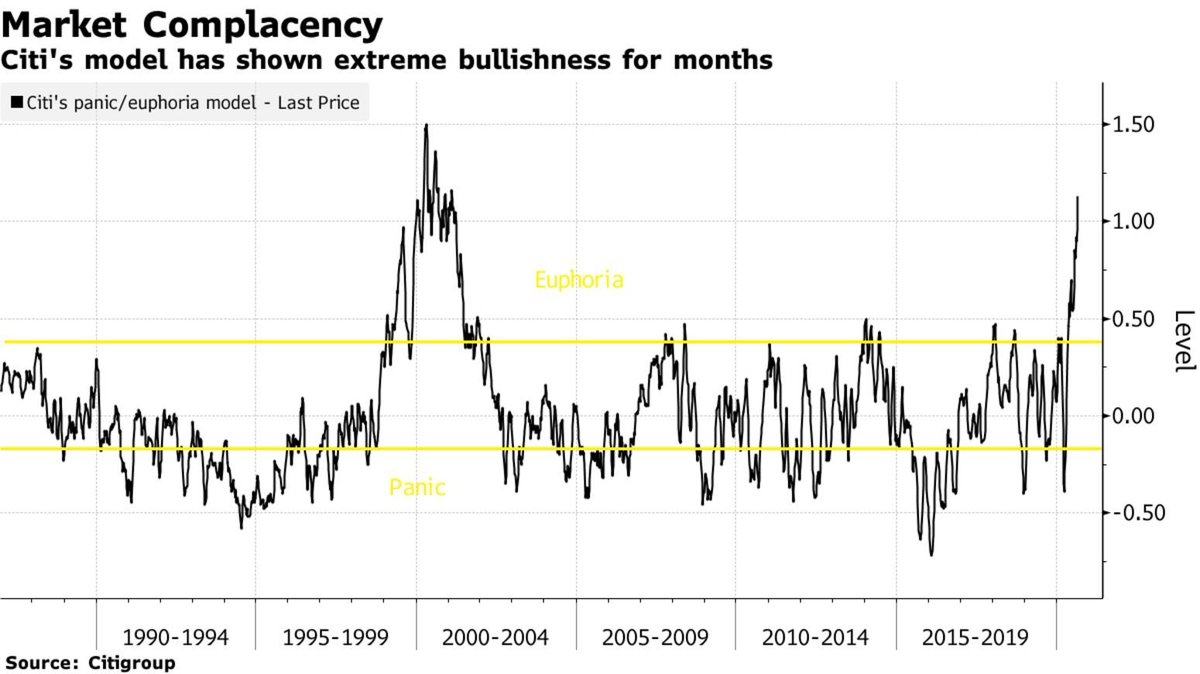
4/ One of the better indicators for gauging 12-month subsequent is the Citi's Panic/Euphoria sentiment & valuation gauge.
The chart below shows recent readings touched 1.2, which is the most euphoric since the late 1999 Tech Bubble.
The chart below shows recent readings touched 1.2, which is the most euphoric since the late 1999 Tech Bubble.
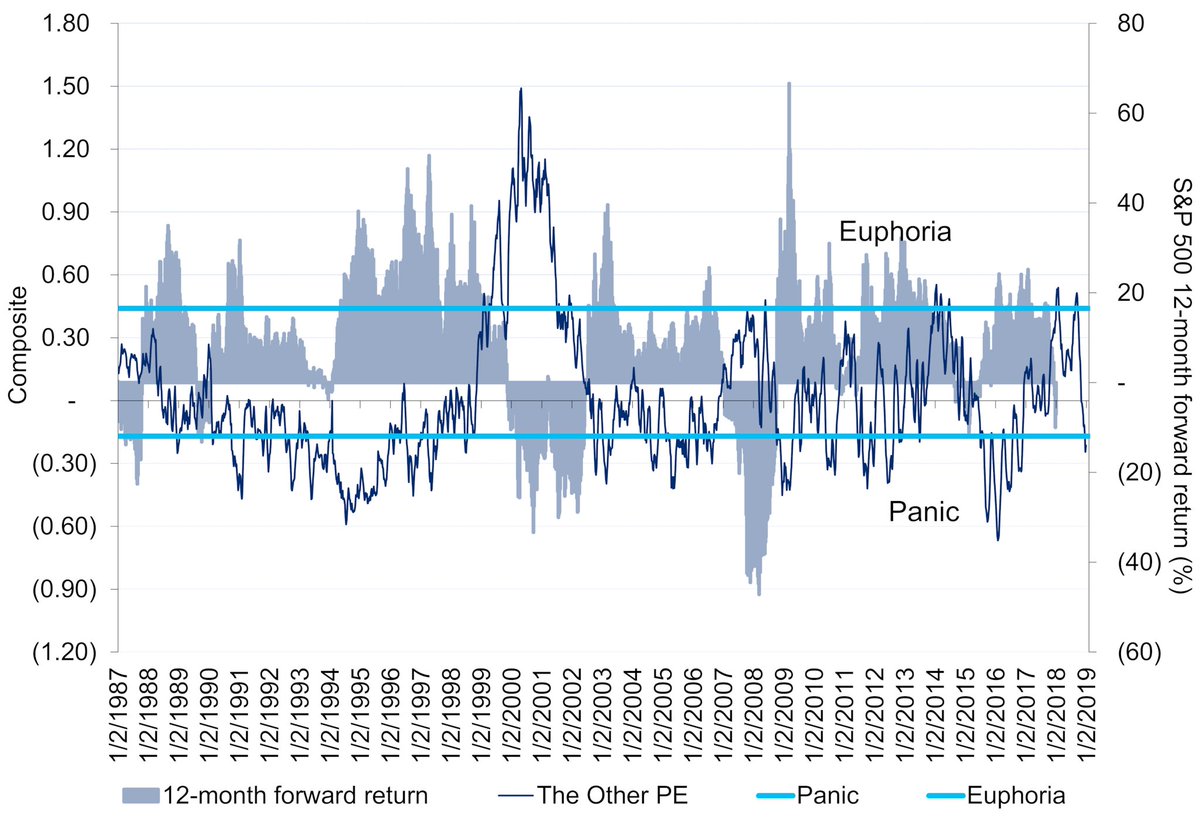
5/ Studying the gauge all the way back to its inception in 87, we notice that periods of panic produced positive future 12-month returns,
while periods of euphoria in 2007, 14, 18 & especially in 99/2000 period produced subsequent negative returns.
(outdated chart below)
while periods of euphoria in 2007, 14, 18 & especially in 99/2000 period produced subsequent negative returns.
(outdated chart below)
6/ Placing such evidence together with other signals showing high levels of speculation & parabolic blow-off tops in many of the FANG stocks,
In my humble opinion, the probability is above average to see the next 12 months produce negative returns.
In my humble opinion, the probability is above average to see the next 12 months produce negative returns.
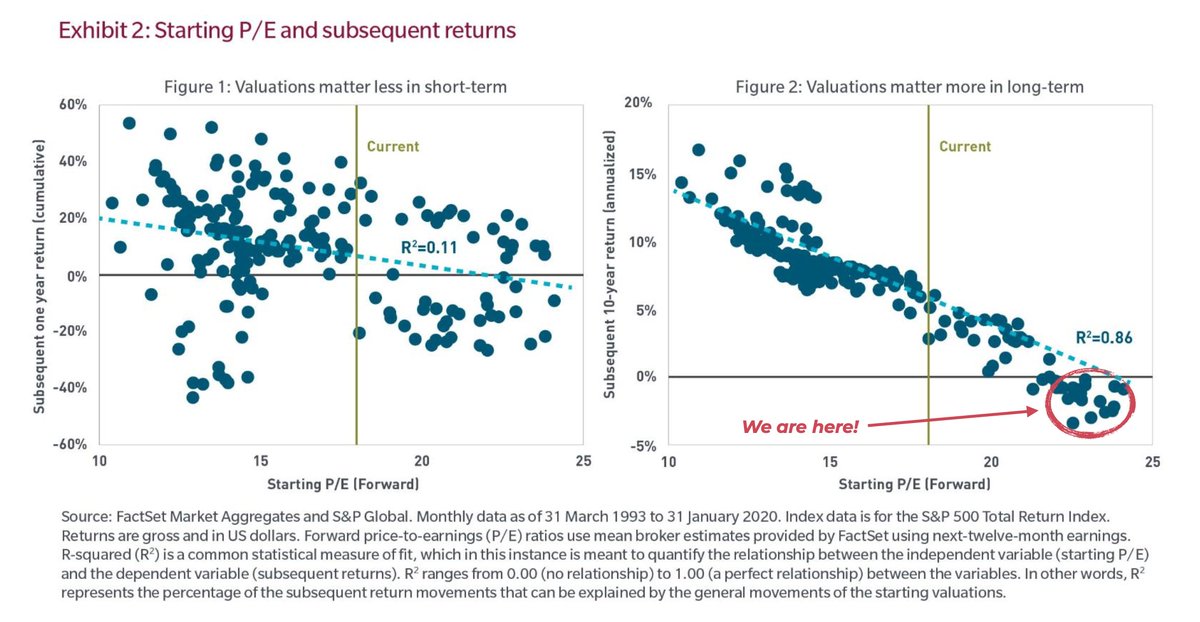
7/ Where things start to look interesting is once we begin anticipating probabilities for 5-year and 10-year future returns.
Current classic stock market valuations, measured either on forward or trailing basis, are overstretched without a doubt.
Forward P/E is now at 23 times.
Current classic stock market valuations, measured either on forward or trailing basis, are overstretched without a doubt.
Forward P/E is now at 23 times.
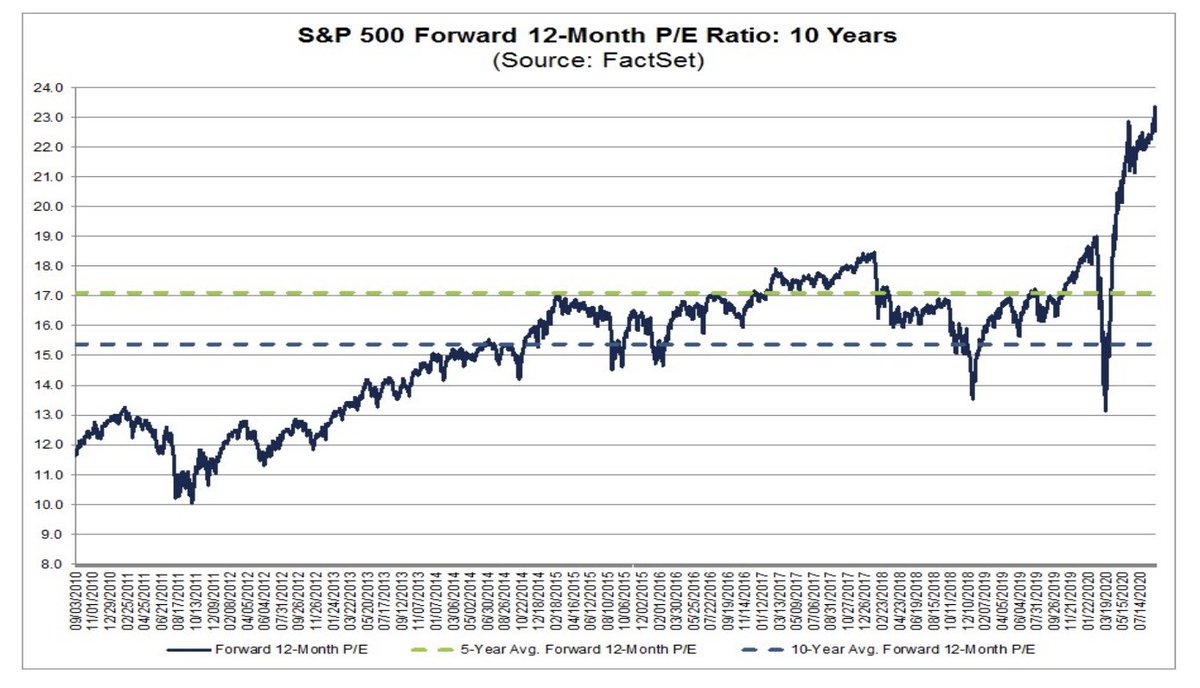
8/ As I was mentioning earlier, stock prices are a lot more random in the short term, therefore current P/E level has not been a major risk to investors so far.
However, at almost 23X multiple, probabilities are high that by 2025/26 we might see flat to negative returns (chart).
However, at almost 23X multiple, probabilities are high that by 2025/26 we might see flat to negative returns (chart).
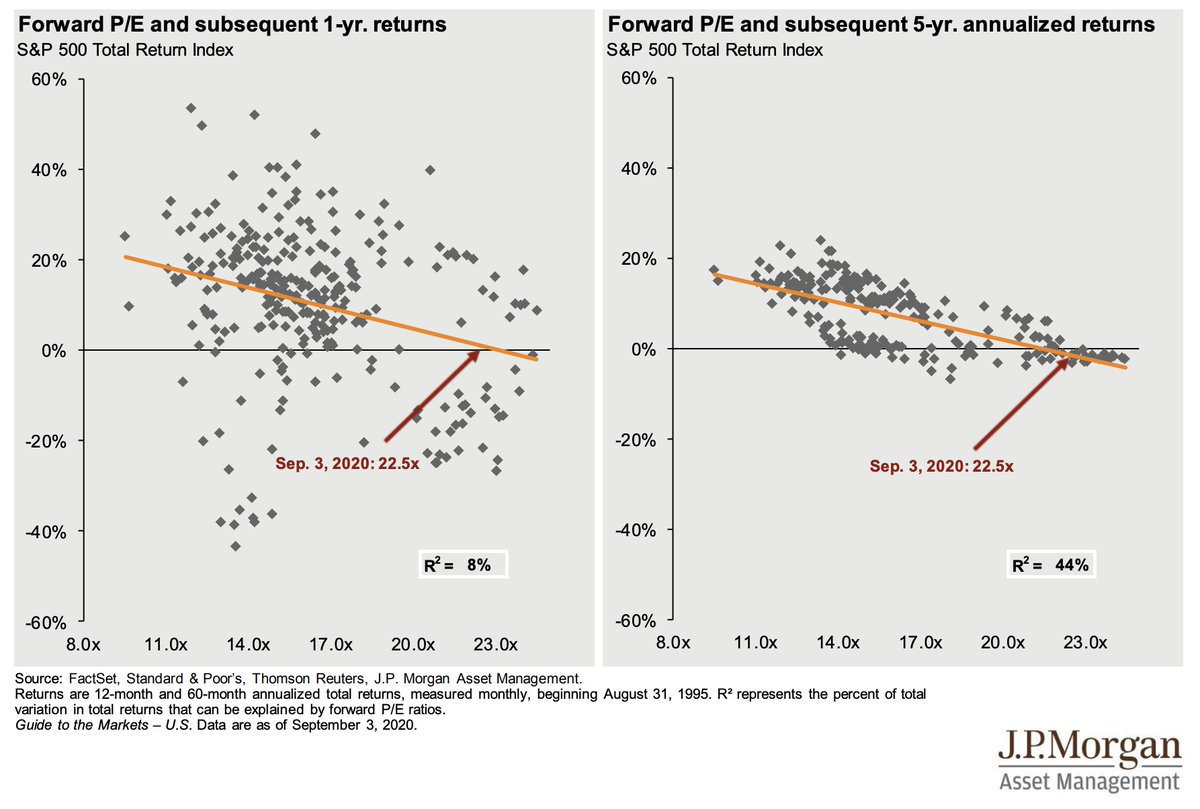
9/ Once you look even further out, more than a 5-year time frame, the forward P/E multiple has even better forecasting success.
Historically, overpriced markets have delivered poor & disappointing long term returns.
Historically, overpriced markets have delivered poor & disappointing long term returns.
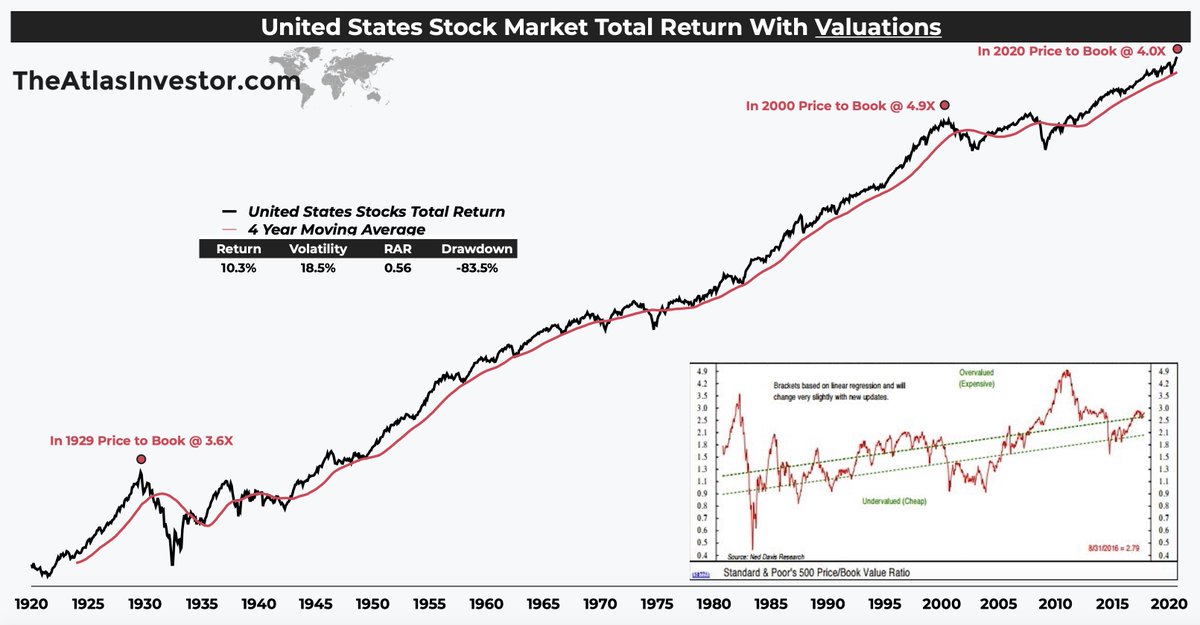
10/ Price to book valuation has "benched" by Wall Street because companies book has more & more intangible assets.
Nevertheless, I wanted to share this VERY long term chart with you showing the ratio at the 3 most overvalued times in history:
1929 @ 3.6X
2000 @ 4.9X
2020 @ 4.0X
Nevertheless, I wanted to share this VERY long term chart with you showing the ratio at the 3 most overvalued times in history:
1929 @ 3.6X
2000 @ 4.9X
2020 @ 4.0X
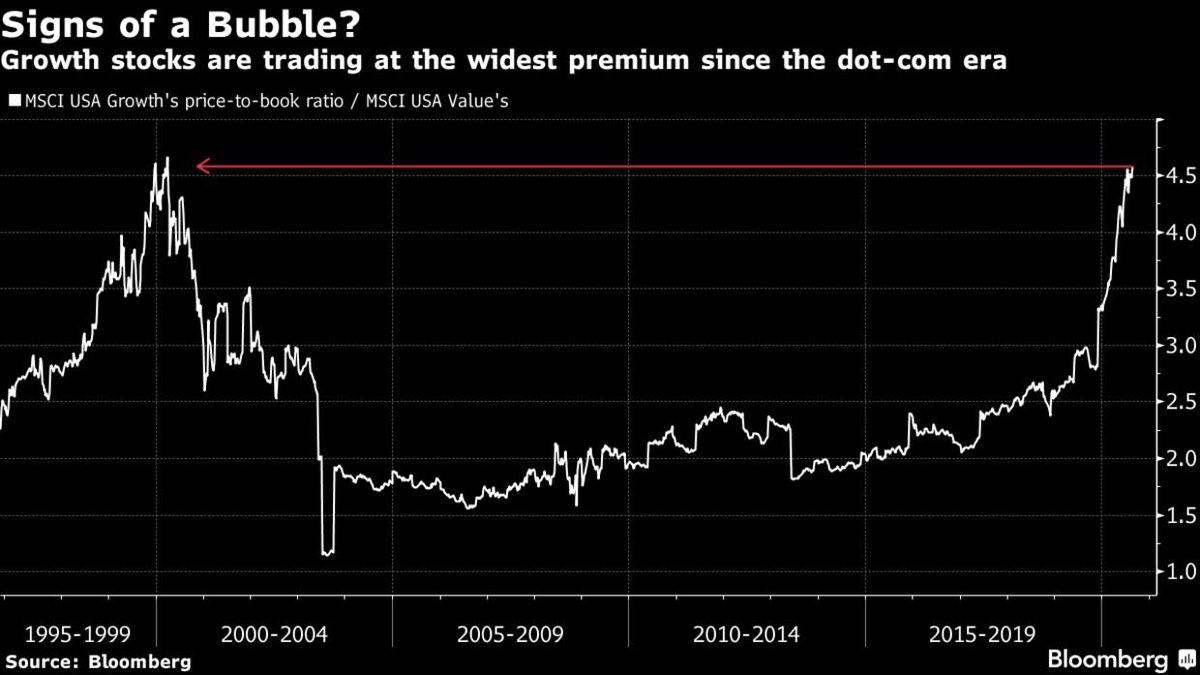
11/ Bloomberg shared an interesting chart showing US growth vs the US value price to book ratio difference... and it has striking similarities to the Tech bubble of the late 1990s.
Nevertheless, investors always think it is different this time.
Nevertheless, investors always think it is different this time.
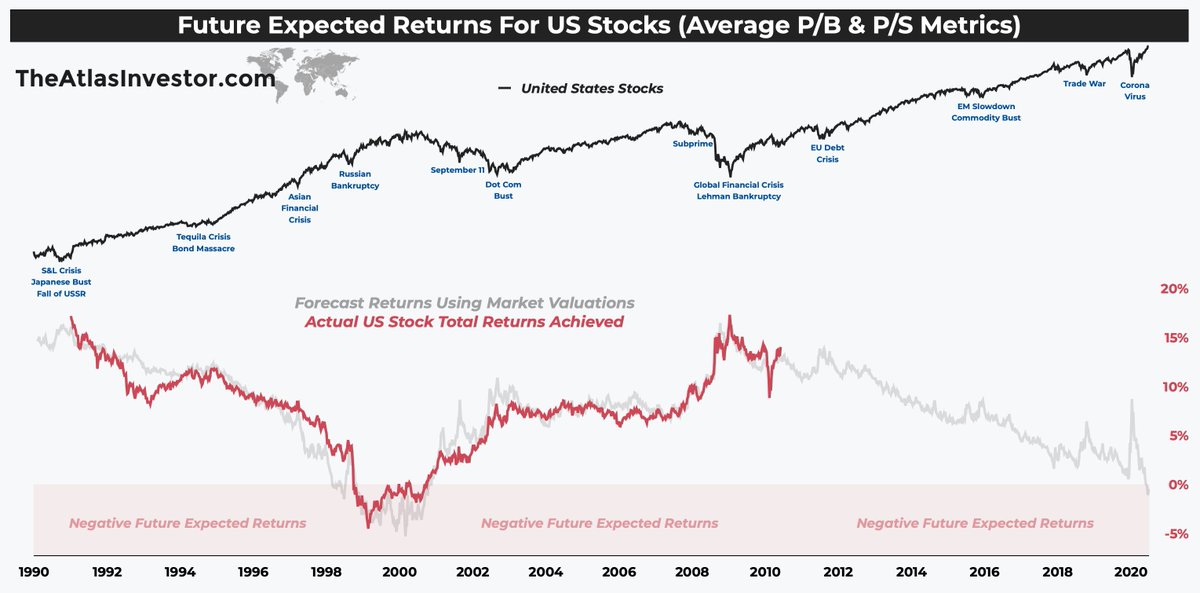
12/ I've combined P/B indicator together with price to forward sales ratio, averaged the two out, and you got a pretty accurate 10-year future expected return.
And for the US large caps, it is currently flashing negative for the first time since the year 2000.
And for the US large caps, it is currently flashing negative for the first time since the year 2000.
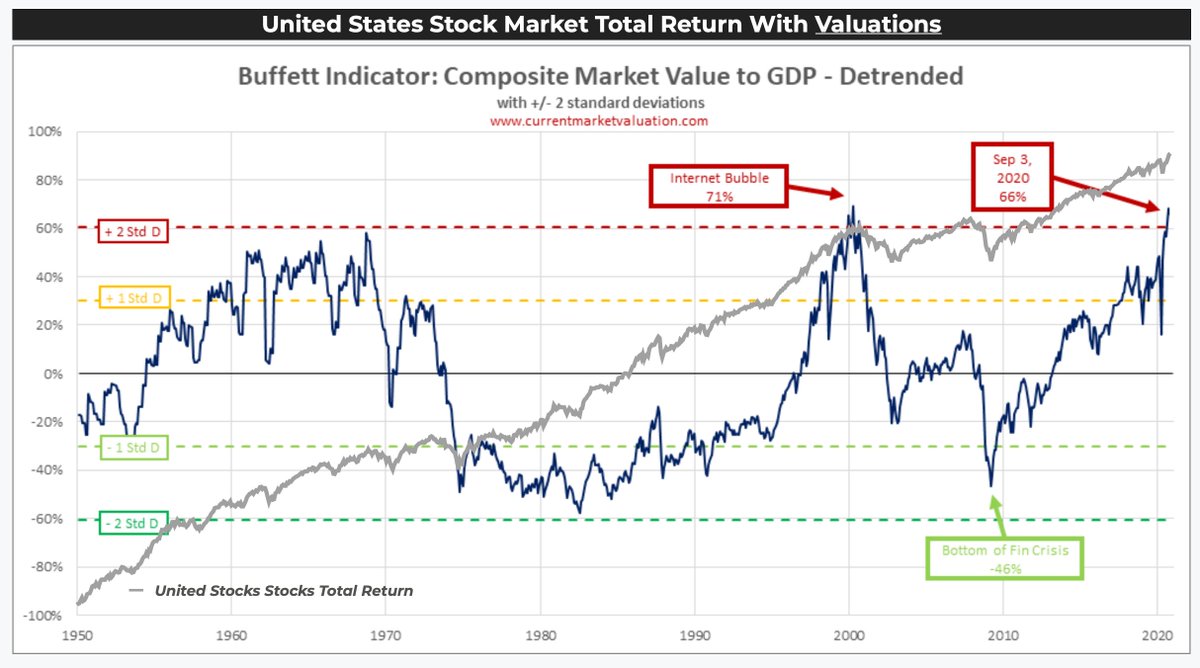
13/ However, the indicator that really stands out is Buffett's valuation gauge (de-trended market cap vs GDP). Three dates stand out here:
• 1968 @ 59%, followed by lost decade of the 70s
• 2000 @ 71%, followed by lost decade of the 2000s
• 2020 @ 69%, what comes next?
• 1968 @ 59%, followed by lost decade of the 70s
• 2000 @ 71%, followed by lost decade of the 2000s
• 2020 @ 69%, what comes next?
14/ Citi's sentiment gauge, which has a solid track record, is forecasting negative returns in 2021/22.
The forward P/E is forecasting flat to negative returns in 2025-28.
However, valuations gauge predictability success raises the further out we look, especially 10 years plus.
The forward P/E is forecasting flat to negative returns in 2025-28.
However, valuations gauge predictability success raises the further out we look, especially 10 years plus.
15/ The US stock market has gone through lost decades before & it could happen again.
Has it already started or is it just around the corner? I don't know.
However, passive investors' assumptions that buy & hold is the holy grail of easy retirement might be challenged.
Has it already started or is it just around the corner? I don't know.
However, passive investors' assumptions that buy & hold is the holy grail of easy retirement might be challenged.
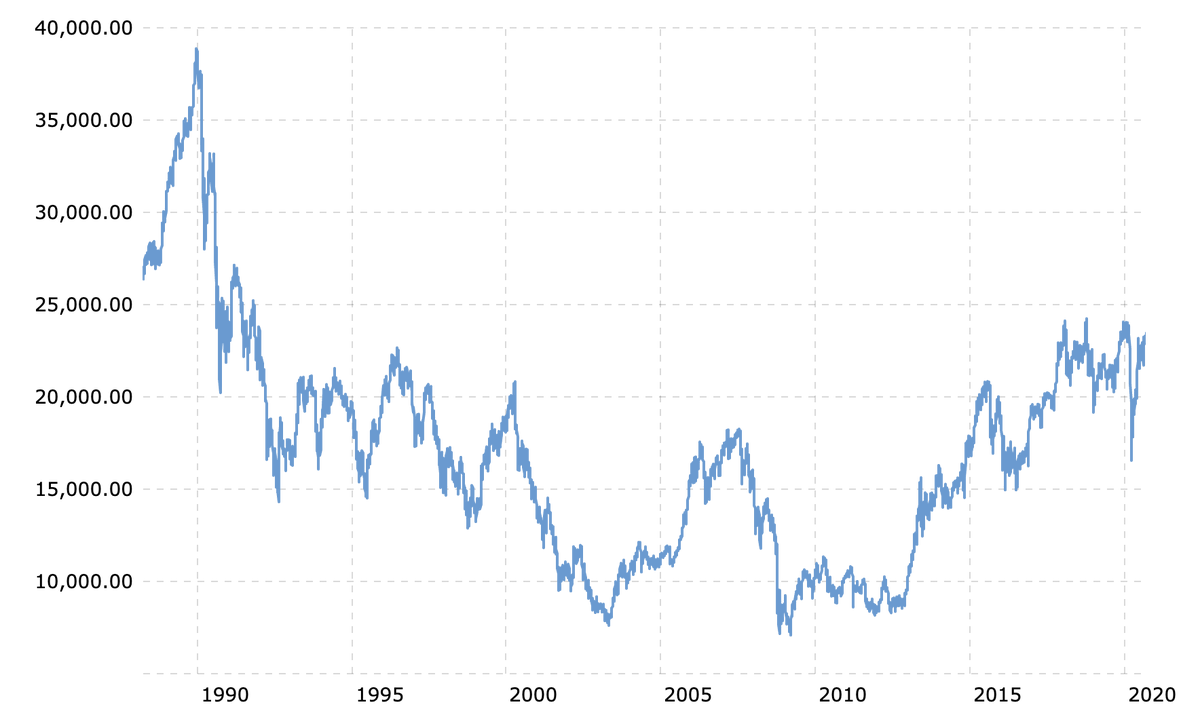
16/ Other wealthy countries around the world, from Japan to Britain, and from Hong Kong to France are currently going through these "dead money" periods.
Let us remember, the Japanese stock market peaked close to 40,000 points in 1990 and has been dead for three decades.
Let us remember, the Japanese stock market peaked close to 40,000 points in 1990 and has been dead for three decades.
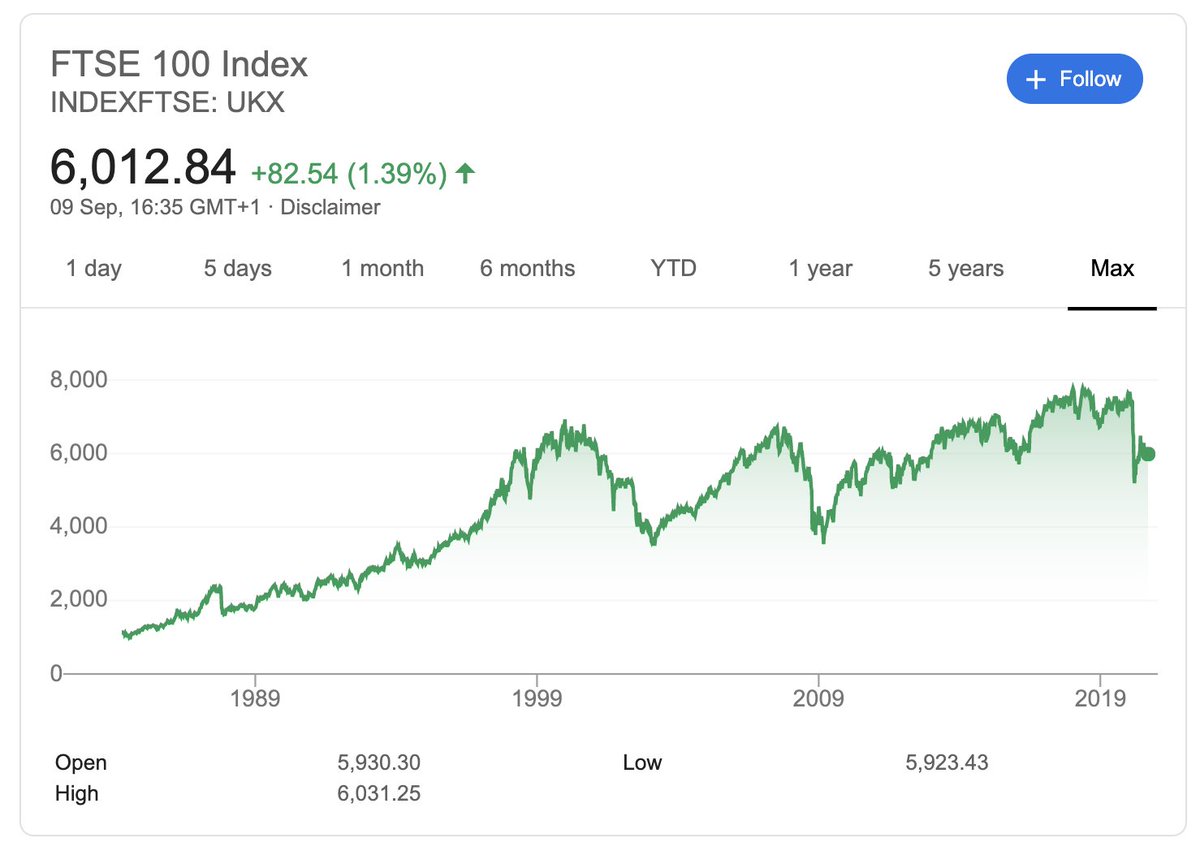
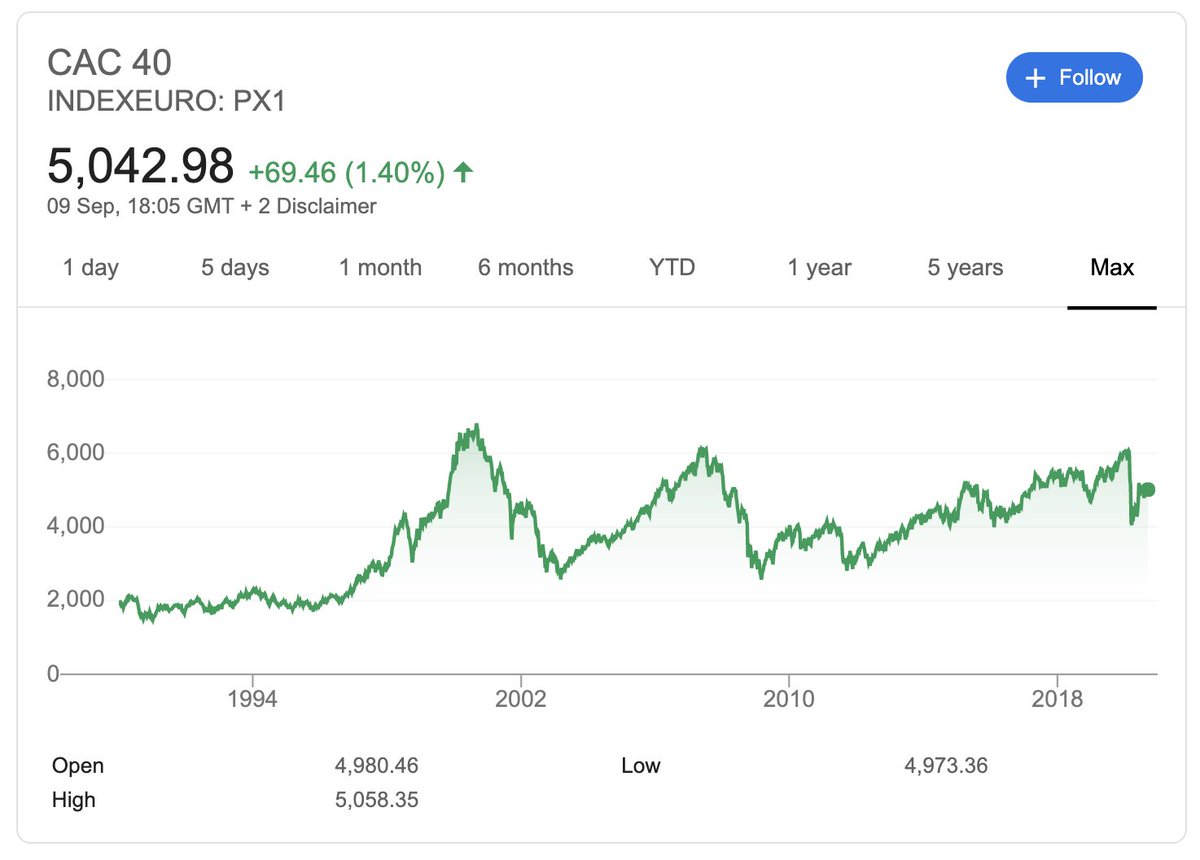
17/ Furthermore, the EU & UK stock markets peaked between 1998-2000 period (depending on which index we look at) & have been dead money for over two decades.
The charts below are the British FTSE 100 & the French CAC 40 indices.
The charts below are the British FTSE 100 & the French CAC 40 indices.
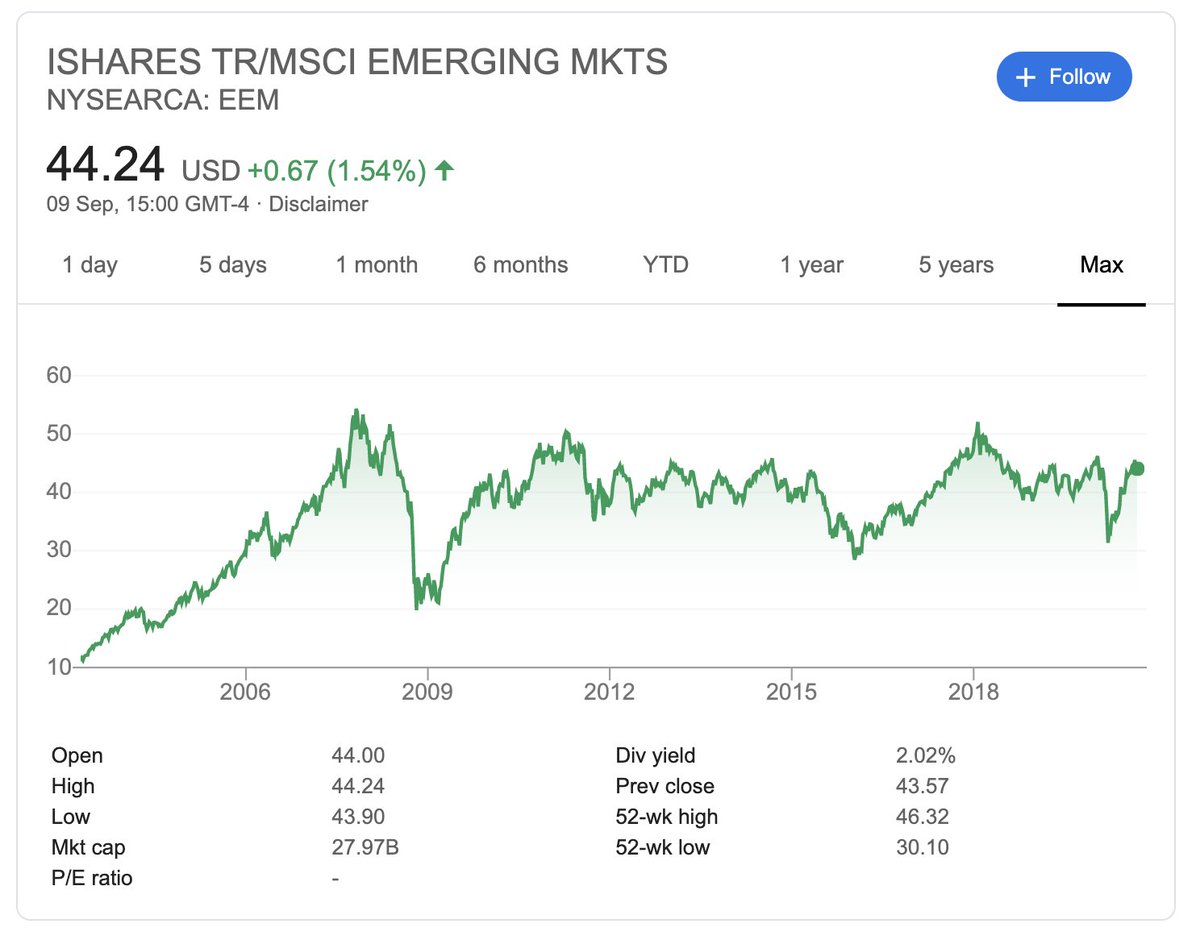
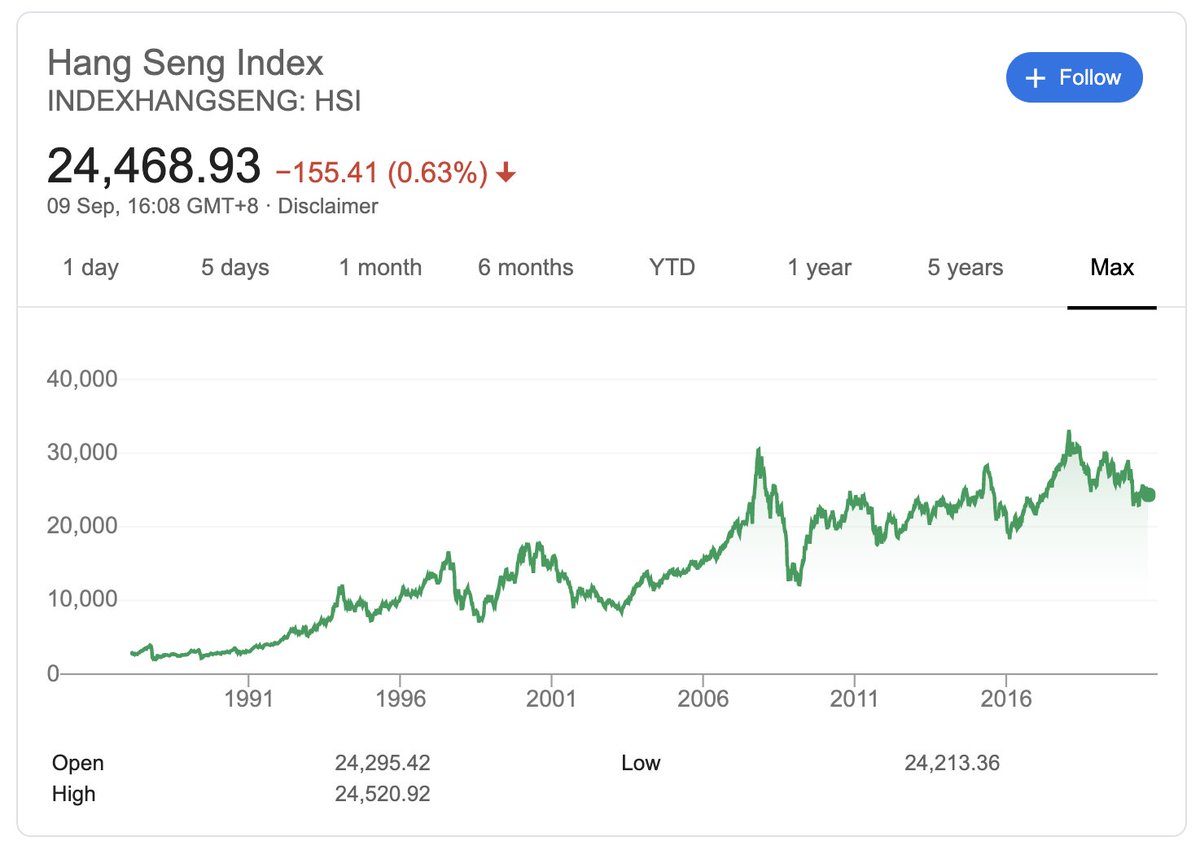
18/ Finally, let us glance at the Emerging Markets ETF as well as the Hang Seng Index.
Both of these markets give one a very broad Asian exposure — the fastest-growing region for some time now.
And yet, both of them are dead money for 13 years, since 2007.
Both of these markets give one a very broad Asian exposure — the fastest-growing region for some time now.
And yet, both of them are dead money for 13 years, since 2007.
19/ Of course, US investors think this could never happen to their own equity market — which has been outperforming the rest of the world.
After all, the US is an epicenter of innovation, with its market overweighting tech giants like Amazon, Apple, Microsoft & several others.
After all, the US is an epicenter of innovation, with its market overweighting tech giants like Amazon, Apple, Microsoft & several others.
• • •
Missing some Tweet in this thread? You can try to
force a refresh


