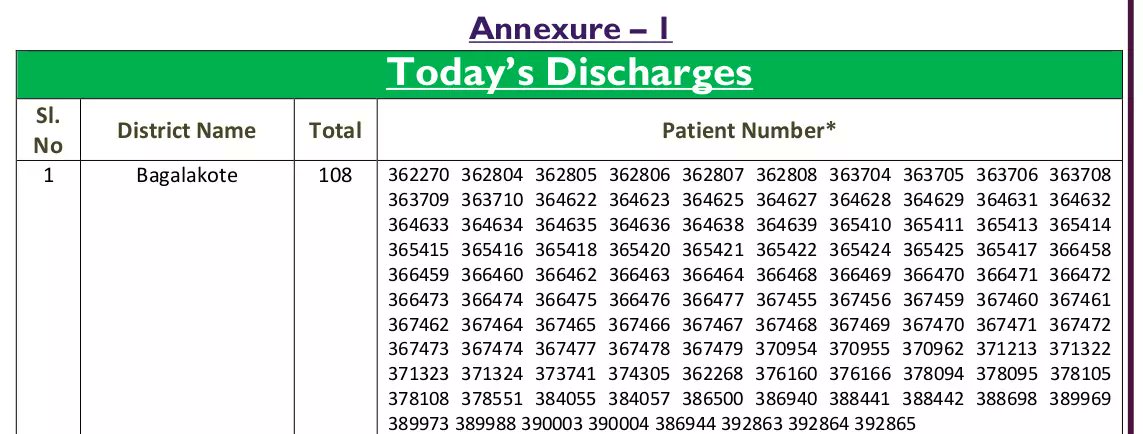
Karnataka provides very detailed information on all its discharges and deaths in its daily bulletin
I scraped that data (from Jul-14 to Sep-10), and this thread contains a detailed analysis #CoronavirusInIndia

I scraped that data (from Jul-14 to Sep-10), and this thread contains a detailed analysis #CoronavirusInIndia
https://twitter.com/DHFWKA/status/1304052909156360192
This follows the pattern of Odisha's analysis, but is more detailed
To avoid clutter, the following conventions are used
KAR: Karnataka (all districts)
BLR: Bengaluru
ROK: Rest of Karnataka
To avoid clutter, the following conventions are used
KAR: Karnataka (all districts)
BLR: Bengaluru
ROK: Rest of Karnataka
https://twitter.com/shananalla/status/1303732435272650755
DISCHARGES:
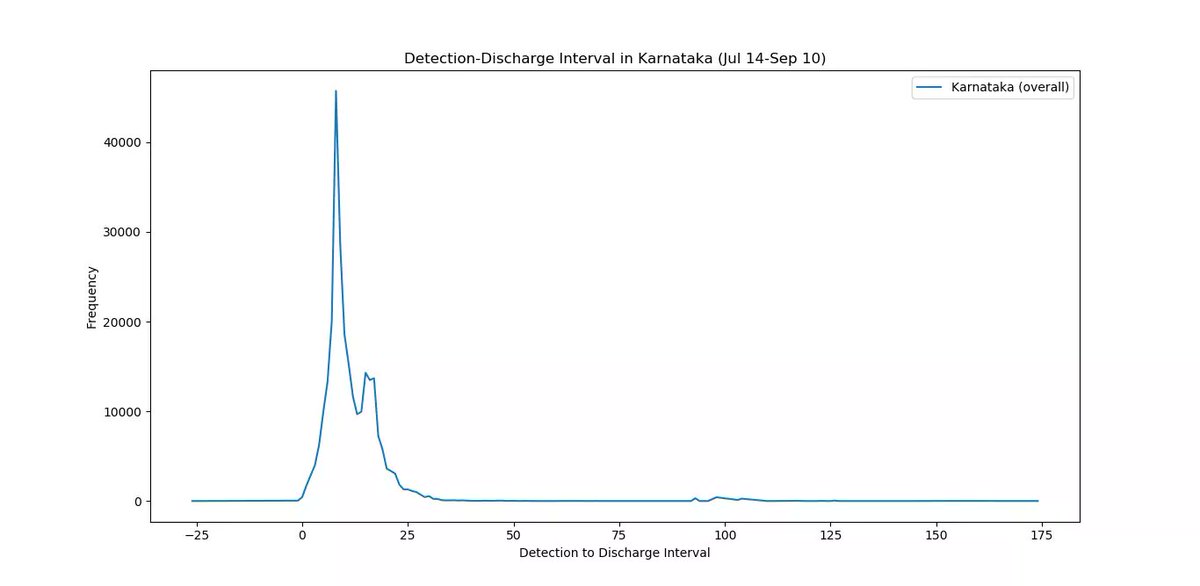
From the Patient no.,we can calculate the date of confirmation. This allows us to estimate the interval between Confirmation-Discharge
- Distribution is bimodal (2 peaks)
- Peak at ~7 days (due to mild/asymp.)
- Peak at 14-16 days (due to severe/symp. )
From the Patient no.,we can calculate the date of confirmation. This allows us to estimate the interval between Confirmation-Discharge
- Distribution is bimodal (2 peaks)
- Peak at ~7 days (due to mild/asymp.)
- Peak at 14-16 days (due to severe/symp. )
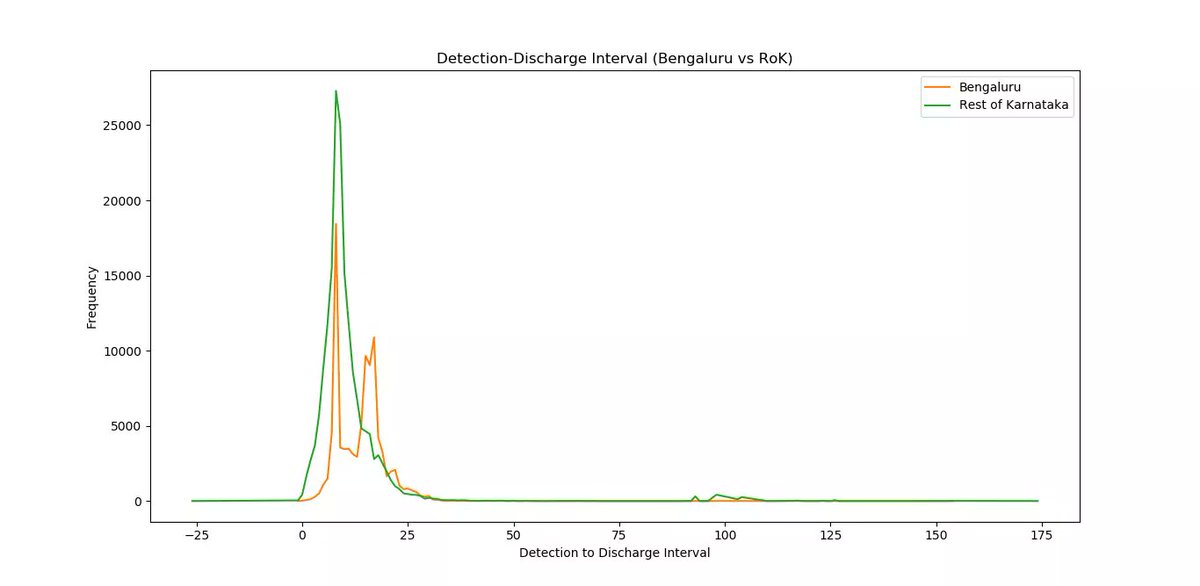
BLR vs ROK:
- 2nd peak very pronounced for BLR compared to ROK
=> Proportion of severe patients is significantly higher in BLR
- 2nd peak very pronounced for BLR compared to ROK
=> Proportion of severe patients is significantly higher in BLR
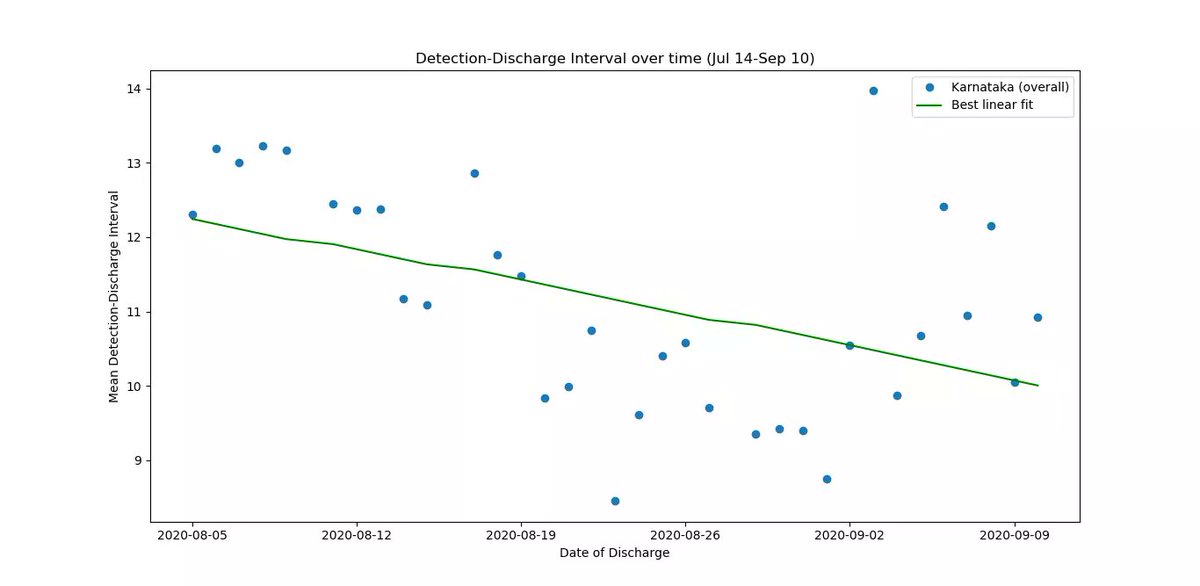
How has this changed over time:
mean values:
Sep: 11.1 days
Aug: 10.8 days
- Lower interval implies (proportionately) fewer severe patients
- Early positive sign in slight down-slope of Linear fit
- Need more data from Sep to conclusively prove improvement
mean values:
Sep: 11.1 days
Aug: 10.8 days
- Lower interval implies (proportionately) fewer severe patients
- Early positive sign in slight down-slope of Linear fit
- Need more data from Sep to conclusively prove improvement
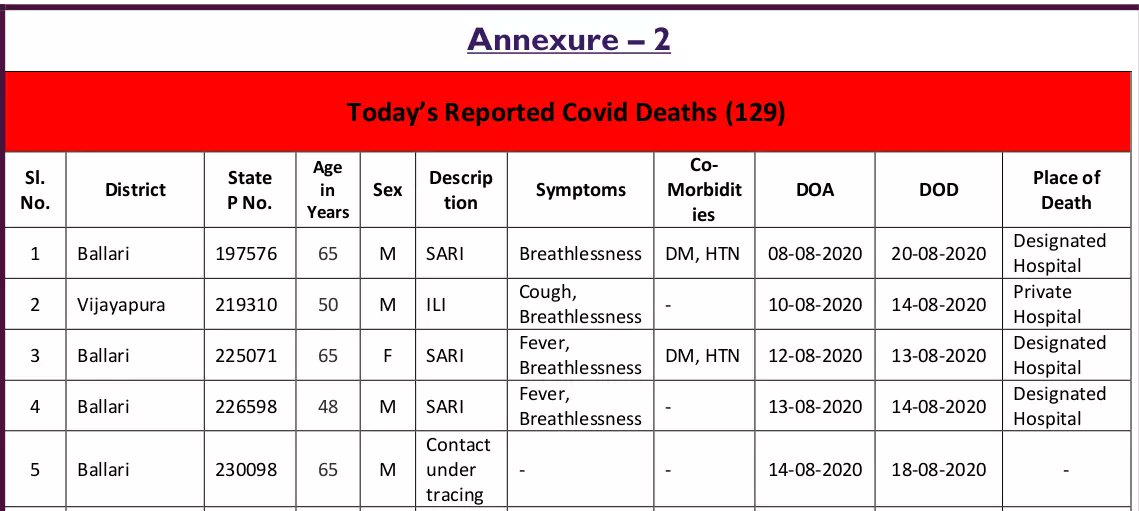
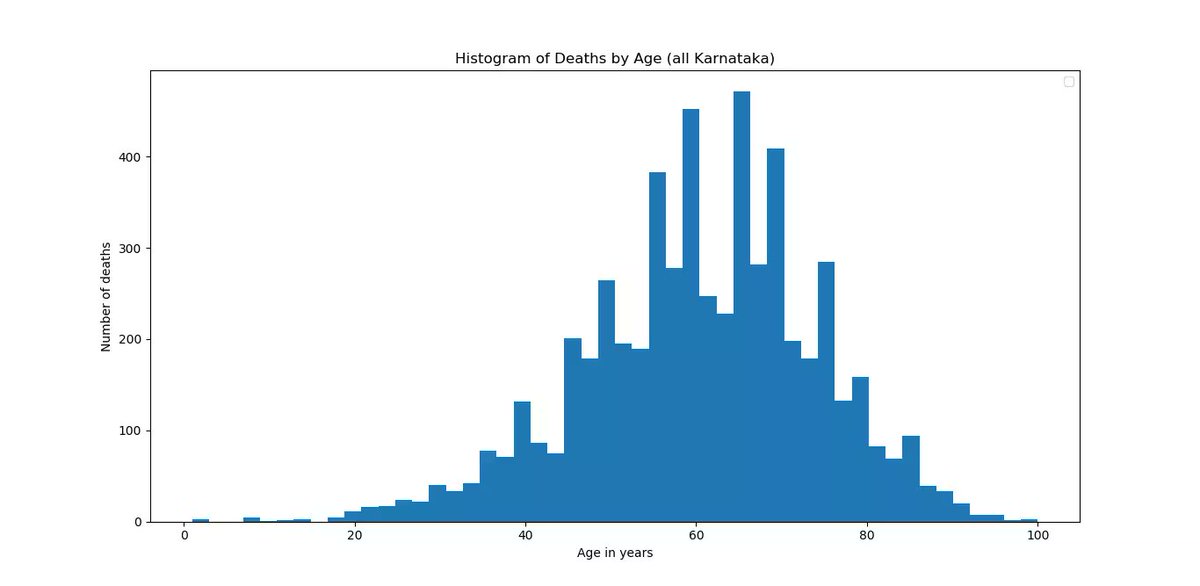
DEATHS:
Age-profile:
Mean value
KAR: 60.7 yrs
BLR: 60.1
RoK: 70
Age-profile:
Mean value
KAR: 60.7 yrs
BLR: 60.1
RoK: 70
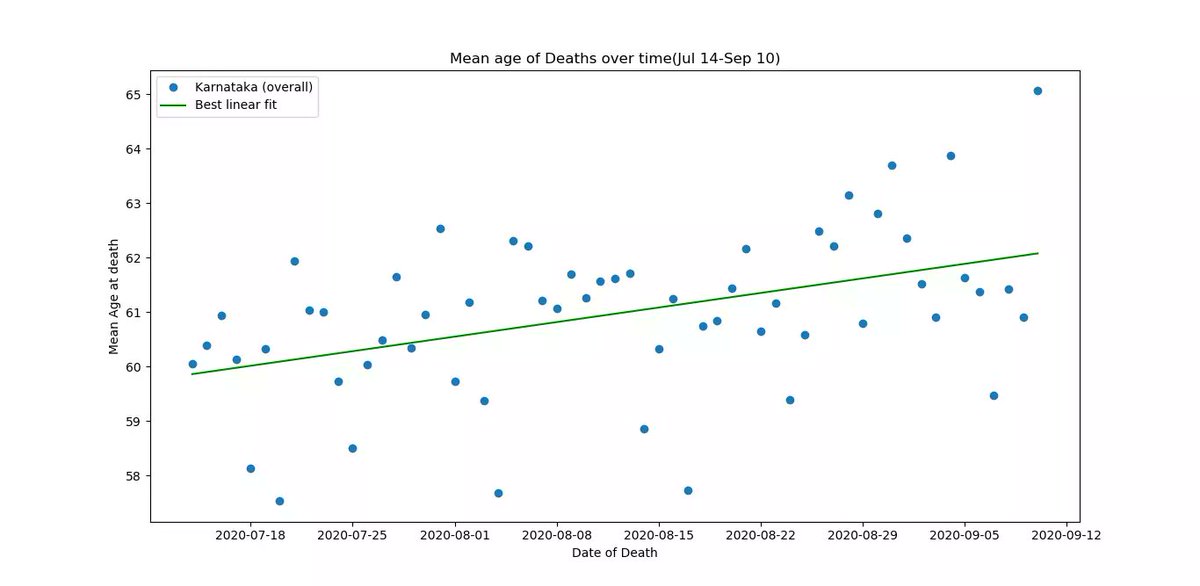
Over time:
KAR:
sep: 61.6 yrs
aug: 61.1
jul: 59.2
-Slow increase in mean age of death over time is similar to OD
KAR:
sep: 61.6 yrs
aug: 61.1
jul: 59.2
-Slow increase in mean age of death over time is similar to OD
https://twitter.com/shananalla/status/1303732954581970944
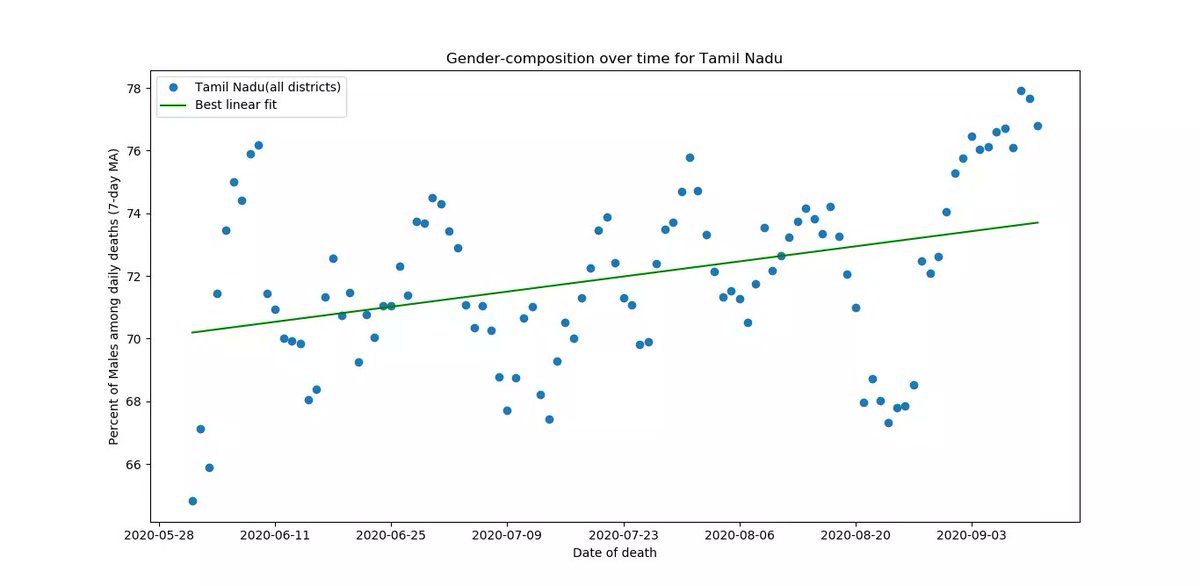
Gender Profile:
- Fatalities are overwhelmingly Male
KAR: 68.3% M , 31.7% F
BLR: 67.7% M , 32.3% F
ROK: 68.6% M , 31.4% F
Again, similar to OD
- Fatalities are overwhelmingly Male
KAR: 68.3% M , 31.7% F
BLR: 67.7% M , 32.3% F
ROK: 68.6% M , 31.4% F
Again, similar to OD
https://twitter.com/shananalla/status/1303732503195262976
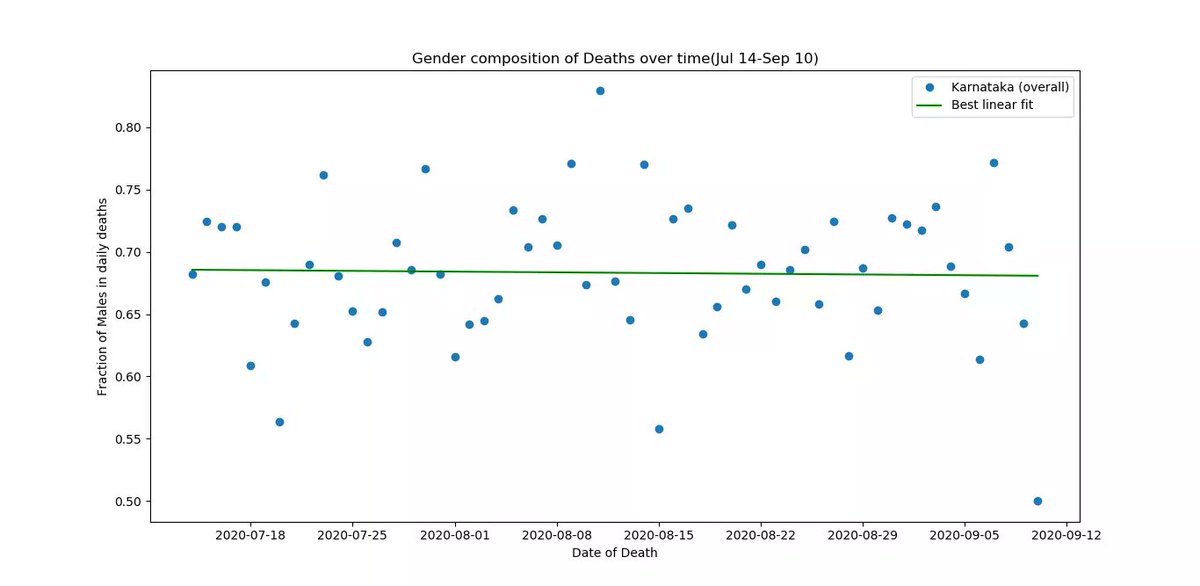
- The age-profile has'nt changed much over time (best fit is nearly flat)
Fraction of Males among a certain date's fatalities is plotted (best fit is nearly flat)
Fraction of Males among a certain date's fatalities is plotted (best fit is nearly flat)
- Mean age of fatalities is practically identical across genders
M: 60.8
F: 60.4
Again similar to OD
M: 60.8
F: 60.4
Again similar to OD
https://twitter.com/shananalla/status/1303733283398664192
CO-MORBIDITIES
27.5% had NO Comorbidities
72.5% had Comorbidities
-Co-morbidities(especially DM and HTN) very often occur together in the same patients
27.5% had NO Comorbidities
72.5% had Comorbidities
-Co-morbidities(especially DM and HTN) very often occur together in the same patients
https://twitter.com/shananalla/status/1303733435345690624
Common Comorbidities
Diabetes: 39.2%
Hypertension: 38.1%
Heart Disease: 8.9%
Kidney Disease:5.6%
COPD: 1.8% (??)
(Doctors,what is COPD?)
Diabetes: 39.2%
Hypertension: 38.1%
Heart Disease: 8.9%
Kidney Disease:5.6%
COPD: 1.8% (??)
(Doctors,what is COPD?)
https://twitter.com/shananalla/status/1303733671883542530

Number of co-morbidities among those who ]have them ( eg. Diabetes+Hypertension )
1 : 48%
2 : 39% (often DM and HTN)
3+: 13%
1 : 48%
2 : 39% (often DM and HTN)
3+: 13%
Proportion of those with no comorbidities
- v. slightly higher among women
M: 27.3%, F: 27.8%
- higher in ROK vs BLR
BLR: 21.9%
ROK: 30.2%
- In ROK larger share patients dying despite no co-morbidity
- v. slightly higher among women
M: 27.3%, F: 27.8%
- higher in ROK vs BLR
BLR: 21.9%
ROK: 30.2%
- In ROK larger share patients dying despite no co-morbidity
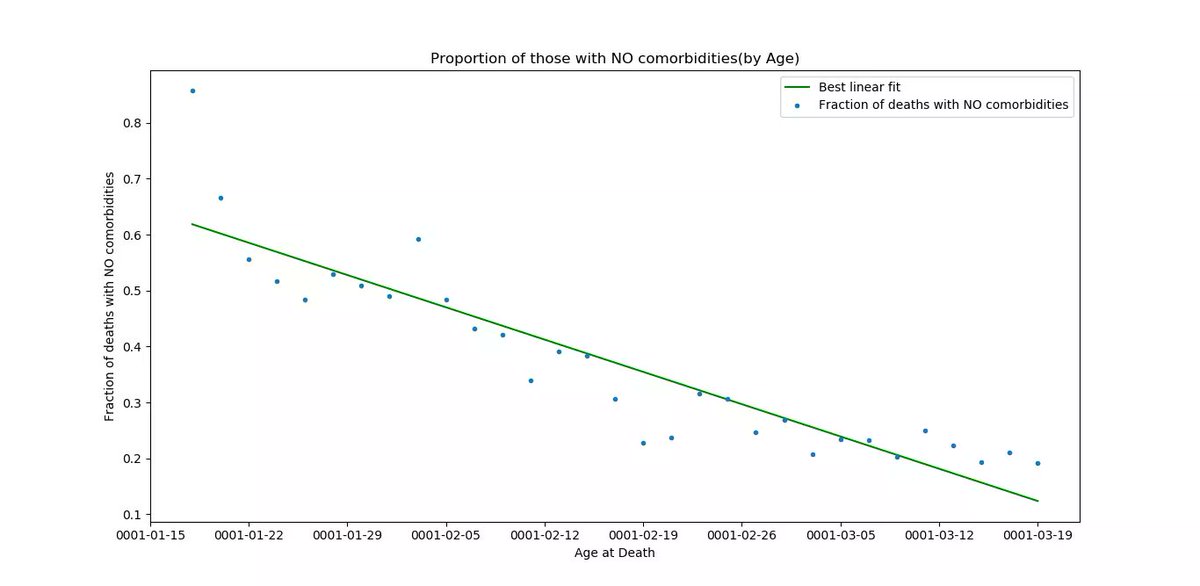
Percent of those with NO comorbidites by age
60+ : 21.8%
40-60: 30.2%
20-40: 50.9%
0-20: 82.1% (only 28 individuals)
As expected, young have fewer comorbidities
60+ : 21.8%
40-60: 30.2%
20-40: 50.9%
0-20: 82.1% (only 28 individuals)
As expected, young have fewer comorbidities
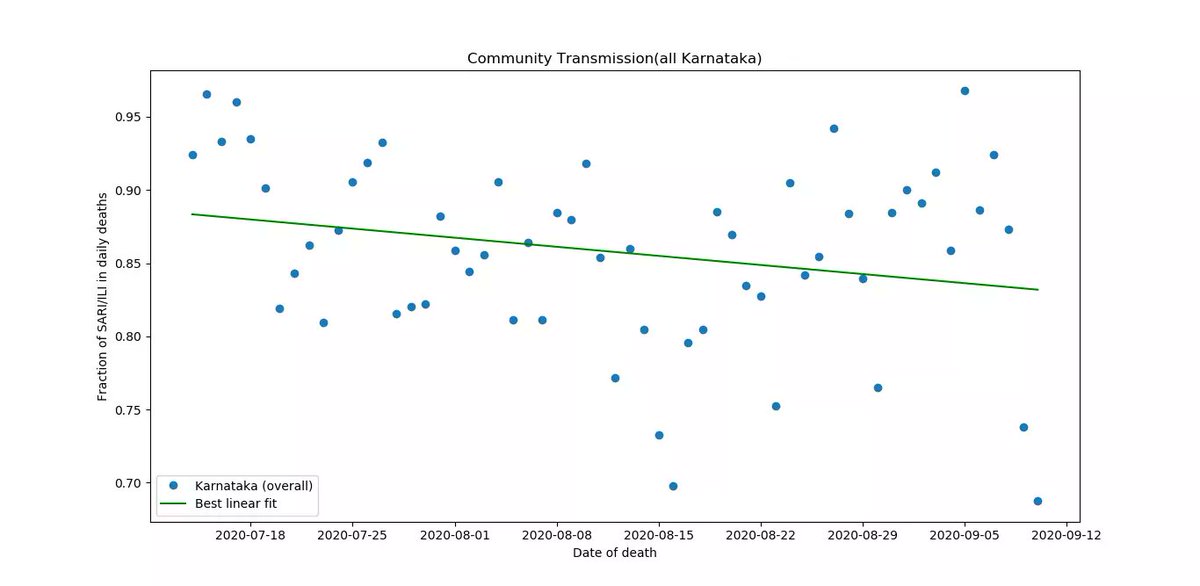
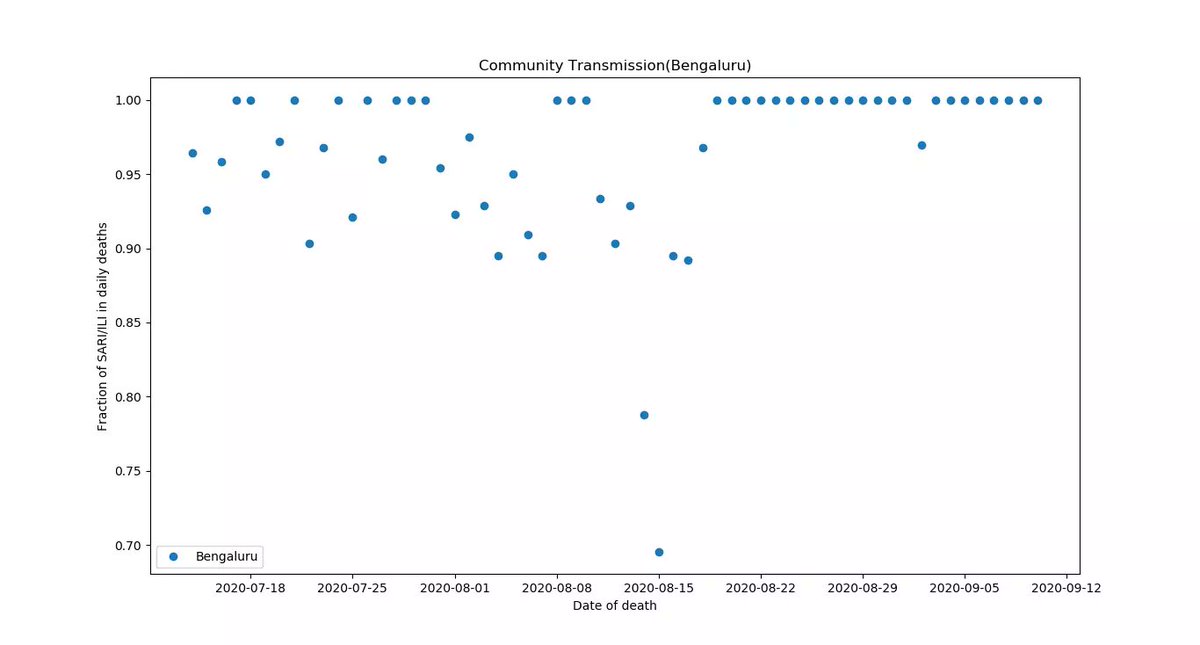
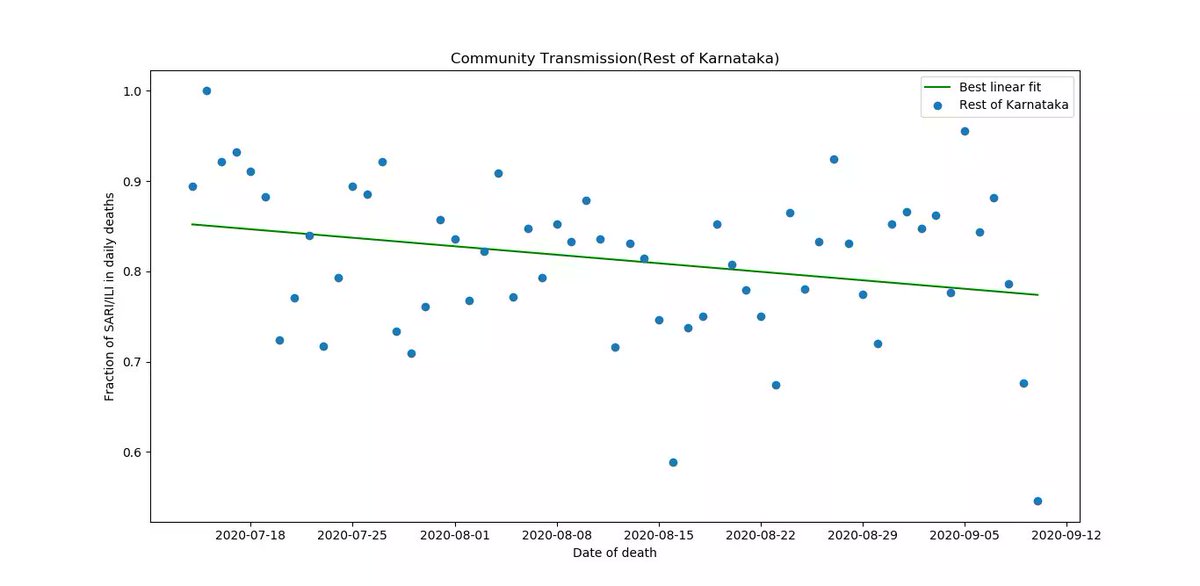
Origin (SARI/ILI/Contact)
- Fraction of SARI/ILI deaths among total(plotted) is a measure of community transmission
KAR: 86.3% deaths are SARI/ILI
BLR: 96.4%
ROK: 81.4%
- Fraction of SARI/ILI deaths among total(plotted) is a measure of community transmission
KAR: 86.3% deaths are SARI/ILI
BLR: 96.4%
ROK: 81.4%
- V. different picture in BLR vs ROK
- 100%(!!) of BLR's deaths since mid-August have been SARI/ILI
- A v. high fraction indicates that very few contacts(at least among fatalities) were traced
- 100%(!!) of BLR's deaths since mid-August have been SARI/ILI
- A v. high fraction indicates that very few contacts(at least among fatalities) were traced
- Lower fraction in ROK indicates containment may not be a lost cause there
- Early positive sign in slight down-slope of linear fit
- Early positive sign in slight down-slope of linear fit
admission-death interval
- A measure of quality/effectiveness of hospital care
Distribution is an exponential decay
Mean/Median (in days)
KAR: 4.4, 3
BLR: 4.7, 3
ROK: 4.3, 3
- higher value in BLR might indicate better availability of hospital care in BLR
- A measure of quality/effectiveness of hospital care
Distribution is an exponential decay
Mean/Median (in days)
KAR: 4.4, 3
BLR: 4.7, 3
ROK: 4.3, 3
- higher value in BLR might indicate better availability of hospital care in BLR
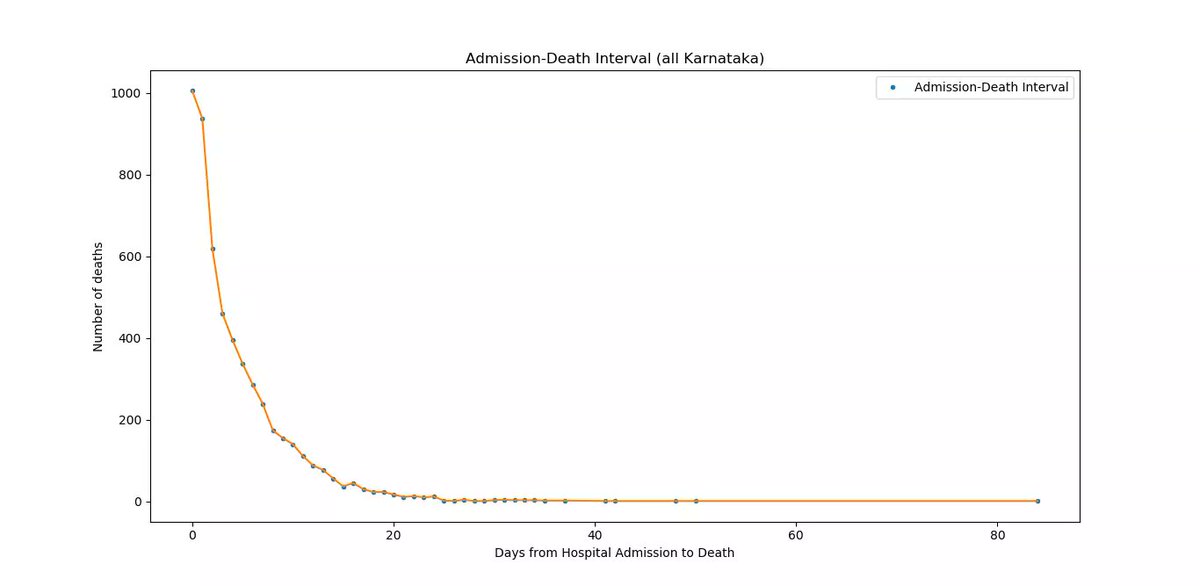
KAR Admission-Death Interval
Home deaths: 7.2% ( or brought dead to hospital)
0-2 days : 44.5%
3-7 days : 29.8%
8+ days : 18.3%
Home deaths: 7.2% ( or brought dead to hospital)
0-2 days : 44.5%
3-7 days : 29.8%
8+ days : 18.3%
over time:
KAR: (Mean/Median values)
Sep: 5.2,4.0 median
Aug: 4.6,3.0 median
Jul: 2.7,1.0 median
- Indicates things were v. bad in July, but patients are spending longer in hospitals in August-Sep
KAR: (Mean/Median values)
Sep: 5.2,4.0 median
Aug: 4.6,3.0 median
Jul: 2.7,1.0 median
- Indicates things were v. bad in July, but patients are spending longer in hospitals in August-Sep
v.different in BLR vs ROK
Mean,Median values
Sep: 6.2,4.0
Aug: 6.1,4.0
Jul: 2.0,1.0
- A lengthening interval in BLR indicates things in v. bad shape in July, but are improving since
Mean,Median values
Sep: 6.2,4.0
Aug: 6.1,4.0
Jul: 2.0,1.0
- A lengthening interval in BLR indicates things in v. bad shape in July, but are improving since
ROK:
Mean,Median values
Sep: 4.7,3.0
Aug: 4.1,3.0
Jul: 3.2,2.0
- Indicates The virus hasn't hit ROK hospitals as hard as BLR in July
Mean,Median values
Sep: 4.7,3.0
Aug: 4.1,3.0
Jul: 3.2,2.0
- Indicates The virus hasn't hit ROK hospitals as hard as BLR in July
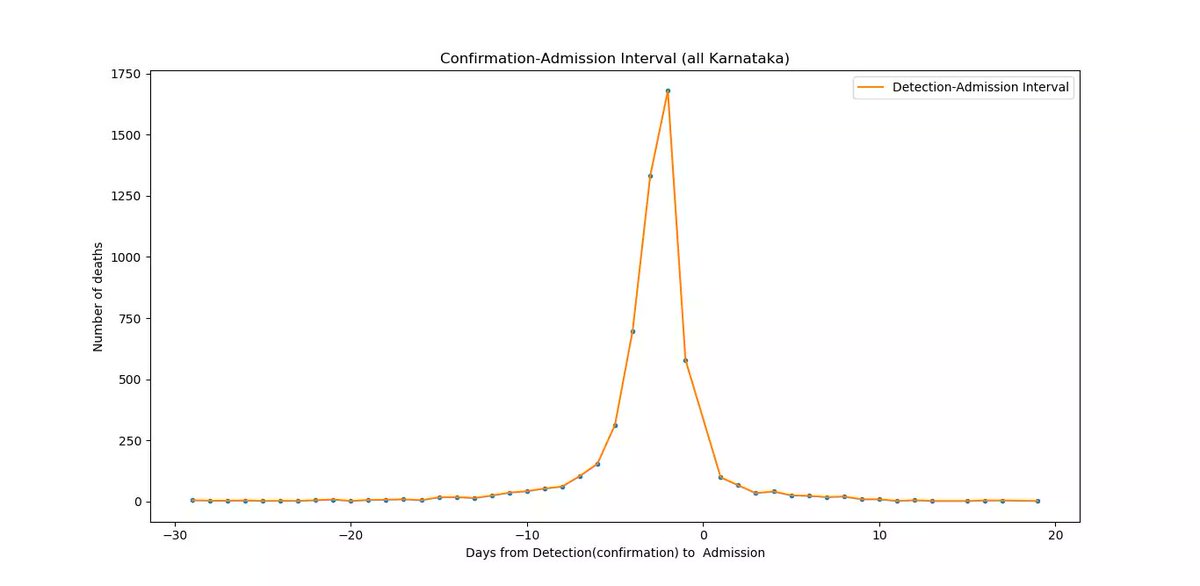
Confirmation-admission interval:
- Time between confirmation (in bulletin) and admission to hospital
Mean value
BLR: : -2.9 days (yes, its negative!)
ROK : -3 days
- v. sharp peak at -3 days
- i.e. most deaths were confirmed(in the bulletin) 3 days *after* admission
- Time between confirmation (in bulletin) and admission to hospital
Mean value
BLR: : -2.9 days (yes, its negative!)
ROK : -3 days
- v. sharp peak at -3 days
- i.e. most deaths were confirmed(in the bulletin) 3 days *after* admission
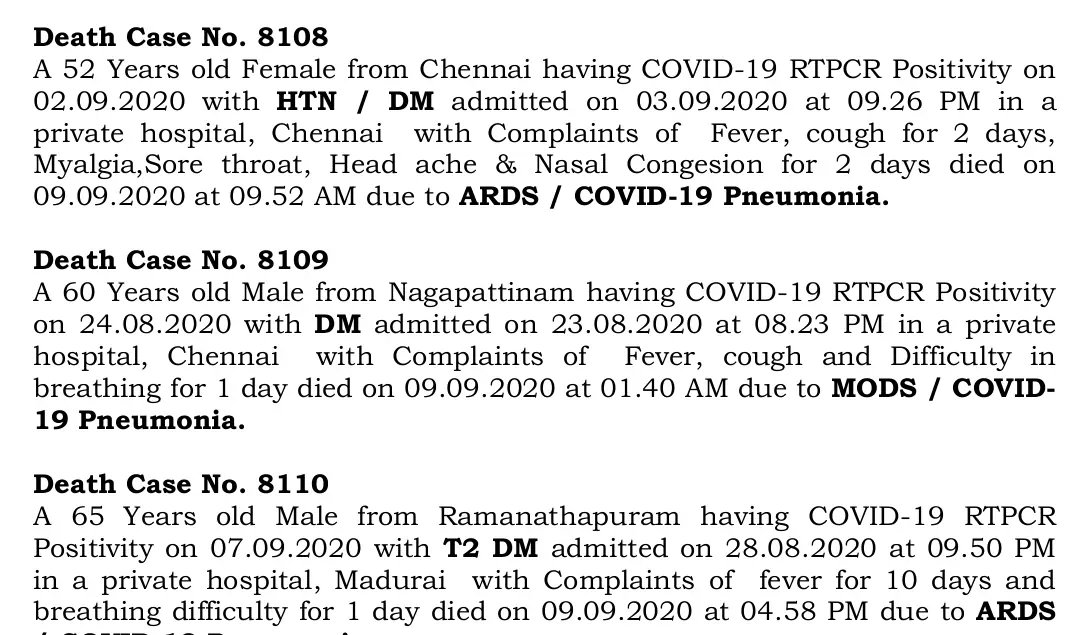
- Example:
P.51825 48-yr old Female from Mysuru died on 18 July
-she was detected on 17 Jul (1st is from the Jul-17 bulletin)
-but was admitted on 14 Jul, i.e. 3 days prior (2nd image is from July-19 bulletin)
P.51825 48-yr old Female from Mysuru died on 18 July
-she was detected on 17 Jul (1st is from the Jul-17 bulletin)
-but was admitted on 14 Jul, i.e. 3 days prior (2nd image is from July-19 bulletin)


over time:
Mean,median values (all Karnataka)
Sep: -2.2,-2 days
Jul: -2.8,-3 days
- Indicates patients are confirmed (tested +ve) sooner in Sep vs Jul. This is good.
Mean,median values (all Karnataka)
Sep: -2.2,-2 days
Jul: -2.8,-3 days
- Indicates patients are confirmed (tested +ve) sooner in Sep vs Jul. This is good.
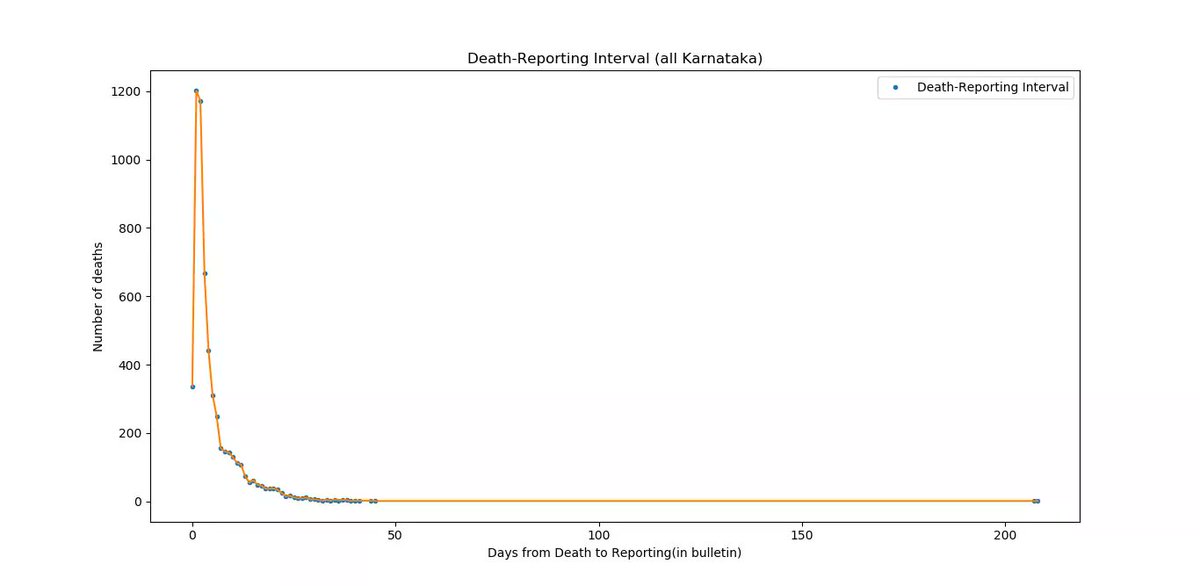
Death-Reporting interval:
- Lots of states(MH,DL etc) have reported deaths from "backlogs"
- Karnataka's data lets us evaluate its reporting backlog quantitatively
Mean,median
KAR: 5.1, 3 days
-Sharp peak around 2-3 days
-Small fraction reported on same days(interval=0)
- Lots of states(MH,DL etc) have reported deaths from "backlogs"
- Karnataka's data lets us evaluate its reporting backlog quantitatively
Mean,median
KAR: 5.1, 3 days
-Sharp peak around 2-3 days
-Small fraction reported on same days(interval=0)
over time
Mean,Median values
sep: 2.0,2
aug: 4.7,3
jul: 6.8,4
- Indicates the state's reporting systems was overwhelmed around July (v. long interval), but things have improved v. significantly since
Mean,Median values
sep: 2.0,2
aug: 4.7,3
jul: 6.8,4
- Indicates the state's reporting systems was overwhelmed around July (v. long interval), but things have improved v. significantly since
SUMMARY (Conclusions from the data)
Discharges:
- BLR discharge distribution(strong peak around 14-16 days) indicates BLR is mostly detecting severe/symp. cases
- ROK is detecting mostly mild/asymp. cases (single peak around 7 days)
Discharges:
- BLR discharge distribution(strong peak around 14-16 days) indicates BLR is mostly detecting severe/symp. cases
- ROK is detecting mostly mild/asymp. cases (single peak around 7 days)
Deaths:
- Fatalities are overwhelming old and male. This hasn't changed over time
- Most fatalities have co-morbidites (similar to OD)
- Fewer fatalities in BLR have co-morbidities (vs ROK)
- Younger have *far* fewer co-morbidities
- Fatalities are overwhelming old and male. This hasn't changed over time
- Most fatalities have co-morbidites (similar to OD)
- Fewer fatalities in BLR have co-morbidities (vs ROK)
- Younger have *far* fewer co-morbidities
- High fraction of SARI/ILI deaths indicates community transmission is well-established since July(especially in BLR)
- In July patients(especially in BLR) died very soon after admission (~1 day). This has improved to >6 days in Sep.
- In July patients(especially in BLR) died very soon after admission (~1 day). This has improved to >6 days in Sep.
- Most patients are confirmed *after* being admitted (typically 2-3 days later)
- Deaths are typically reported(in bulletin) 2-3 days after they occur
- Deaths are typically reported(in bulletin) 2-3 days after they occur
Kudos to Karnataka for providing such detailed data in its bulletin. If other states provided even half as much information, we'd know a lot more about India's epidemic @epigiri
-Source code for parsing and analysis is at github.com/grill05/covid1…
- Raw data on KAR's fatalities (csv format) is at github.com/grill05/covid1…
- For convenience an archive of all the raw PDF bulletins is at drive.google.com/open?id=13Qrgv…
- Raw data on KAR's fatalities (csv format) is at github.com/grill05/covid1…
- For convenience an archive of all the raw PDF bulletins is at drive.google.com/open?id=13Qrgv…
https://twitter.com/shananalla/status/1303733966495576066
@epigiri @anupampom @muradbanaji @rijomjohn @amitsurg @giridar100 @menonbiophysics @oommen @rukmini @covid19indiaorg @spacem0nk3y @countthedead @ShamikaRavi @BhramarBioStat @icart_india @thattai @vishuguttal @rsidd120 @jamewils @UllasKolthur @drpugazh
Apologies for the (very) long thread length, but I thought it was better to analyze all of Karnataka's data in one place , in a single thread
@vrsrini @rprasad12 @abantika77 @thanda_ghosh @patralekha2011 @vincentrk @bhalomanush @scepticemia @aneeshabedi @sandygrains
• • •
Missing some Tweet in this thread? You can try to
force a refresh