On Friday evenings I'm going to release a thread like this on English covid data that I think is useful / reliable. If you don't want to follow the rest of my ranting, the # will be #ahcveng
• Cases: pillar 1
• Care home outbreaks
• Hospital deaths & admissions
• Sundry
• Cases: pillar 1
• Care home outbreaks
• Hospital deaths & admissions
• Sundry
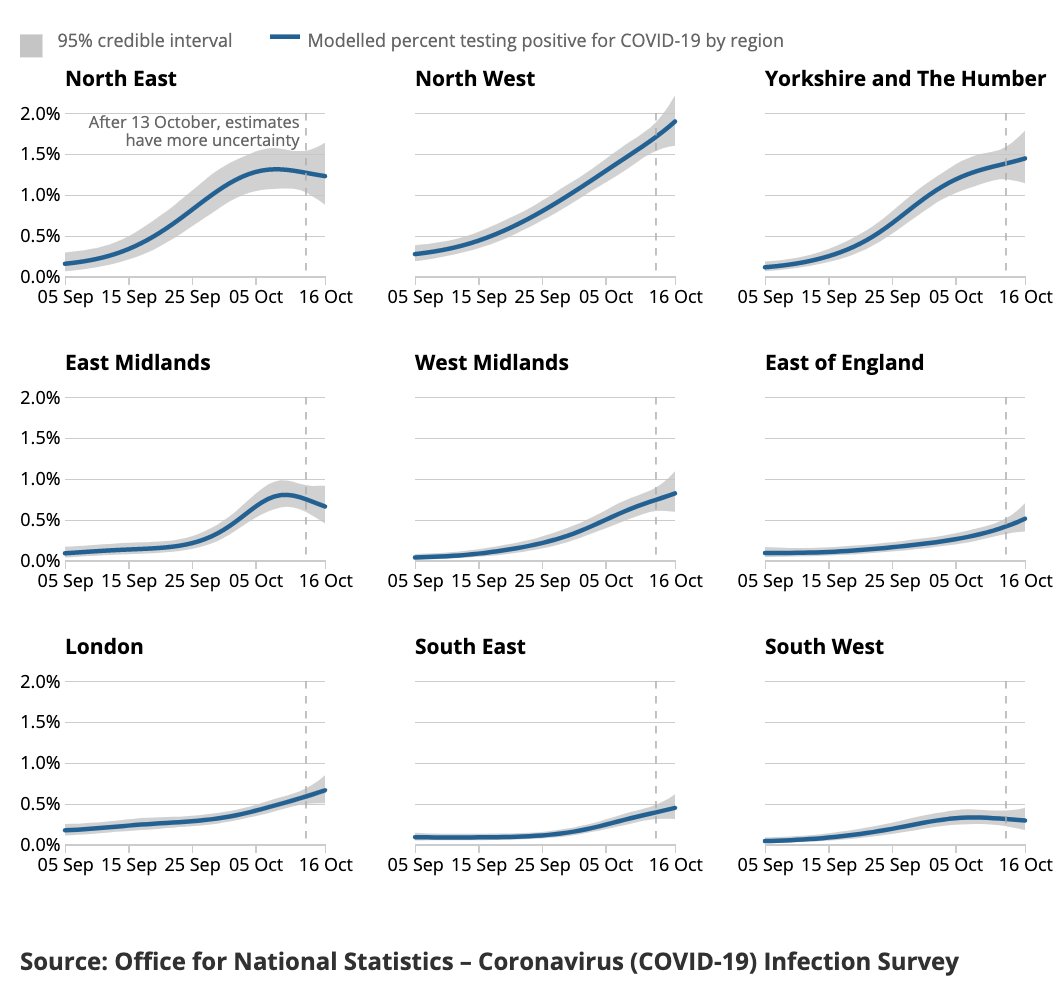
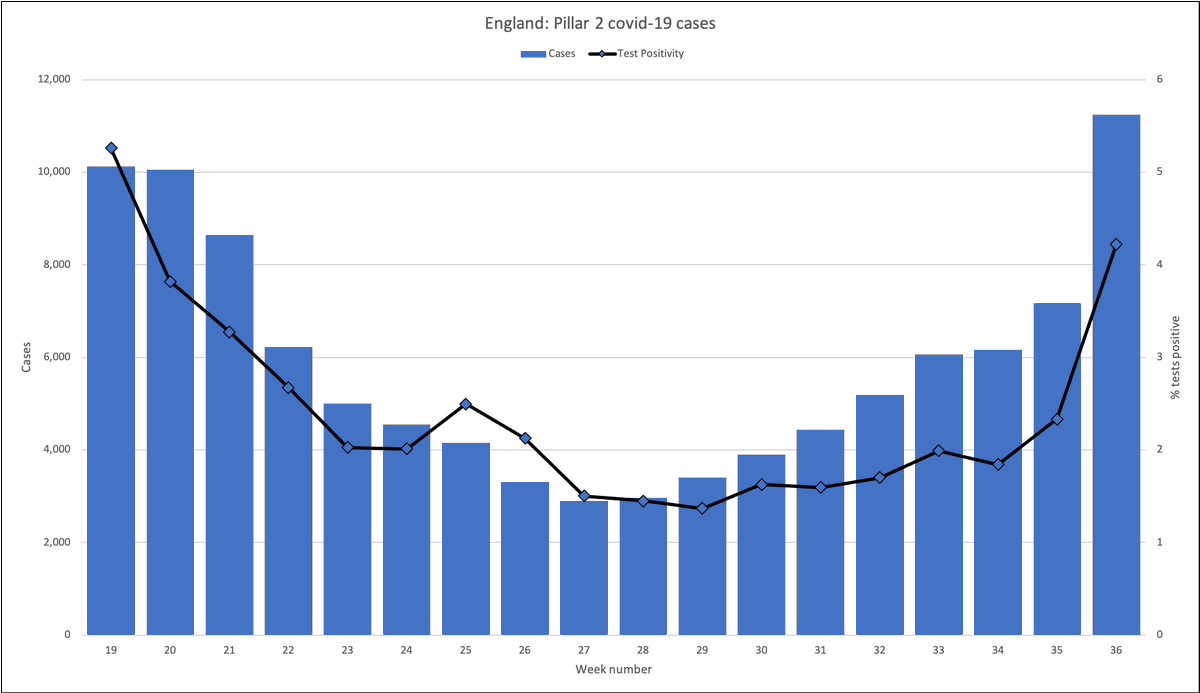
1. English pillar 1 (clinical need & NHS) cases and % positive
Source: weekly PHE surveillance report
assets.publishing.service.gov.uk/government/upl…
#ahcveng
Source: weekly PHE surveillance report
assets.publishing.service.gov.uk/government/upl…
#ahcveng

1a: why not pillar 2? Because I regard the data as corrupted by door-to-door testing of asymptomatic cases in hotspot areas, and testing of children / students with mild symptoms which will 🔼% positive while 🔽 usefulness (more non-infectious high Ct "weak" positives).
2. Care home outbreaks
Compiled from weekly surveillance reports (recording protocol was changed in week 30 report)
Compiled from weekly surveillance reports (recording protocol was changed in week 30 report)

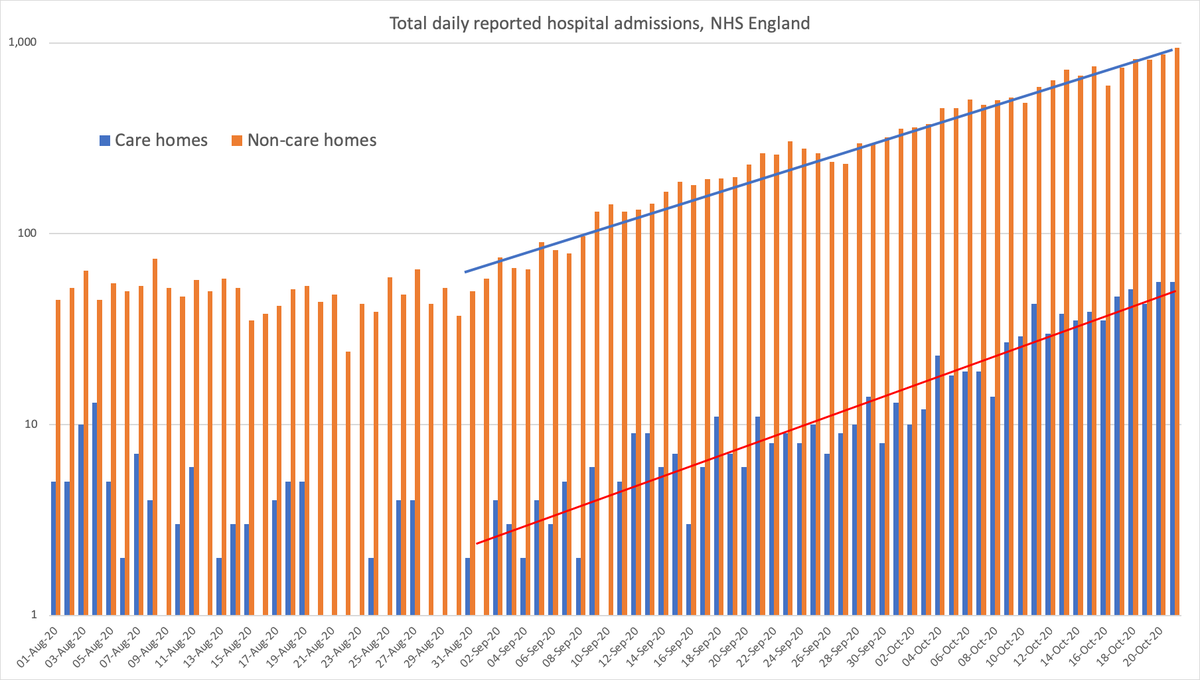
3. Hospital deaths and admissions
Deaths from NHS England stats: england.nhs.uk/statistics/wp-…
Admissions (total & recent) & recent covid patients on ventilators (predictor of deaths): coronavirus.data.gov.uk/healthcare?are…
Deaths from NHS England stats: england.nhs.uk/statistics/wp-…
Admissions (total & recent) & recent covid patients on ventilators (predictor of deaths): coronavirus.data.gov.uk/healthcare?are…


4. Miscellaneous
This section will be different every week. This week:
4.1 Spanish '2nd wave': cases (dark green), deaths (red) and the localised outbreak cases in Madrid & Catalunya (blue)
This section will be different every week. This week:
4.1 Spanish '2nd wave': cases (dark green), deaths (red) and the localised outbreak cases in Madrid & Catalunya (blue)


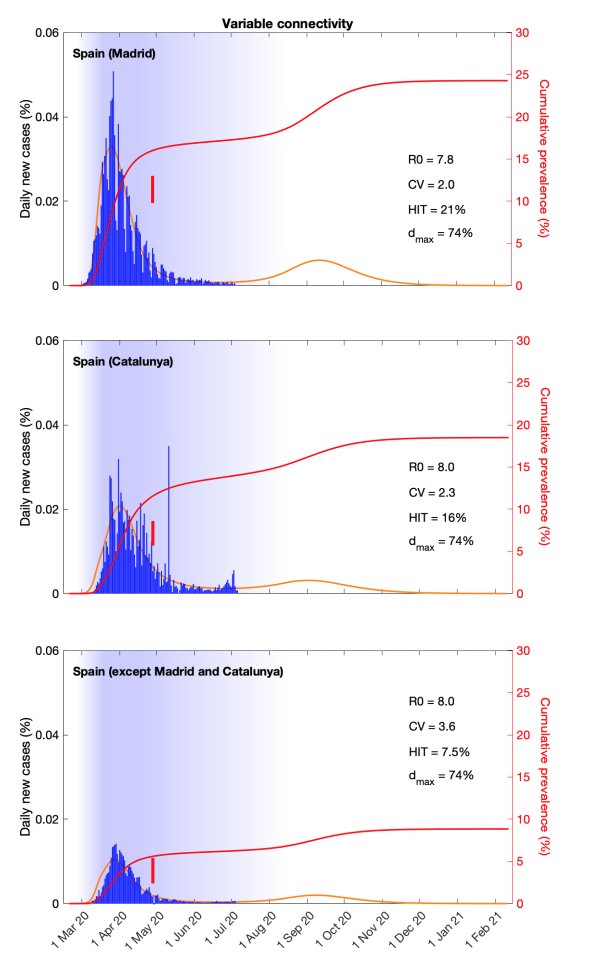
4.2 Compare the English and Spanish death curves above to the projections in a fascinating paper by @mgmgomes1 team, in July. They projected 2nd waves; time will tell.
medrxiv.org/content/10.110…
medrxiv.org/content/10.110…


4.3 111 Triage data
This is normally extremely useful data, but was always likely to be thrown out by an abnormal no. of calls for 0-18 year olds before schools went back, and 18-21 year olds before uni / college. >70 (RH axis) is the vulnerable group.
digital.nhs.uk/data-and-infor…
This is normally extremely useful data, but was always likely to be thrown out by an abnormal no. of calls for 0-18 year olds before schools went back, and 18-21 year olds before uni / college. >70 (RH axis) is the vulnerable group.
digital.nhs.uk/data-and-infor…

• • •
Missing some Tweet in this thread? You can try to
force a refresh