#Thread: Map preparation is an easy job but meaningfull interpretation of spatial data & analysis behind maps is NOT. It requires good understanding of data & their representation of ground reality
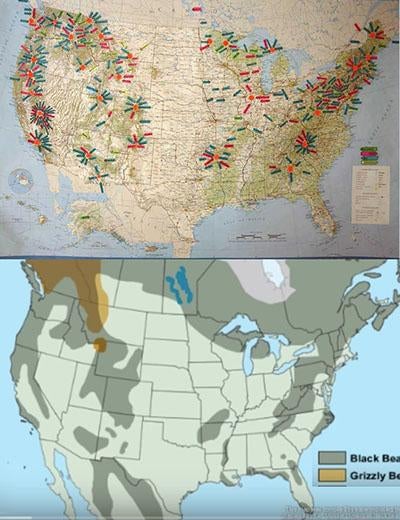
Snapshot of misleading/fake correlation that has been circulating
1/n
The fake/misleading correlation implies that the missing people data locations in US correlates with location of Caves in US (indicating that they went missing in caves)
Map in top claims to be missing people location
Bottom Map is cave location
Discussing why its not real
2/n
The original version of the map (in top) is not representing all missing people in US but infact a rough representation of people gone missing in National parks, remote areas alone (where caves are there anyway) i.e no data from cities or other rural places
3/n
But if you notice that the original map didn't have any black dots. These are cave entrances that have been added to the map by someone.
What does that mean?
The top and bottom map show same data (cave)!
4/n
If you have same data on both sides, then of course it would correlate!!!
5/n
There was another map that claims that it correlates with Black Bear range instead
Of course it would correlate, bcz missing people data is only for parks, protected areas etc where bears live
It's not bcz of Black bears, its bcz data is collected only from those places
6/n
Maps are no different from Statistics and they can be manipulated..
Rephrasing Benjamin Disraeli's quotes:
“There are three types of lies -- lies, maps, and statistics.”🤣
But do investigate all the time!
n/n
Snopes says it's mixture. Data is of course not having errors, but the interpretation is the key here
Of recently, we might have come across the news that a lot of erosion has happened right next to the famous Murugan temple in Tiruchendur. In this thread of maps, I would discuss the causes and possible solutions
To provide context, this photo shows the area near the next to the temple which has eroded significantly and the beach used to extend further
#Satellite image shows the Tiruchendur coastline from last year in the month of January. The beach marked to the south of Murugan temple is the one facing erosion.
#Thread without Maps on #floods
If physical problems and solutions are known theoretically, then why are we not able to solve flooding situations in our cities whether it is Chennai or Bengaluru or Delhi?
There are 4 layers to the prob - Technical, Planning, Finance, Governance
Technical:
Our cities are not designed to take the rainfall that they face. The storm water drains are inadequate and the network is disconnected. Most of the drains are built in adhoc manner (if they are built). But why does this happen?
Cities don't have a storm water management plan. A plan that can comprehensively provide the technical details on the storm water network based on run off calculations, land etc is absent in most cases or poorly prepared in the remaining.
Why hasnt been it prepared?
#Thread on Vijaywada floods
In September this year, after a spell of heavy rain, Vijayawada was affected by severe floods. This thread would explore the geographical reasons behind it and what can be done from here.
(1/n)
2. #Map shows the profile of four major rivers in India. Vijayawada is in the lower section of Krishna river and close to where the river exits the plateau and enters the deltaic flat plains.
3. There are 3 basins in the region whose histories are intertwined. Vijayawada city is sitting on the Krishna and Kolleru systems. Though the Krishna river was also flooding, the city was actually flooded by Budameru Vagu, a seasonal river which is part of the Kolleru system
Google maps shows my GPS position to be well inside the sea in #Chennai Marina beach. But I was away from it. Why?
#Thread continuation of my previous one on Chennai #Marina beach 1/n
In the previous thread, I had explained how Marina beach is growing (sea becoming more and more land). Because of the longshore drift, lots of sand hence gets settled in the mouths of Cooum River.
To prevent further siltation in the mouth of the river, the government had built Groynes so that the capacity of the river doesn't get reduced.
#Thread
#Marina beach is one of the most iconic destinations in Chennai and one of the most visited beaches in the world. However the beach as we see today didn't exist a century ago.
This thread explains the formation of #Chennai's Marina beach 1/n
This map below shows the approximate original coastline of Chennai during British era. It was much closer to the Kamarajar road. A promenade was developed during the british era and that is when it got the name, "Marina". However the big sandy expanse itself didnt exist 2/n
Seas are very dynamic in nature. Whenever the waves hit the beach which is called as "swash", they bring in sand and when the water goes back ("backwash"), it removes the sand. This balance is critical for beach existence.
#Thread of #Maps that can help understand the #WayanadLandslide incident, its causes & impact
Please note that all the maps below were created with the information available as of now. Some of the damages outside the areas denoted might have been missed as info keeps coming
1. This part of #Wayanad is within the Chaliyar river system. It is a west flowing river which drains into the laccadive sea on Kerala coast (though at this part it is north and east flowing)
This map shows where the water drains. The area that is affected is shown in red.
2. In this particular section, the stream arises at around 2000 metres above mean sea level and has a steep fall of around 1200 m to reach Vellarmala, Chooralmala section.