Say you have a completly harmless virus (IFR=0) that can spread at R0=3.3 and you can find via PCR for 19 days. How many deaths per million would you find if you test all deaths in an average european city? cc @LDjaparidze
So now that I got your attention. Let's narrow it down. Our harmless virus would be found during it's spread frenzy at a rate of
OK. It seems I have a few epidemiologists playing. Here is a curve ball. Would change the results if we "Do nothing" (let it spread unmitigated) or if we mitigate it ('lockdown, masks, etc')? I know it is harmless!! Play along.
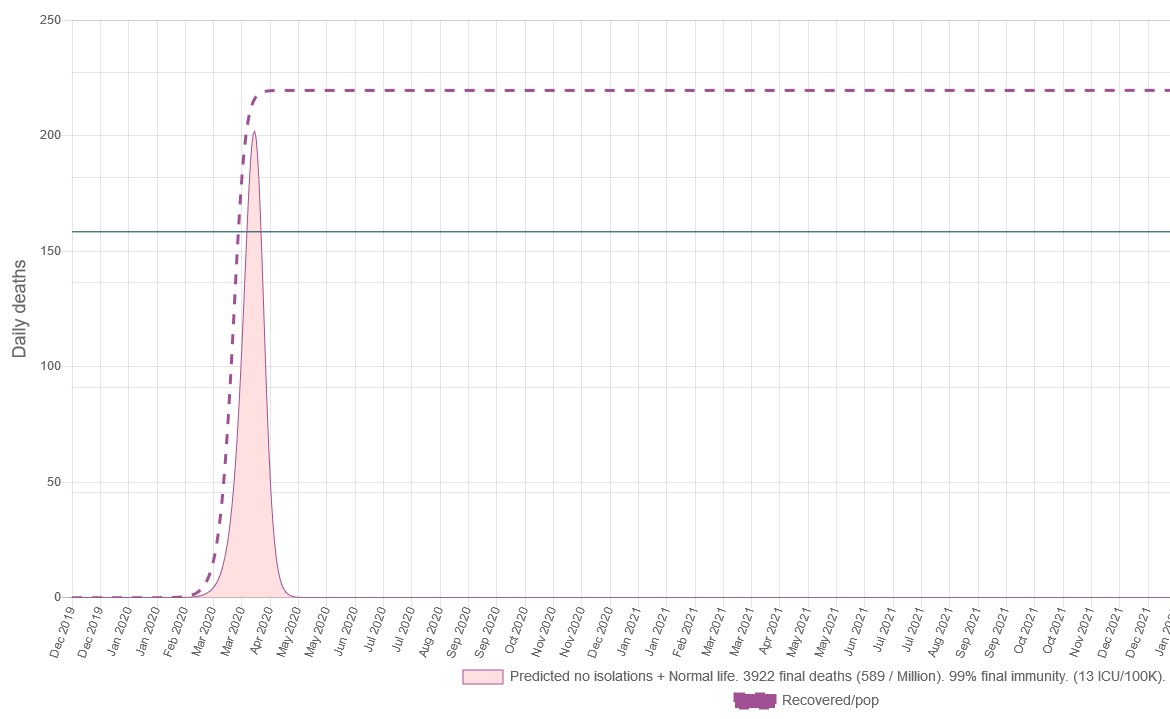
So let's see. If we don't do anything, an R0=3.3 harmless virus would burn out pretty fast. And in doing so we sould be able to find positive deaths at a rate of roughly 589 deaths per million.
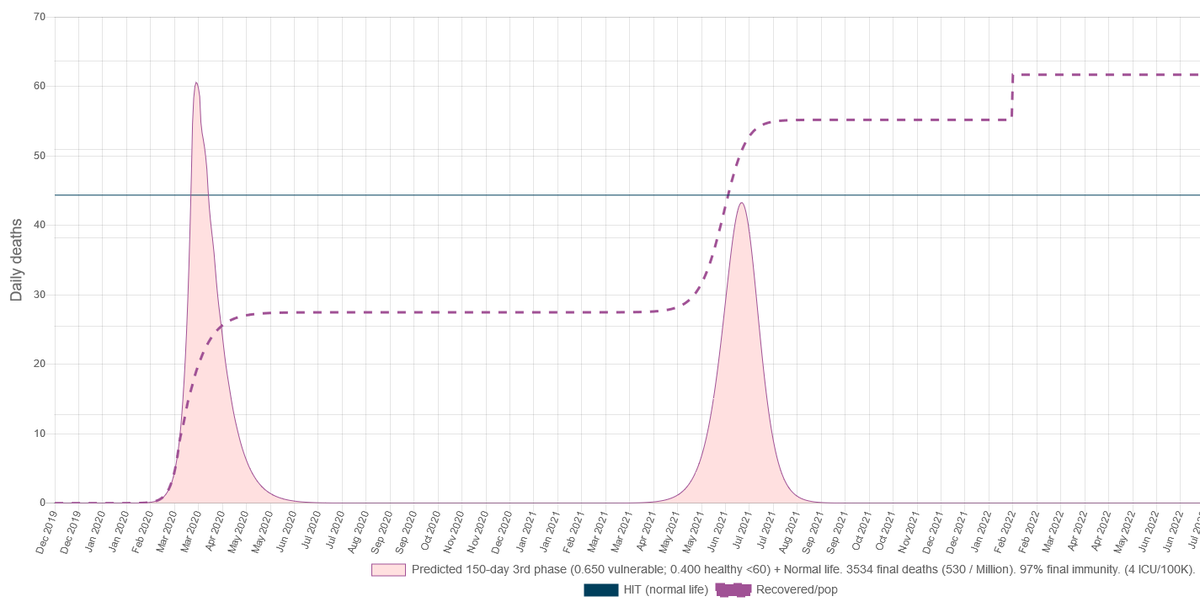
Now, if instead of "Do nothing" we pull a Madrid style mitigation for 180 days and the come back to normal life?
We mitigated, so instead of 1 very high spike now we have 2 of them. But interestingly it is lower at a rate of 530 deaths per million.
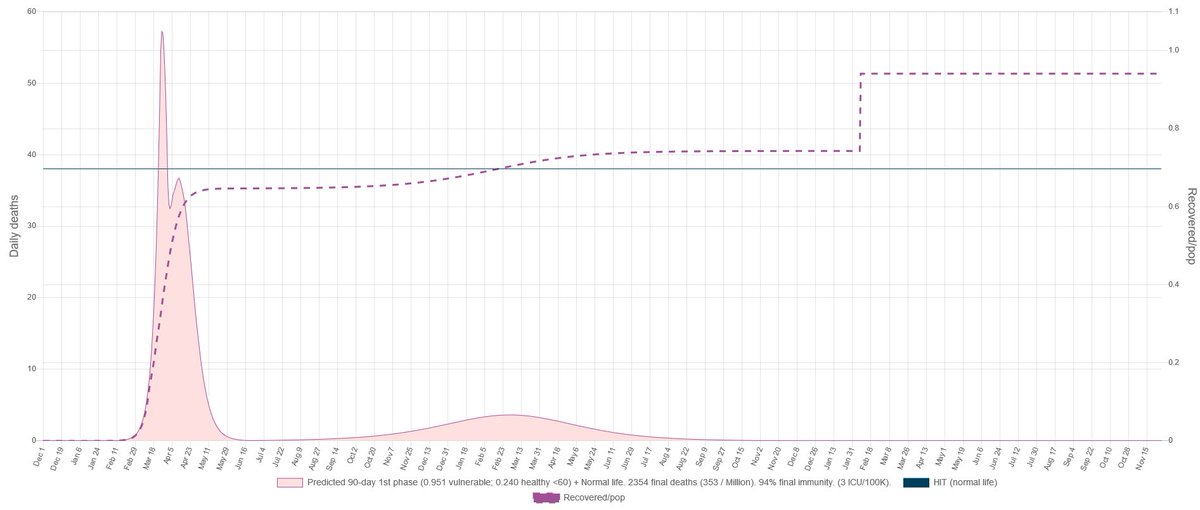
It wasn't going to be so easy. If instead of a Madrid we would have done a Stockholm?
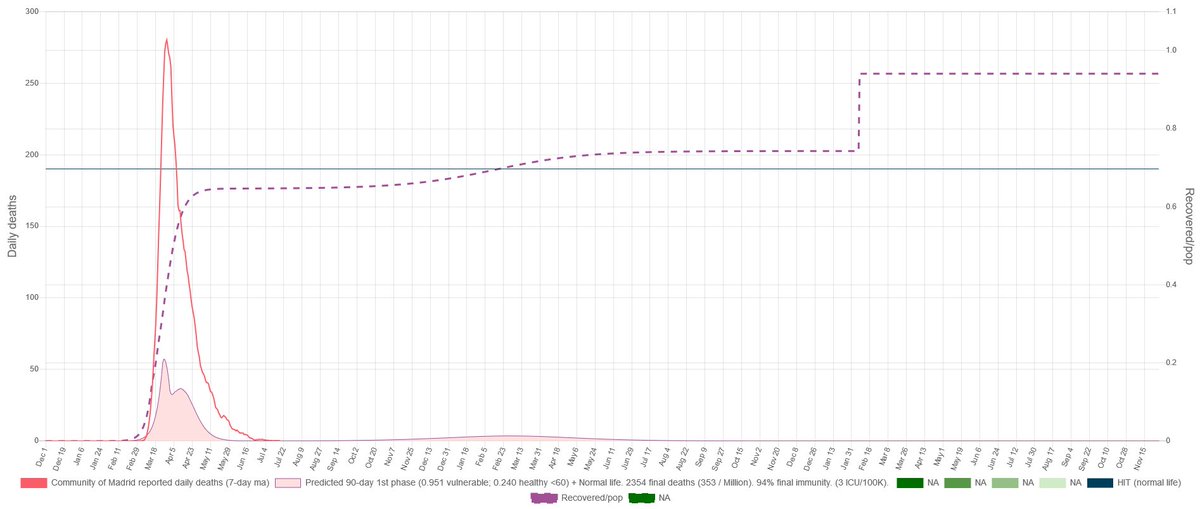
Interestingly the height of the spike is not much different, BUT the second is much lower. The interesting thing is that we could detect our harmless virus at an outstanding rate of 353 death per million. Weird right?
So the question is: How?
I know right... The idea that the spread of a disease can be described linearly is wrong. Whatever you think you know about the behavior, is probably wrong (weird math). Even the smallest detail can change the outcome. Certainty it's always a trap. Principles of biology.
But still, it is an interesting exercise to understand how sensible are the parameters to disturbances. Because that gives you context. Let's assume now this was Madrid. And there is a second clearly not harmless virus around.
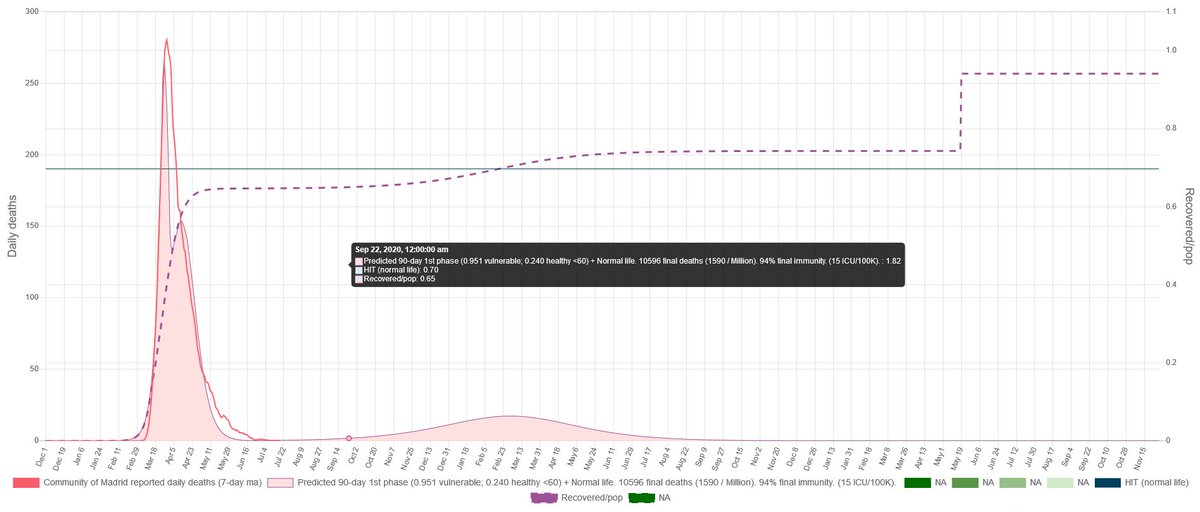
This is on our simulation how Madrid would look (given the parameter estimation we did) and how it would unfold following what has probably been happening in summer.
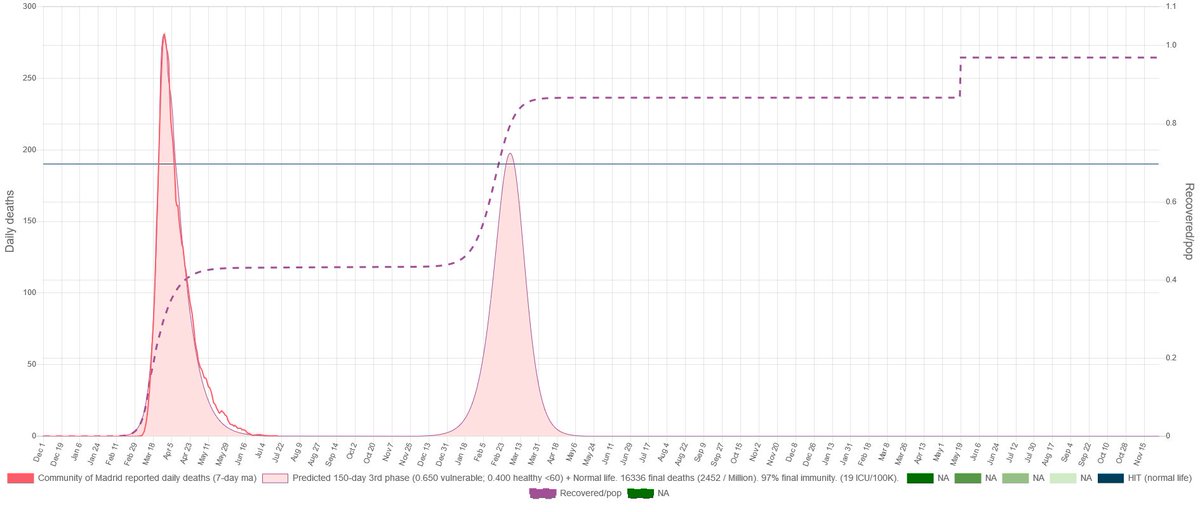
This is on our simulation how Madrid would have look (given the estimation we have for Stockholm) if it would have followed the Sweden Strategy
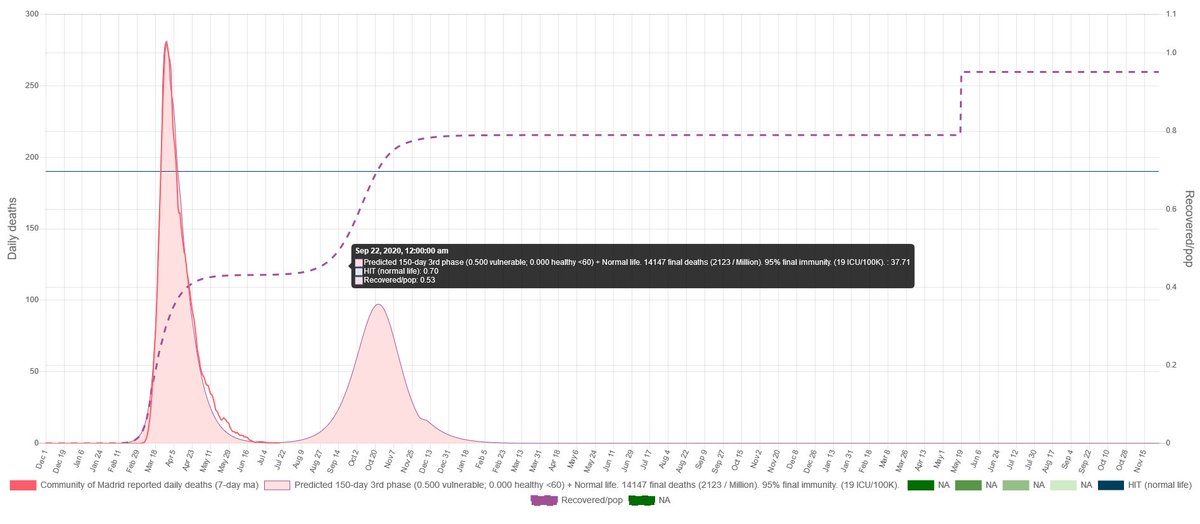
And this is how our simulation looks if Madrid continues mitigating as it would have done during the spring. Spike could start early because that would depend on our case on the seeding we do to the simulation. The overshooting could be big.
Weird math. I know.
And now the ultimate tests!! Didn't I say that the original virus was harmless? If the IFR is 0 where are all those deaths coming from?
1/n Language is powerful, because it gives hints on what is going on. I am in my home town, a 150k inhabitants city that has been isolated by government for a long time. Given my parents live here I have been tracking COVID here from early on.
2/n I even know the city infectious disease public official here and we exchanged notes on the early outbreak when there was just 2 deaths. Our estimation back then was between 120 to 150 deaths by the end of it.
3/n Fast forward to today, if we use the conservative method used by the WHO and CDC for correcting detected and actual infections it gives that 120k were infected. Remember 3rd world testing infrastructure.
1/n It is our view with @LDjaparidze that lockdowns cause harm in subtle way. They do stop the virus, mind you, but when it eventually circulates again (and until vaccination it always does) vulnerable willpower to isolate is gone.
2/n Death minimizing is about virus circulation among healthy <60 while vulnerable *are still willing* to isolate at high levels. That is exactly what didn't happen in Argentina after the 5th month of lockdown.
3/n Oblivious to most (even the expert epidemiologists) after lockdowns death minimizing requires overshooting healthy <60 infections while vulnerable isolate at very high levels. None of that is happening.
1/ The first rule of Lockdown Club is: You do not talk about deaths per million. The second rule of Lockdown Club is: You do not talk about deaths per million.
2/ Third rule of Lockdown Club: someone yells Sweden or herd immunity, you point out the other Nordics. Fourth rule: only two metrics to a discussion, cases and cases.
3/ Fifth rule: one lockdown per season, fellas. Sixth rule: no deaths, no herd. Seventh rule: lockdowns will go on as long as they have to.
Controversial opinion: those that say its not possible to shield the vulnerable, also won't be able to prove if there is a difference (or lack of it) between the trajectory of the virus at Madrid and Stockholm. Who do you think has let it rip?
1/ There were many "Eureka" moments while working on our paper, but probably the most important of all happened pretty early. Non-linear models are highly sensitive to:
2/ We decided early on to eliminate as many parameters as possible. Location parameters are simple to fix, they are location parameters. Viral parameters also, you can go and say R0=3.3 and you made a choice. How many parameters are left if you do that?
2/ We extended the SEIRS model to support stratified isolation levels for healthy <60 and vulnerable individuals.
3/ We forced the model to predict daily deaths curves and the reported age serology ratio for key metropolitan areas in Europe. The immunity level estimations obtained were: Madrid 43%; Catalonia 24%; Brussels 73%; and Stockholm 65%.
0/n Thank all of you who participated in 'The demon game'. I am taking a screenshot because when knowing the whys it loses all value (there is no more asymmetry of information). These 182 responses are 'The sample'.
1/n You may have already known about this thought experiment you just run on, mainly because there are many different variants of it in the literature. This is the one that I have seen lately:
2/n This example is good because the results are clear-cut to show 2 typical sources of error. Poor experimental setups are the bain of our existence and there are myriad ways they can go wrong.