
1/ Spent the evening slicing and dicing the @ONThealth COVID19 case-by-case database. Found here: data.ontario.ca/en/dataset/con…
2/ My goal was to see if I could glean anything from the data that could answer why rising case numbers are not resulting in material increases in new hospitalizations, and why new deaths are de minimis. @ONThealth
3/ We are seeing this phenomenon in many jurisdictions around the world (case explosions, deaths flatlined). The UK is one very good example, and Canada is experiencing the same. 
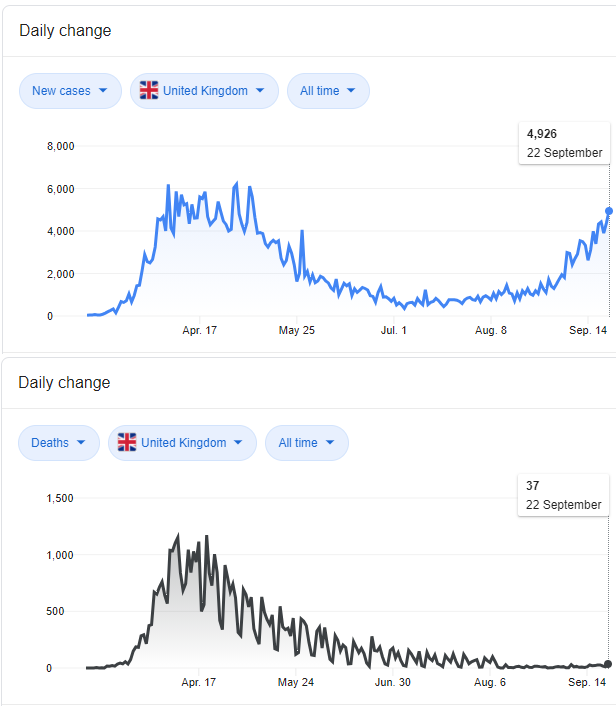
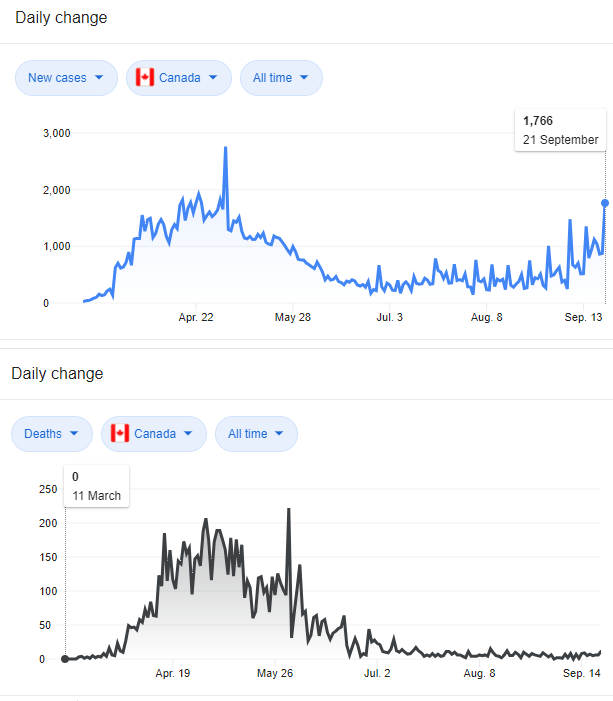
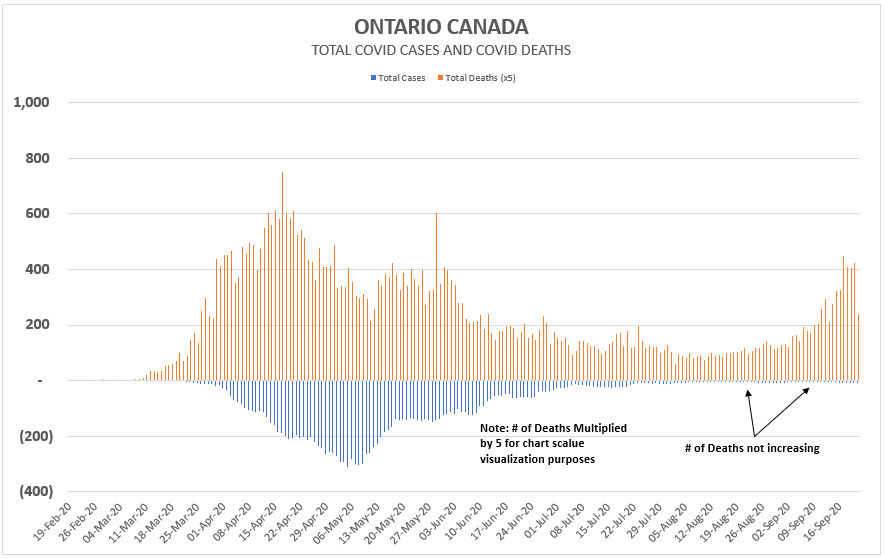
4/ The @ONThealth case data is rather useful, and I recommend those interested download it. From it, I create the below chart, that illustrates the Ontario epidemic since the February.
Cases explode, many deaths tragically follow, cases subside then increase, but not deaths.
Cases explode, many deaths tragically follow, cases subside then increase, but not deaths.
5/ Why ??
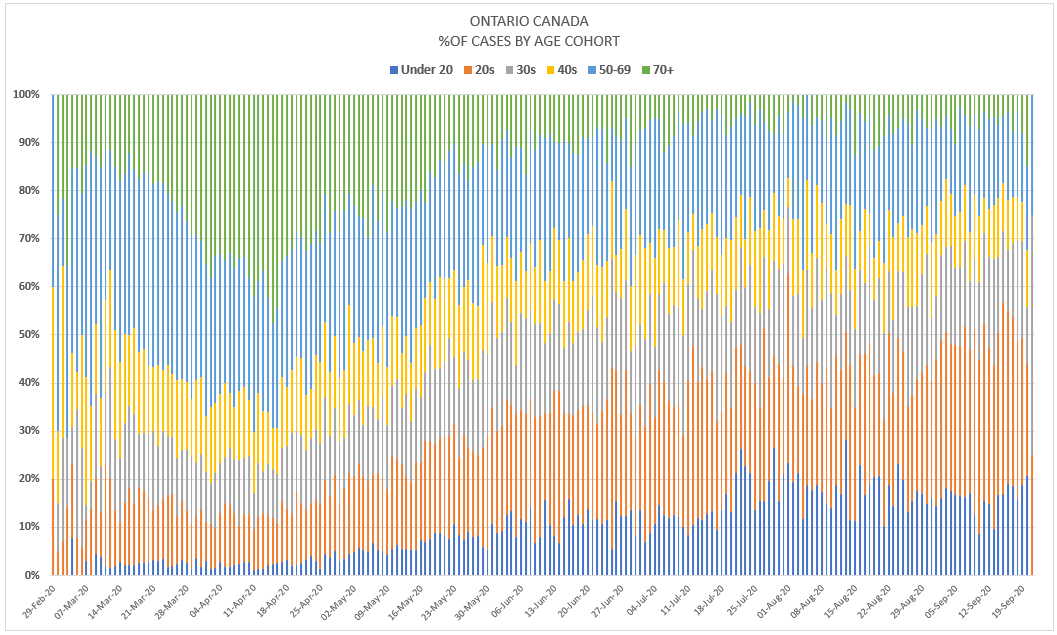
6/ The most common sense / typical explanation is that younger age cohorts are responsible for increased case counts, and that population is less vulnerable to complications and death. Which we know is true.
7/ Digging just a little deeper, though, and looking at case fatality rates, not ONLY by AGE, but also by OUTBREAK STATUS, we learn a lot more.
8/ Because the @ONThealth case data is so rich, we can cut the data into cases and fatalities by
(i) age;
(ii) outbreak status; and
(iii) age AND outbreak status
(i) age;
(ii) outbreak status; and
(iii) age AND outbreak status
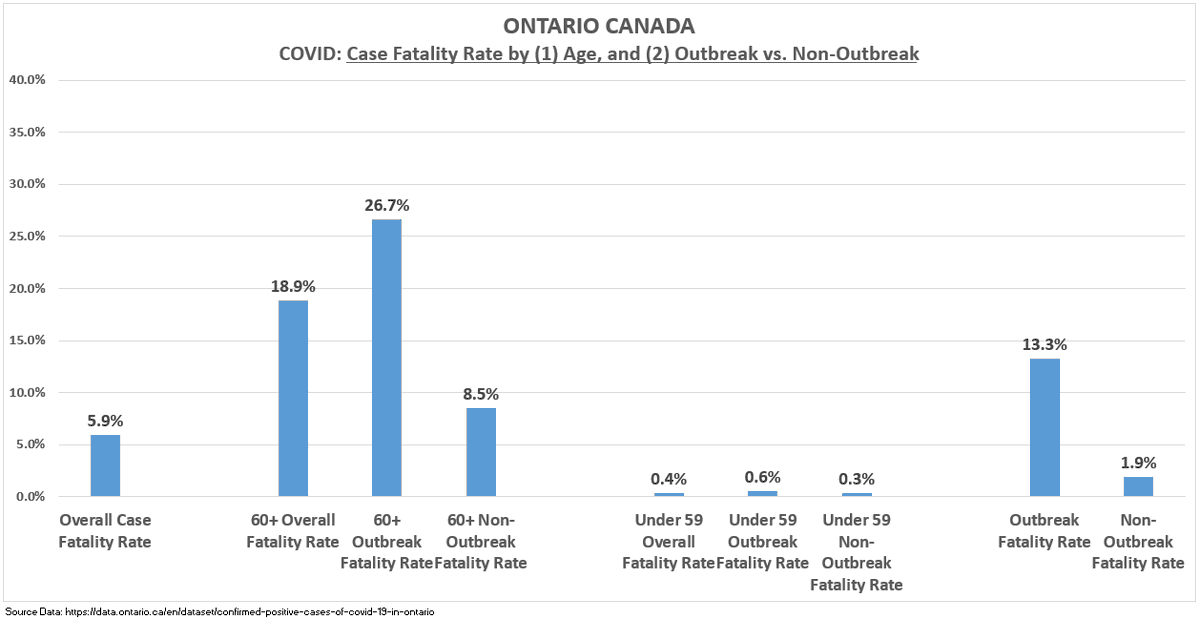
9/ This chart shows Ontario's overall fatality rate (5.9%, a scary number).
But also: fatality rates by age AND outbreak status. We see:
60+ fatality rate: 18.9%, but
60+ in an outbreak setting (i.e. LTC/Retirement): 26.7%
60+ in general population: 8.5%
But also: fatality rates by age AND outbreak status. We see:
60+ fatality rate: 18.9%, but
60+ in an outbreak setting (i.e. LTC/Retirement): 26.7%
60+ in general population: 8.5%

9b/ Same chart shown again, we see:
Under 59 Overall Fatality Rate: 0.4%
(With Outbreak and Non-Outbreak fatality rates not materially differing.)
Under 59 Overall Fatality Rate: 0.4%
(With Outbreak and Non-Outbreak fatality rates not materially differing.)
10/ The conclusion I glean is higher expected fatality rates in older age cohorts is only half the answer:
Cases in LTC/retirement homes (60+ & Outbreak status as the proxy) *SKEW* overall fatality rates higher.
Older ages in the *general population* may be safer than we think.
Cases in LTC/retirement homes (60+ & Outbreak status as the proxy) *SKEW* overall fatality rates higher.
Older ages in the *general population* may be safer than we think.

11/ ...continuing the above thread with more interesting insights from continuing to parse the @ONThealth #COVID19 case data found here: bit.ly/3iZtRpA
12/ Given we are not seeing material increases in deaths comparable to the first wave, with the main narrative seeming to be the greater % of cases in younger ages, I was curious to see how fatality rates are differing from the first wave to the “Current Wave”, overall & by age.


13/ A couple quick definitions (my somewhat arbitrary definitions):
First Wave: Jan to June 15th
Current Wave: June 16th to Sept 24th
The June 15th “cut-off/splice” corresponds to when Ont first reached summer peak testing capacity, & case positivity well <1%, deaths <10/day.
First Wave: Jan to June 15th
Current Wave: June 16th to Sept 24th
The June 15th “cut-off/splice” corresponds to when Ont first reached summer peak testing capacity, & case positivity well <1%, deaths <10/day.
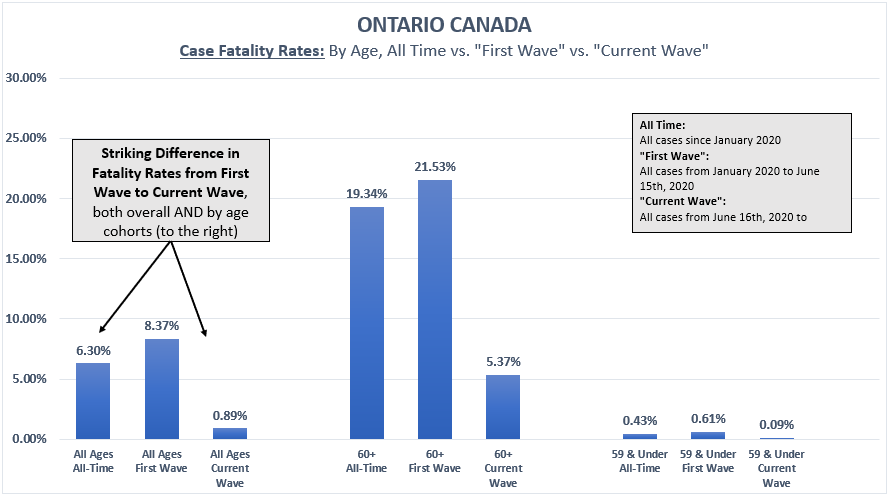
14/ Results? Quite simply, there are STRIKING differences in fatality rates from the First Wave to the Current Wave:
All-time: 6.3%
First Wave: 8.37%
Current Wave: 0.89%
(note: only resolved/fatal cases included, so recent & non-resolved cases don’t inflate the denominator)
All-time: 6.3%
First Wave: 8.37%
Current Wave: 0.89%
(note: only resolved/fatal cases included, so recent & non-resolved cases don’t inflate the denominator)

15/ Same chart again. Current lower fatality rates are not simply driven by a greater % of cases being in the younger age cohorts. Case fatality rates are down materially in BOTH the 60+ age cohort (and in each 10yr cohort, see next tweet), and as well in younger age cohorts.
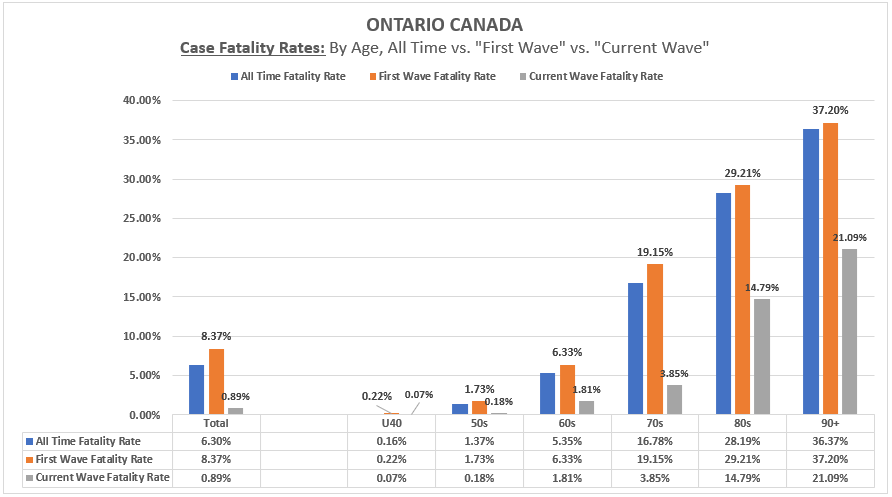
16/ Same First Wave vs. Current Wave case fatality rates, except broken down by the 10yr age cohorts.
Case fatality rates are down materially in all age cohorts in the Current Wave vs. the First Wave.
Case fatality rates are down materially in all age cohorts in the Current Wave vs. the First Wave.
• • •
Missing some Tweet in this thread? You can try to
force a refresh


